Power-Saving in Storage Systems for Internet
Hosting Services with Data Access Prediction
Jumpei Okoshi
Department of Computer Science, University of Tsukuba, Japan Email: [email protected]
Koji Hasebe
Department of Computer Science, University of Tsukuba, Japan Email: [email protected]
Kazuhiko Kato
Department of Computer Science, University of Tsukuba, Japan Email: [email protected]
Abstract—We present a power-saving method for storage systems in Internet hosting services, particularly those providing video/photo sharing services. The key idea behind our method is to skew the workload towards a subset of disks in the storage array, thereby extending the periods in standby mode of the other disks. Our method is based on the idea behind PDC, but the main objective of this study is to investigate a method that is adaptable to both constant massive influx of data and changes in data popularity over time. Moreover, to reduce accesses to disks in standby mode, our method periodically rearranges data in the order of potential future accesses presumed to be associated with elapsed time after upload and the accesses in the past, instead of just sorting according to the latest number of accesses. This correlation is obtained by analyzing access patterns for 45,000 randomly selected public photos on Flickr. Performance is evaluated through both simulation and a prototype implementation. In the experiments, we observed that our method saved 24.0% of running time of the disks in active mode, with an overall average response time of 47.6 ms, in which 0.43% of the total accesses involved disks in standby mode.
I. INTRODUCTION
Power consumption has become a major concern in the development of computing systems. In particular, as a high percentage of the total computing energy is consumed by the storage systems, various attempts at reducing power in storage systems have been proposed, such as MAID [2], PDC (Popular Data Concentration) [9], and DIV [10] (cf. also [1] for a comprehensive survey of this research area). Recently, with the advent and rapid growth of cloud computing, research into power-saving for data storage has shifted its target from a system consisting of a relatively small number of disks to datacenter-scale systems [5], [7], [14], [15]. These studies are essentially based on a commonly observed technique, that is, they skew the workload towards a small number of disks, thereby enabling the other disks to remain in standby (i.e., low-power) mode. Thus, the major interest in recent studies is how to enhance scalability of this basic idea while ensuring good performance. However, given the current reality of today’s data-intensive Internet-based services, as typified by Internet hosting services like YouTube1 and Flickr2, the following
important issues have not been thoroughly investigated. First, most previous studies either explicitly or implicitly assumed that the size of the stored data is fixed. However, in
1http://www.youtube.com 2http://www.flickr.com
real cloud hosting service environments, vast amounts of data are uploaded continuously. For example, according to Flickr’s reports [3], [4], the total number of stored photos reached 5 billion in September 2010 and 6 billion in August 2011, which means growth of 3,000 photos per minute. Another example is that of YouTube, which received 65,000 videos per day in 2006 [13]. Moreover, popularity (i.e., access frequency) of stored data generally decreases after the upload. This situation repeats itself not only in hosting services, but also other massive computing environments, such as the analysis of big data, online storage services, and vast customer databases in e-commerce.
Second, previous studies often assumed that there is a specific type of central controller to effectively skew the workload. However, this technique cannot be directly applied to large-scale storage systems owing to scalability.
To address these issues, in our previous work [8] we proposed a method based on PDC. The idea behind PDC is to periodically reallocate storing data in the disk array by order of population. Similarly, the method in [8] periodically exchanges data such that frequently accessed disks tend to gather frequently accessed data from neighboring disks up to their capacity, while the opposite occurs for rarely accessed disks, thereby extending their time in standby mode. But, unlike PDC, our reallocation is realized in an autonomous way so as to enhance the scalability. In our previous study, we also measured the performance using the actual access patterns of public photos on Flickr, which are observable outside the website. The results showed that our method skewed the workload up to a point, thereby reducing the total time during which the disks were active. However, to further reduce the running time in active mode, if we increase the threshold time for transition from active to standby mode, a significant number of accesses are of disks in standby mode. Thus, because such accesses take extra time (usually 5–10 seconds) to spin up disks, we faced a serious trade-off between the performance in power consumption and response time. A major reason for this problem is that in a real environment most of the uploaded data are rarely accessed as time goes by, but occasional accesses persist and seem to occur randomly. Thus, merely by sorting data by the latest number of accesses as is the case in PDC, it is difficult to identify data that will not be accessed for a while and confine these to a subset of
disks.
The objective of this paper is to improve our previous work, specifically by reducing accesses to disks in standby mode without degrading the performance. To achieve this objective, we first traced access patterns of approximately 45,000 randomly selected public photos on Flickr for around 6 months. In this preliminary study, we observed that potential future accesses correlate strongly with the combination of elapsed time after upload and the total number of accesses in the past. Using this correlation in our proposed storage system, data are periodically rearranged in the order of potential future accesses, instead of merely sorting these data according to the latest number of accesses. In addition, we add some refine-ments to our previous system architecture without introducing a central controller to manage the data migration.
To evaluate the effectiveness of our method, we measured the performance in both simulations and a prototype imple-mentation using the access traces of public photos on Flickr. In the experiments, we observed that our method saved 24.0% of running time in active mode, with an overall average response time of 47.6 ms. Moreover, accesses of data stored on disks in standby mode were only 0.43% of all accesses, which is an improvement of less than 3% on the result of the previous work.
The contributions of this paper are threefold. First, our study investigates a technique for power-saving that is adaptable to both a constant massive influx of data and changes in data popularity over time. Second, unlike PDC, in our method data are reallocated in a distributed way instead of using a central controller to manage access frequency, thereby ensuring scal-ability. Third, we also investigate a technique to reduce the number of accesses to disks in standby mode when adopting the approach of PDC. We note that this issue has not been discussed in the literature on PDC, because they used ideal traces in which accesses were assumed to follow Zipf’s law. However, to deal with data access in real environments, it is necessary to improve the idea behind PDC. As demonstrated in this paper, sorting data according to the predicted future access patterns is an effective measure for solving this issue.
This paper is organized as follows. Section 2 presents related work. Section 3 gives the results of preliminary in-vestigations of access patterns of public uploaded photos on Flickr. Section 4 describes the design of the proposed storage system. Sections 5 and 6 present the simulation results and an evaluation of the prototype implementation, respectively. Finally, Section 7 concludes the paper and presents future work.
II. RELATED WORK
There have been a number of studies on power-saving in storage systems. A common feature of many of these is to skew the workload towards a small number of disks while not overloading them, with the studies classified into the following categories according to variations in their approach.
The first category, which includes MAID [2] and PDC [9], focuses on popularity and concentrates popular data on specific
disks. MAID provides some specific disks as cache to store frequently accessed data, thereby reducing accesses to the other disks. PDC periodically reallocates data in the storage array according to the latest access frequencies.
The second category uses non-volatile random-access mem-ory (NVRAM) to extend the standby mode period by caching data to a write store. A typical example is Pergamum [12], which uses NVRAM to buffer write accesses and store data signatures to reduce direct accesses to the disks.
The final category considers redundancy (i.e., data replica-tion). In DIV [10], original and redundant data are separated onto different disks, thereby allowing read/write requests to be concentrated on those disks containing the original data. Hibernator [18] applies the idea of PDC to RAID and DRPM (Dynamic Rotations Per Minute) systems. RIMAC [17] pro-vides two-layered caches, one for storing storage data and the other for parity conservation. PARAID [16], which is also a power-saving technique for RAID, allocates the replica in a specific way so that data are collected/spread to adapt to changes in operational workloads.
Although the above studies restricted their scope to storage systems consisting of a relatively small number of disks (typically, up to several dozen), in recent years the target of this research area has shifted to datacenter-scale systems. Harnik et al. [5] attempted to apply the idea of DIV to a large-scale distributed storage system. Kaushik et al. [7] proposed the idea of dividing disks in HDFS (Hadoop Distributed File Systems) into hot and cold zones. Verma et al. [14] proposed SRCMap (Sample-Replicate-Consolidate Mapping), which gathers accesses to the replicas on active disks, while Vrbsky et al. [15] proposed a replication approach, called SWIN (Sliding Window Replica Strategy). Hasebe et al. [6] proposed a power-saving method based on the distributed hash table (DHT) technique to skew the workload by migrating virtual nodes in the storage array.
The motivation for this research follows that of the recent studies mentioned above. That is, we investigate an effective skewing technique of the workload in large-scale distributed storage systems based on the approach taken in the first category. In particular, this study can be considered as a direct successor to PDC. However, our main motivation was to explore power-saving in an environment where a vast amount of data is continuously uploaded and the data access frequencies vary at any moment, a prime example of which is an Internet hosting service. As mentioned before, although the issue is not ignorable when applying the techniques to a real environment, it has not been thoroughly investigated in the literature.
III. DATAACCESSTRACING ONFLICKR
To evaluate the effectiveness of our method in a realistic situation, as a preliminary study, we traced access patterns of photos uploaded to Flickr, which is one of the largest photo-sharing services in the world.
In this preliminary study, we randomly selected 45,894 photos and traced the cumulative number of accesses for
0 1000 2000 3000 4000 100 101 102 103 104 105 Time (hour)
Total number of accesses
Fig. 1. Hourly total number of accesses of all 45,894 photos on Flickr.
each file every hour for 4,200 hours (around 6 months) using application programming interfaces (APIs) provided by the website. Owing to limitations on observable data, all the selected photos were public, although the website supposedly has around four times as many private photos as public photos according to a Flickr report and our observations.
In the rest of this section, we first present our observations and the characteristics of the photo data on Flickr and then discuss why the idea behind PDC cannot be directly applied to our target environment. Finally, we show that potential future accesses correlate strongly with the combination of elapsed time after upload and the total number of past accesses, which our proposed system uses as the measure for sorting data by potential future access.
Figure 1 shows the change in the hourly total number of accesses of all files over the 4,200 hours, where the horizontal and vertical axes indicate the elapsed time after upload and the total number of accesses of all photos. This figure shows a strong negative correlation between the access frequency and elapsed time. More precisely, the result shows that the access frequency is the highest (30,862 accesses per hour) after one hour has elapsed and then rapidly decreases, eventually reaching 559 accesses per hour after 200 hours. Although there is a marked decrease in the change in the number of accesses after 200 hours (in which the average number of accesses is 3,340 for 0 to 200 hours, 323 for 201 to 1,000 hours, and 90 for 1,001 to 4,200 hours), it tends to decrease over time.
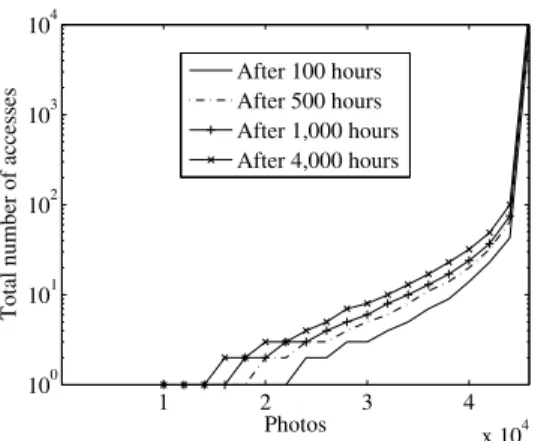
Figure 2 shows the distributions of popularity of all photos after 100, 500, 1,000, and 4,000 hours (where the photos are arranged by the order of access frequency on the horizontal axis, while the vertical axis indicates the hourly total number of accesses for each photo). The figure also shows that the file access frequencies are highly skewed, while the percentages of files that had never been accessed after being uploaded are 29.7%, 24.4%, 21.7%, and 18.2% after 100, 500, 1,000, and 4,000 hours, respectively. The result indicates that there is a strong decrease in access frequency, which is independent of the change in time (68.4% of all photos were accessed less than ten times 4,000 hours after they had been uploaded).
Figures 1 and 2 indicate that the number of accesses has a
1 2 3 4 x 10⁴ 100 101 102 103 104 Photos
Total number of accesses
After 100 hours After 500 hours After 1,000 hours After 4,000 hours
Fig. 2. Distributions of popularity of all photos after 100, 500, 1,000, and 4,000 hours. 0 1000 2000 3000 4000 0 5 10 15 20 25 30 35 40 Time (hour) Photos = 1 = 2 > 2
Fig. 3. Access patterns of 40 randomly selected photos.
tendency to decrease over time (more specifically, it decreases rapidly in the first several hundred hours), and these accesses are concentrated on a small subset of files. Based on the results, it seems that merely by sorting data in the order of the latest access frequency, the storage array can be split into a group of frequently accessed disks and a group of rarely accessed ones without degrading performance, such as response time, in the system. However, as demonstrated in our previous study [8], this is not the case.
Figure 3 shows the access patterns of 40 randomly selected photos. Here, the selected photos are represented on the vertical axis and the accesses are plotted in a horizontal line with the number of accesses after each elapsed hour indicated by the shape of the dot. As observed from this figure, although a photo becomes rarely accessed after a certain time, it continues to be accessed. Moreover, the access patterns are quite different from each other. Thus, even if we can confine rarely accessed data to specific disks, such seemingly-random accesses frequently invoke state transition from standby to active mode, which degrades the response time of the system. To solve the problem, as a measure of predicting future accesses based on past access patterns, we focus on the corre-lation between potential future accesses and the combination of elapsed time after upload and the total number of accesses
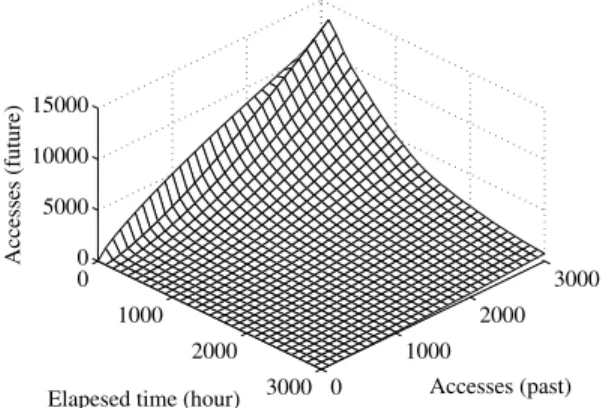
Fig. 4. Raw data access patterns of 45,894 photos. 0 1000 2000 3000 0 1000 2000 3000 0 5000 10000 Accesses (past) Elapesed time (hour)
Accesses (future)
Fig. 5. Smoothed raw data using the average of 100 neighborhood cells.
in the past.
Figures 4 and 5 show this correlation observed in our photo data. (Figure 4 represents the raw data, while Figure 5 is obtained by smoothing them using the average of 100 neigh-boring cells.) Here, the horizontal axes indicate the elapsed time after upload and the cumulative number of accesses up to that point, while the vertical axis indicates the number of
0 1000 2000 3000 0 1000 2000 3000 0 5000 10000 15000 Accesses (past) Elapesed time (hour)
Accesses (future)
Fig. 6. Two-dimensional array indicating the number of accesses in the future.
accesses after that point in time. As the figures show, the shorter the elapsed time after upload is, and the more often a photo is accessed, the more often it is likely to be accessed in the future. To use this correlation as a measure for sorting data in the order of predicted potential future accesses, the raw data are smoothed by the following two steps instead of the latest total number of accesses. First we smooth each cell of the raw data (the result of which is presented in Figure 5), and then approximate the number of future accesses after each elapsed time with a power function using the least squares method (the result of which is presented in Figure 6 as a two-dimensional array). Here, although the elapsed time and the number of past accesses are limited to 3,000, it is possible to expand these parameters or recalculate the array according to the file uploads.
IV. SYSTEMDESIGN
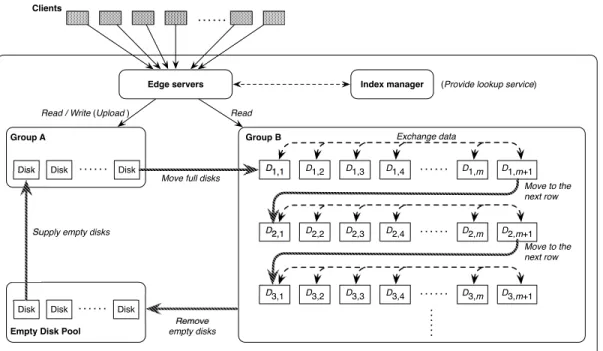
Our proposed storage system is composed of several thou-sand (possibly heterogeneous) disks with unique IDs, edge servers, an index manager, and some I/O servers. (See also Fig-ure 7 for the graphical presentation of the overall architectFig-ure. For readability, we omit the I/O servers.) Each of the disks is physically connected to an I/O server and is logically classified into one of three groups: Group A, Group B, and the Empty disk pool. As we shall see below, each disk travels among these groups (depicted by the thick arrows in the figure) depending on its state. Initially, some are placed in Group A and the rest in the Empty disk pool. The edge server handles the read/write operations from the clients, while the index manager provides a lookup service for data accesses.
Files uploaded by the clients are always written to the disks in Group A via the edge server and the corresponding I/O server. At that time, the index manager assigns a unique ID to the file and records it and the stored disk ID. After the upload, the total number of read/write accesses to each file is counted by the storing I/O server. If a disk in Group A becomes full, it moves to Group B and a new empty disk is supplied to Group A from the disk pool. Thus, the number of disks in Group B continuously increases according to the data uploads, while the number of disks in Group A is maintained constant.
The disks in Group B are logically allocated in a rectan-gular grid consisting of m columns and n rows. Here, the intersection point of thei-th row (from the top) and the j-th column (from the left) is denoted by (i, j). In addition, the disk at (i, j) is denoted by Di,j. The numbers of rows and columns may vary over time, but are uniquely determined by a predefined rule relating to the total number of disks in Group B. The disks in Group B behave in the following way. When a disk moves from Group A to B, it is placed at position (1,1) and then moves to the right (i.e., from (1,j) to (1,j+ 1)) every time a new disk is added to Group B. If the number of disks in the row exceeds the prefixed numberm, the files stored in this row are rearranged in the following three steps so that the files whose potential future accesses are presumed to be the fewest among the files in this row are gathered in the rightmost disk (i.e.,D1,m+1). (For readability, the potential future access of
!"#$%&' !"#$ !"#$ ()()()()()( !"#$ *+,-.)/ !%&% ()()()()()( *+,-.)0 "#$%&'()*+&,& ()()()()()(
-)&+*.*/01,)'(2345&+*) -)&+
!"#$ !"#$ ()()()()()( !"#$ 12.&3)4#'5)6,," 673348*)93,8*+1:;: -)95<)* )93,8*+1:;:* =5<)*>744*+1:;:* 178$)'$+9$+' :%7$;)2<%<8$+
!%&* !%&+ !%&, !%&9 !%&9-%
!*&% !*&* !*&+ !*&, ()()()()()( !*&9 !*&9-% =5<)*,5*,%)* ')#,*05?
!+&% !+&* !+&+ !+&, ()()()()()( !+&9 !+&9-%
()( )() ()( )( =5<)*,5*,%)* ')#,*05? (@05<1+)*455;73*:)0<1$))
Fig. 7. Architecture of the system.
file f is denoted by pf a(f), and file f stored in disk D is denoted by the expression f ∈D.)
Step 1: When the disks overflow the row, each I/O server evaluates the potential future accesses from the com-bination of elapsed time after the upload and the total number of accesses in the past for all its stored files according to the result of statistical analysis in Section III (shown in Figure 6).
Step 2: The information about the potential future accesses for all files in the row is gathered on the I/O server forD1,m+1.
Step 3: If max{pf a(f) | f ∈ D1,m+1} is greater than
min{pf a(f) | f ∈ D1,1, . . . , D1,m}, the files with
the fewest potential future accesses are exchanged and the record of the index manager is then revised. This process is repeated until there is no such pair of files.
After completing this process, D1,m+1 moves to (2,1), and similarly, if the disks overflow the second row, the same process is executed and D2,m+1 moves to (3,1), and so on. Thus, our system periodically replaces the data so as to maintain the state that the potential future access of disks gradually reduces downward in the grid in response to changes in both the total amount of data and the data access pattern.
Apart from the measure to sort data, the main difference between PDC and our method is that PDC completely rear-ranges and sorts data in the whole storage array, while our method merely sorts data in each row independently, which reduces the number of migrations.
Finally, we point out some possible refinements of this architecture for implementation. First, deleting files reduces the effective use of disks. Although in this paper we do not
consider the delete operation, it is necessary to provide a certain packing algorithm so that each disk stores data up to its capacity. We consider that after applying the packing algorithm, if a disk becomes empty, it is removed from Group B and queued in the Empty disk pool for the supply of disks to Group A. Second, our rearrangement is realized in a distributed way, but our system is assumed to have an index manager to provide a lookup service, whose performance is not thoroughly investigated in this paper. To enhance the scalability, it is also worthwhile developing an alternative mechanism in a distributed way.
V. SIMULATIONRESULTS
To understand the effectiveness of our method for storage systems consisting of several thousands of disks, we first evaluated the running time of disks in active mode and the frequency of accesses of disks in standby mode. Note that, in our study, we assume that the power consumption of a disk is proportionally determined by the total running time in active mode. In addition, the reduction of power consumption is realized by the spinning-down of disks, while accesses of spun-down disks need extra time (5–10 seconds) to wait for the spinning-up of the disks. Since the spin-up time of disks is 100 times longer than the access time (e.g., when the file size is 3 MB, the access time is approximately several dozen milliseconds) and the number of accesses for disks in standby mode is increased by reducing the power consumption of disks, we shall see later that there is a trade-off between the power efficiency and responsiveness.
TABLE I
PARAMETERS USED IN SIMULATIONS.
Description Value
Storage capacity 500 GB
Transfer rate (Disk) 100 MB/sec Transfer rate (Network) 100 MB/sec
Spin up time 5 seconds
Idleness threshold 30 seconds Ratio of always-active disks 0%
Number of disks in each row Not fixed (maintain square grid)
A. Parameters and settings
In the evaluation presented in this section, we considered the following system. Group A consisted of some disks whose number was assumed to be enough to deal with the upload, while Group B consisted of up to 2,000 disks, whose number increased depending on the upload. Each disk in Group B required 5 seconds for spin-up in the case that it had been in standby mode. In addition, disks in Group B were allocated in a square grid, where the number of disks in each row and column were adjusted by the steps described in Section IV. We set the parameters as shown in Table I. Here, the “Idleness threshold” means the fixed threshold time such that a disk is transitioned to standby mode after the period since the last access has elapsed (cf. [9]). The “Ratio of always-active disks” means the ratio of the number of disks that are always kept active to the total number of disks in Group B. (Thus, for example, if the value is set as 50%, the upper half of disks in the grid are always active regardless of accesses, while the rest may spin down according to the predetermined idleness-threshold time.)
The workload in the simulations was based on the access traces obtained by the observation of Flickr described in Sec-tion III. To determine the trace of each file in our simulaSec-tion, we chose at random from a set of 45,894 real traces when uploaded. In addition, we set the size of each file as 3 MB according to measurements in our trace and the number of photo uploads as 3,000 per minute according to Flickr reports [3], [4].
In the simulations, we first evaluated the effectiveness of our method by measuring the running time and the number of accesses for disks in standby mode. We next evaluated the impact of three parameters: the idleness threshold (presented in Subsection C), the ratio of always-active disks (in Subsection D), and the number of disks in each row (in Subsection E). B. Effectiveness of our proposed method
Figure 8 shows the change in running time for two con-figurations. Here, the horizontal and vertical axes indicate the elapsed time and the ratio of summation of hourly running time of all disks in active mode to the summation of running time of all disks, respectively. The “Only spin-down” configuration in which the disks spin down after an idle time (30 seconds) without data exchange or disk migration, and the “Proposed method” in which disks spin down after an idle time (30 seconds) with data exchange and disk migration. Note that
0 500 1000 1500 2000 0.75 0.8 0.85 0.9 0.95 1 Time (hour)
Ratio of running time (%)
Proposed method Only spin−down
Fig. 8. Running time in application of data exchange and disk migration.
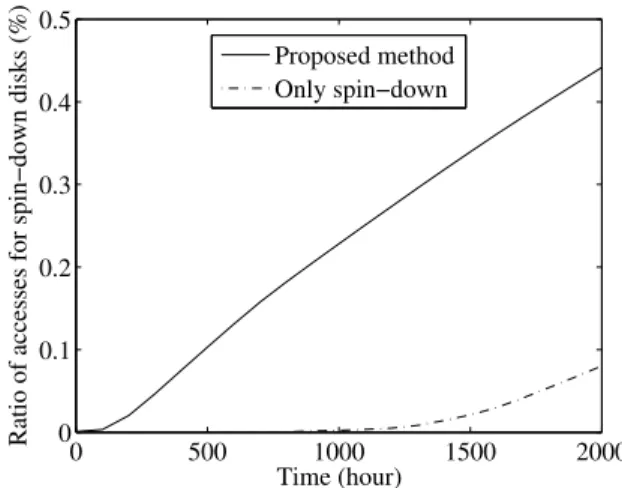
0 500 1000 1500 2000 0 0.1 0.2 0.3 0.4 0.5 Time (hour)
Ratio of accesses for spin−down disks (%)
Proposed method Only spin−down
Fig. 9. Ratio of accesses to spin-down disks in application of data exchange and disk migration.
the figure shows the relative time when the running time in the case that all disks are always active is equal to 1. From the figure, we observed that the power consumption after 2,000 hours was reduced by 24.0% when employing the “Proposed method”. In contrast, when employing the “Only spin-down” configuration, the power consumption was reduced by only 0.9%. The result shows that data exchange and disk migration were effective in reducing power consumption.
Figure 9 shows the change in ratio of the accesses of disks in standby mode. Here, the horizontal and vertical axes indicate the elapsed time and the ratio of the number of accesses to spin down disks to all accesses, respectively. We observed that 0.43% of accesses were of disks in standby mode in the “Proposed method” after 2,000 hours. On the other hand, in the case of the “Only spin-down” configuration, the ratio was 0.08%. This result means that, in the “Proposed method”, 0.43% of accesses need extra time for the spinning-up of disks, which worsens the average response time. According to this result and the latency of accesses for active and standby modes obtained by measuring real disk accesses (presented in the next
0 500 1000 1500 2000 0.75 0.8 0.85 0.9 0.95 1 Time (hour)
Ratio of running time (%)
30 s 60 s 90 s 120 s
Fig. 10. Running time in different configurations of idleness threshold.
section), we can estimate the response time as follows: the average system response time is 69.1 ms, where the average response time of active disks is 47.6 ms and that of disks in standby mode is 5056.5 ms.
By these results, our method is effective in reducing power consumption, as demonstrated by comparing with the “Only spin-down” case (or the case that all the disks are always active), while the responsiveness (whose difference is 0.35%) slightly increased with the reduction of power consumption. C. Impact of the idleness threshold on power consumption and access of disks in standby mode
We next show the impact of idleness threshold on power consumption and access of disks in standby mode. This analysis provides useful information to find a well-balanced parameter setting in the trade-off between the performance in power consumption and responsiveness.
Figure 10 shows the change in running time for different configurations of the idleness threshold: 30, 60, 90 and 120 seconds, while the other parameters are the same as in Table I. Here, the horizontal and vertical axes indicate the elapsed time after upload and the ratio of running time in active mode to the total running time. The figure shows that the power consumption after 2,000 hours was reduced by 9.7%–24.0% in each configuration, among which the configuration of 30 seconds was the most effective.
Figure 11 shows the change in ratio of the accesses of disks in standby mode for different configurations of the idleness threshold, which were the same as those in Figure 10. The figure shows that 0.06%–0.43% of accesses were of disks in standby mode in each configuration, among which the configuration of 120 seconds was the most effective (in contrast to the result for the running time).
The results in Figures 10 and 11 indicate that the idleness threshold balances the running time and accesses of disks in standby mode. Determining the best configuration of the idleness threshold depends on the priorities of different factors, such as power efficiency and responsiveness, which may vary depending on system requirements.
0 500 1000 1500 2000 0 0.1 0.2 0.3 0.4 0.5 Time (hour)
Ratio of accesses for spin−down disks (%)
30 s 60 s 90 s 120 s
Fig. 11. Ratio of accesses of spin-down disks for different configurations of the idleness threshold.
0 500 1000 1500 2000 0.75 0.8 0.85 0.9 0.95 1 Time (hour)
Ratio of running time (%)
0% 10% 20% 30% 40% 50% 60% 70% 80% 90%
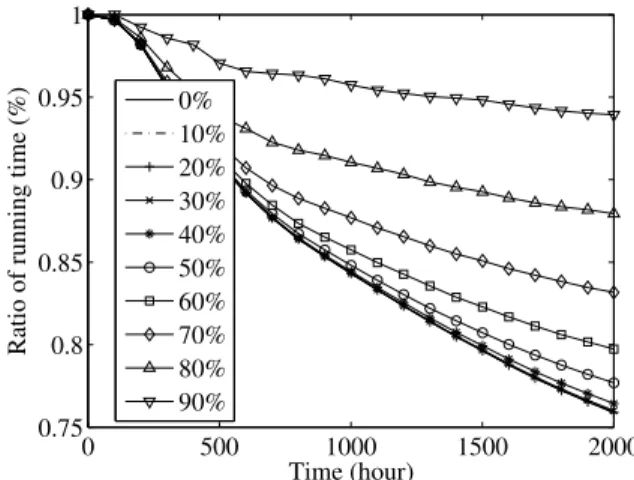
Fig. 12. Running time for different configurations of the ratio of always-active disks.
D. Impact of the ratio of always-active disks on power con-sumption and access of disks in standby mode
Next, we present the impact of the ratio of always-active disks on power consumption and access of disks in standby mode. In Subsection B, we set this parameter as 0%, which means that all disks may transition to standby mode. However, in the case that reducing the number of accesses to disks in standby mode is given priority over power-saving, changing the value of this parameter is an effective means. The purpose of this evaluation is to clarify how this parameter setting affects the performance.
Figure 12 shows the change in running time for different configurations of the ratio of always-active disks from 0% to 90% on 10% basis. Here, the other parameters were the same as in Table I. The figure shows that the running time in active mode was reduced by 6.1%–24.0% in each configuration after 2,000 hours, among which the configuration of 0% was the most effective. The power consumption in this case was similar to that for ratios of 10%, 20% and 30% but 17.9 percentage points less than that in the case of a ratio of 90%, which saw
0 500 1000 1500 2000 0 0.1 0.2 0.3 0.4 0.5 Time (hour)
Ratio of accesses for spin−down disks (%)
0% 10% 20% 30% 40% 50% 60% 70% 80% 90%
Fig. 13. Ratio of accesses of spin-down disks for different configurations of the ratio of always-active disks.
the least reduction.
Figure 13 shows the change in ratio of the accesses of disks in active mode for different configurations of the ratio of always-active disks, which were the same as in Figure 12. The figure shows that 0.03%–0.43% of accesses were of disks in standby mode in each configuration, among which the configuration of 90% was the most effective.
These results indicate that the impacts of the ratio of always-active disks and the idleness threshold are almost the same. For example, in the case that the idleness threshold was 60 seconds, the power consumption was reduced by 16.0%, while 0.18% of all accesses were of disks in standby mode. On the other hand, in the case that the ratio of always-active disks was 70%, the power consumption was reduced by 16.8%, while 0.18% of all accesses were of disks in standby mode. E. Impact of the number of disks in each row on power consumption and access of disks in standby mode
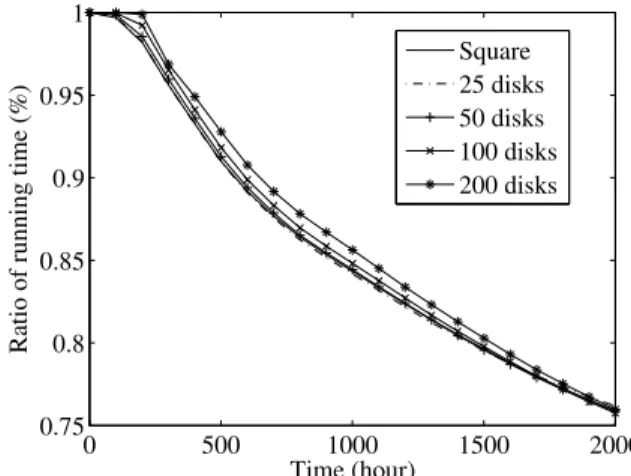
Finally, we present the impact of the prefixed number of disks in each row on power consumption and access of disks in standby mode. In subsection B, Group B is assumed to be formed in a rectangular grid. However, we are also interested in the impact of change in this form. Clearly, the change affects both the frequency of data migration and the number of files moved in each migration.
Figure 14 shows the change in running time for different configurations of the number of disks in each row in the cases of a square grid of 25, 50, 100 and 200 disks. Here, the other parameters were the same as in Table I. The figure shows that the running time in active mode was reduced by 23.8%–24.3% in each configuration, among which the configuration of 100 disks was the most effective, although the figure also shows that the parameter has no (or slight) impact on the running time.
Figure 15 shows the change in ratio of accesses of disks in standby mode for different configurations of the number of disks in each row, which were the same as in Figure 14. The figure shows that 0.41%–0.48% of accesses were of disks in
0 500 1000 1500 2000 0.75 0.8 0.85 0.9 0.95 1 Time (hour)
Ratio of running time (%)
Square 25 disks 50 disks 100 disks 200 disks
Fig. 14. Running time for different configurations of number of disks in each row 0 500 1000 1500 2000 0 0.1 0.2 0.3 0.4 0.5 Time (hour)
Ratio of accesses for spin−down disks (%)
Square 25 disks 50 disks 100 disks 200 disks
Fig. 15. Ratio of accesses of spin-down disks for different configurations of the number of disks in each row.
standby mode, and the configuration of 25 disks was the most effective.
From these results, we observed that the parameter was not very effective either in reducing power consumption or avoiding accesses of disks in standby mode. However, in an environment where the access frequency varies more dynam-ically, it would be necessary to find a suitable value of this parameter to avoid overloading caused by data migration.
In closing this section, we compare the simulation results of this study with the results of our previous study. Our method saved 24.0% of running time in active mode when the idleness threshold was set as 30 seconds after a lapse of 2,000 hours, while our previous study saved 37.4% with the same parameter setting. Thus, although the performance in power consumption becomes worse, our method still ef-fectively skews the workload and saves power. On the other hand, with the same parameter setting, accesses to disks in standby mode comprised only 0.43% of all accesses, which is an improvement of less than 3% on the result of the previous work.
0 20 40 60 80 100 120 40 50 60 70 80 90 100 110 120 Time (minute) Response time (ms) Average Maximum Start data exchange
Fig. 16. Response time in the first row after 200 hours
VI. EXPERIMENTS ONIMPLEMENTATION
We conducted an experiment on the current prototype imple-mentation of our proposed system to evaluate the applicability of our method to a real system. We measured the response time in an environment where the system workload was the same as that in the simulation.
Our prototype consisted of 10 PC servers, each of which was equipped with a Dual Xeon 3.60 GHz CPU, 2 GB memory, and a single 36 GB SCSI disk. For our prototype, owing to the limitation of our experimental environment (i.e., the bandwidths of different servers), we evaluated the response time of data access by measuring the time from sending a request until the data were loaded into the memory of the server. In addition, no underlying lookup service to access data was implemented in our prototype. Thus, in the experiments, the data were accessed by their storing server.
A. Parameters and settings
In our experimental environment, although the real capacity of a disk was 36 GB, we assumed that the capacity was 500 GB, which was emulated by only accessing one file (i.e., in the experiments, response time for each access was evaluated by accessing the same file). In addition, because it was difficult to spin up or spin down disks in the current system configuration (each server consisted of a single disk, on which was installed the operating system), we realized these actions by letting the server wait before accessing the disk. The two parameters were up time of 5 seconds and idle time before spin-down of 30 seconds. (According to the simulation analysis, this configuration was the best in terms of response time and power consumption.)
Here, to observe the effect of data exchange on the response time of data access in greater detail, we measured the response time for some of the disks in the first and last rows in Group B (i.e., the 10 disks with the highest and lowest access frequencies) after 200 hours (presented in Subsection B) and 1,000 hours (presented in Subsection C).
0 20 40 60 80 100 120 40 50 60 70 80 90 100 Time (minute) Response time (ms) Average Maximum Start data exchange
Fig. 17. Response time in the last row after 200 hours
0 20 40 60 80 100 120 40 50 60 70 80 90 100 110 120 Time (minute) Response time (ms) Average Maximum Start data exchange
Fig. 18. Response time in the first row after 1,000 hours
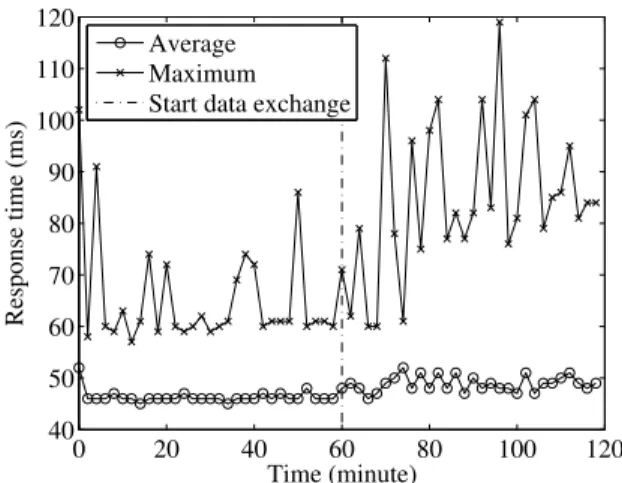
B. Response time in the first and last rows after 200 hours Figure 16 shows the changes in average and maximum response times of 10 disks in the first row (i.e., disks with the highest access frequencies) after 200 hours, where the rightmost disk in the row started data exchange with other disks at 60 minutes (indicated by the vertical dash-dot line). The figure shows that the average response times were 46.3 ms for 0–60 minutes, 48.9 ms for 61–120 minutes, and 47.6 ms for 0–120 minutes. Note that, in this measurement, we could not observe accesses of disks in standby mode because these accesses require more than 5 seconds for disk spin-ups.
Figure 17 shows the changes in average and maximum response times of 10 disks in the last row (i.e., disks with the lowest access frequencies) after 200 hours, where the setting was the same as in Figure 16. The figure shows that the average response times were 46.6 ms for 0–60 minutes, 48.8 ms for 61–120 minutes, and 47.7 ms for 0–120 minutes. C. Response time in the first and last rows after 1,000 hours
Figure 18 shows the changes in average and maximum response times of 10 disks in the first row after 1,000 hours.
0 20 40 60 80 100 120 0 1000 2000 3000 4000 5000 6000 Time (minute) Response time (ms) Average Maximum Start data exchange
Fig. 19. Response time in the last row after 1,000 hours
The result was almost the same as that in the previous subsection.
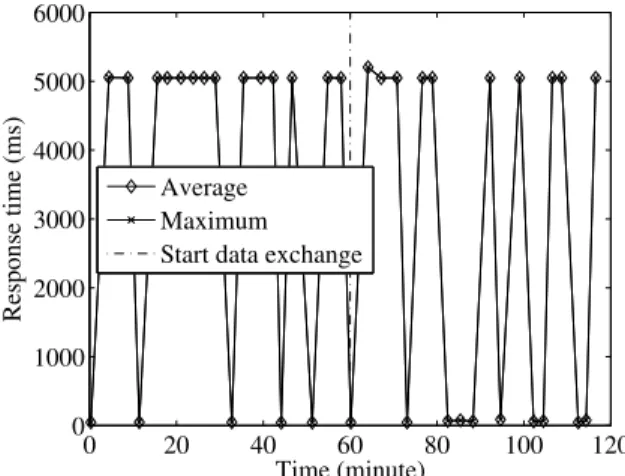
Figure 19 shows the changes in average and maximum re-sponse times of 10 disks in the last row after 1,000 hours. From this figure, we observe that some accesses took over 5,000 ms because of the spinning-up of disks. The result indicates that, in this row or neighborhood, there are frequent accesses of disks in standby mode although previous simulation results show that these accesses are few (less than 1%) on the whole. This section shows that although in our method there remain some accesses to disks in standby mode, the overall average response time suggests applicability to the real environment.
VII. CONCLUSIONS ANDFUTUREWORK
We presented a power-saving method for large-scale dis-tributed storage systems whose prime target is Internet hosting service platforms. Our storage system is based on PDC, but it is adapted to a constant massive influx of data and changes in data popularity. To improve our previous work [8], and especially to reduce the accesses of disks in standby mode, our method periodically rearranges data in the order of potential future accesses presumed to be associated with the elapsed time after upload and accesses in the past, instead of simply sorting by the latest number of accesses. This data access prediction technique is based on statistical analysis of real traces of more than 45,000 public photos on Flickr for around 6 months.
We evaluated the performance of our system both in simula-tions and prototype implementation using real traces obtained from Flickr. We observed that our method saved 24.0% of the total running time in active mode, while the overall average response time was 47.6 ms, where 0.43% of total accesses were of disks in standby mode. These results indicate that our method reduced the accesses of disks in standby mode to less than one-tenth when compared with previous work without degrading the latency and the effectiveness of power consumption. In this study, we used only a dataset obtained from Flickr, but we believe that our technique is widely
applicable to today’s datacenter-scale systems.
In future work, one of the most interesting and worthwhile directions of investigation will be to develop a fully distributed mechanism for power-aware datacenter-scale storage systems based on this study. A possible approach is to integrate a technique of a distributed hash table, such as Chord [11], into our system. This would allow our system to be highly scalable. Aside from this, we are also interested in refining the evaluation. In particular, we consider that the evaluation of real power consumption is important, in place of simply measuring the duration of the idle/standby mode of the disks.
REFERENCES
[1] T. Bostoen, S. Mullender, and Y. Berbers. Power-Reduction Techniques for Data-Center Storage Systems.ACM Computing Surveys, vol.45(3), 38 pages, 2013 (to appear).
[2] D. Colarelli and D. Grunwald. Massive arrays of idle disks for storage archives.ACM/IEEE Conference on Supercomputing, pp.1-11, 2002. [3] Flickr’s blog page on September 19, 2010.
(http://blog.flickr.net/en/2010/09/19/5000000000/) [4] Flickr’s blog page on August 4, 2011.
(http://blog.flickr.net/en/2011/08/04/6000000000/)
[5] D. Harnik, D. Naor, and I. Segall. Low power mode in cloud storage systems.Parallel and Distributed Processing Symposium, International, pp.1-8, 2009.
[6] K. Hasebe, T. Niwa, A. Sugiki, and K. Kato. Power-Saving in Large-Scale Storage Systems with Data Migration.IEEE International Conference on Cloud Computing Technology and Science (CloudCom’10), pp.266-273, 2010.
[7] R. T. Kaushik and M. Bhandarkar. GreenHDFS: towards an energy-conserving, storage-efficient, hybrid Hadoop compute cluster. In 2010 international conference on Power aware computing and systems (Hot-Power’10), pp.1-9, 2010.
[8] J. Okoshi, K. Hasebe, and K. Kato. Power-Aware Autonomous Distributed Storage Systems for Internet Hosting Service Platforms. In3rd Interna-tional Conference on Cloud Computing (CloudComp 2012), 10 pages, 2012 (to appear in a volume of Springer LNICST).
[9] E. Pinheiro and R. Bianchini. Energy conservation techniques for disk array-based servers. In International Conference on Supercomputing, pp.68-78, 2004.
[10] E. Pinheiro, R. Bianchini, and C. Dubnicki. Exploiting redundancy to conserve energy in storage systems. In ACM SIGMETRICS Conference on Measurement and modeling of computer systems, pp.15-26, 2006. [11] I. Stoica, R. Morris, D. Karger, M. F. Kaashoek, and H. Balakrishnan.
Chord: A scalable peer-to-peer lookup service for internet applications. InACM SIGCOMM, pp.149-160, 2001.
[12] M. Storer, K. Greenan, E. Miller, and K. Voruganti. Pergamum: Re-placing tape with energy efficient reliable, disk-based archival storage. In USENIX Conference on File and Storage Technologies (FAST’08), pp.1-16, 2008.
[13] USA Today. YouTube serves up 100 million videos a day online, July 16, 2006.
[14] A. Verma, R. Koller, L. Useche, and R. Rangaswami. SRCMap: energy proportional storage using dynamic consolidation. In8th USENIX Con-ference on File and Storage Technologies (FAST’10), pp.154-168, 2010. [15] S. V. Vrbsky, M. Lei, K. Smith, and J. Byrd. Data Replication and Power Consumption in Data Grids. In 2010 IEEE Second International Con-ference on Cloud Computing Technology and Science (CloudCom’10), pp.288-295, 2010.
[16] C. Weddle, M. Oldham, J. Qian, A. Wang, P. Reiher, and G. Kuenning. PARAID: A gear-shifting power-aware RAID. InUSENIX Conference on File and Storage Technologies (FAST’07), pp.245-260, 2007.
[17] X. Yao and J. Wang. RIMAC: a novel redundancy-based hierarchical cache architecture for energy efficient, high performance storage systems. InACM SIGOPS/EuroSys European Conference on Computer Systems, pp.249-262, 2006.
[18] Q. Zhu, Z. Chen, L. Tan, Y. Zhou, K. Keeton, and J. Wilkes. Hibernator: helping disk arrays sleep through the winter. In ACM symposium on Operating systems principles, pp.177-190, 2005.