Cracking the code:
how schools can improve
social mobility
October 2014
Social Mobility and Child Poverty Commission Sanctuary Buildings
20 Great Smith Street London
SW1P 3BT
About the Commission
The Social Mobility and Child Poverty Commission is an advisory non-departmental public body established under the Child Poverty Act 2010 (as amended by the Welfare Reform Act 2012) with a remit to monitor the progress of the Government and others on child poverty and social mobility. It is made up of 10 commissioners and is supported by a small secretariat.
The Commission board comprises: The Rt. Hon. Alan Milburn (Chair).
The Rt. Hon. Baroness Gillian Shephard (Deputy Chair).
Tom Attwood, currently a Non Executive Director at the Centre for Social Justice and formerly Managing Director of the Intermediate Capital Group.
Anne Marie Carrie, Chief Executive of Kensington and Chelsea Education Ltd.
Paul Cleal, Government and Public Sector Leader at Price Waterhouse Coopers. Paul Gregg, Professor of Economic and Social Policy, University of Bath.
Christian Guy, Director of the Centre for Social Justice.
Douglas Hamilton, Director of the RS Macdonald Charitable Trust. David Johnston, Chief Executive of the Social Mobility Foundation. Catriona Williams OBE, Chief Executive of Children in Wales. The functions of the Commission include:
Monitoring progress on tackling child poverty and improving social mobility, including implementation of the UK’s child poverty strategy and the 2020 child poverty targets, and describing implementation of the Scottish and Welsh strategies.
Providing published advice to ministers on matters relating to social mobility and child poverty.
Contents
Executive Summary ... i
Introduction: Social mobility and education ... 1
Part one: Variation in the exam results of disadvantaged children ... 5
Part two: Accountability, teaching quality and expectations ... 19
Part three: What great schools are doing to improve the attainment and
opportunities of disadvantaged children ... 26
i
In the UK, demography too often shapes destiny. Being born poor too often leads to a lifetime of poverty. Both advantage and disadvantage cascade down the
generations. Social mobility in Britain is low and is stalling.
Nowhere has this been more apparent than in education. Gaps in cognitive
development between better-off and disadvantaged children open up early on, with those from the poorest fifth of families on average more than eleven months behind children from middle income families in vocabulary tests when they start school. Over the years that follow, these gaps widen rather than narrow. The overall result is that nearly six out of ten disadvantaged children1 in England do not achieve a basic set of qualifications2 compared to only one in three children from more advantaged backgrounds. The story is broadly similar in Scotland and Wales. The consequence for these children is a lifelong struggle to gain basic skills, avoid unemployment and to find and hold down a good job.
Though qualifications are the most important dimension of educational disadvantage, the challenge goes beyond exams. The chances of doing well in a job are not
determined solely by academic success – the possession of character skills like persistence and ‘grit’ also matter. So too do wider opportunities including work
experience, extra-curricular activities and careers advice. But, from the earliest ages, social background strongly influences who has these other predictors of later
success, meaning that the better-off are multiply advantaged when it comes to winning the race for good jobs.
These inequalities matter – and not just to the individual children whose futures are scarred by low attainment and poor skills. They exact a high economic price for the country in lost growth as well as in wasted talent.
There is nothing pre-ordained to make the UK a low social mobility society where children’s starting point in life determines where they end up. International evidence has long suggested that the link between social background and outcomes is
stronger in the UK than in many other countries. Now there is growing evidence from the English schools system that deprivation need not be destiny. There is an
emerging wealth of data, stories and individual experiences demonstrating that some schools are bucking the trend, enabling their disadvantaged students to far exceed what would have been predicted for them based on experience nationally.
For example, in the last decade or so London schools have leapt ahead of schools elsewhere in the country when it comes to raising the attainment levels of their
poorest pupils. But in every part of the country there are schools where children from
1 Unless otherwise stated we have used “disadvantaged” to refer to pupils who have been eligible for
free school meals in the last six years. Data derive from Commission analysis of the 2012-2013 National Pupil Database, removing selective, independent, special schools and schools where there are fewer than six Ever6FSM or fewer than ten total pupils within a school. Schools were also removed where no data was available on the proportion of pupils achieving five good GCSEs including English and maths.
2
ii
disadvantaged backgrounds outperform the national average for all children. In fact this is the case in around one in nine secondary schools and in many primaries.3 Some schools seem to have learnt the secret of how to alleviate the impact of background on life chances. They have found a way of overcoming the barriers that impede social mobility. At a time when social mobility is stalling and child poverty is rising, there is an urgent need to share the lessons so that every school can crack that code.
Of course schools cannot do it alone. As the UK’s official monitor of these issues, the Social Mobility and Child Poverty Commission has consistently argued that improved social mobility is not in the gift of any one part of society. Instead it needs a collective effort from government, parents, employers and educators among others. It would not be reasonable to expect schools to be able to wholly
compensate for failures on the part of the other players on the pitch. Equally, schools have a key role to play and can make a difference. In this report we examine what they are currently doing and what they could be doing. The focus here is different from our previous work on schools, which has mainly examined the impact of central government education policy on social mobility. In this report, we focus on a much less scrutinised question: given the policy context, what can schools themselves do to address social mobility?
This report is one of a series of reports we are publishing that seeks to define what different parts of society can do to improve social mobility (previously we have looked at the role of universities and of employers). It is informed by a literature review, new analysis, consultation with experts, a large survey of teachers, two focus groups with high achieving disadvantaged young people and a programme of visits to some of England’s schools that are achieving great outcomes for disadvantaged students.
Although our data analysis exploring schools’ potential to make a difference is largely based on GCSE results, the steps towards social mobility that we set out in this report are aimed at both primary and secondary schools. Both have a key role to play in unlocking more social mobility.
The report:
Sets out the case that schools can make a difference, presenting evidence which is beginning to challenge the decades-old assumption that wealthier children will naturally excel while poorer children lag behind.
Quantifies the scale of the gap between those schools that seem to have learned how to weaken the link between background and attainment and the rest.
Sheds new light on the barriers to schools adopting these steps, including new polling results on teacher attitudes and incentives to teach in the most
challenging schools.
Proposes five key steps that all schools can take to close the gap in attainment and in life chances and boost social mobility.
3
The figure for primaries is one in three. However, some of this outperformance will be explained by random variation given small cohort sizes and the higher proportions of disadvantaged children reaching the expected level at the end of primary compared to at GCSE
iii
KEY FINDING: The wide variation in results between
schools with similar intakes shows that there is a lot of
scope to raise performance
Previous research has found that differences in school quality can explain on average around a fifth of the variation in children’s educational attainment: most of the attainment gap is ultimately determined by differences in the home environment, including family background and parenting. But new analysis of variations in
outcomes for students in schools with similar intakes suggests that schools can make a big difference if more step up to the standards of the best.
London’s schools stand out, with children from disadvantaged backgrounds 38 per cent more likely to get five A*-C grades at GCSE including English and maths than those elsewhere and three times more likely to get eight A-B grades at GCSE than those in other regions. But it is not only in London that schools are achieving good results for disadvantaged children. Our new analysis shows that, in every part of the country, there are schools where a higher proportion of disadvantaged children get good results than the national average for all children. Nearly 60 per cent of such secondary schools are outside the capital.
The reasons why some schools get better results than others are complex. For example, it is pretty obvious that the challenges facing schools with 80 per cent of students officially classified as disadvantaged are very different from those facing a school with just 10 per cent. Nonetheless, there is growing evidence that similar
schools (in terms of how disadvantaged the children who attend them are) perform very differently. Our analysis shows that:
The best performers are helping three times as many disadvantaged children to achieve five good GCSEs including English and maths as schools with similar levels of disadvantage. In the best performing schools,4 60 per cent of
disadvantaged children achieve five good GCSEs including English and maths compared to only 25 per cent in the lowest performing.5
If schools closed half the gap in performance to the top 20 per cent of schools with similar concentrations of disadvantage, over 14,000 more disadvantaged students would get 5 good GCSEs each year. To put that in perspective, in 2012-3, around 61,000 disadvantaged children got five good GCSEs, so this would mean that almost 25 per cent more disadvantaged children would be achieving at this level if the gap was closed.
Of course, schools which look comparable on how disadvantaged their intakes are may be different in other ways. The single biggest factor predicting results at age 16 is the prior attainment of students whilst at primary school so our analysis also looked at variations in outcomes between schools for all students at 16 (not just those who are disadvantaged) compared to the highest performing similar school (defined by attainment at age 11 of pupils entering the school). This analysis shows
4
The top 20 per cent of performers compared to schools with a similar level of disadvantage
5
iv
that there is wide variation in the proportions of students getting five good GCSEs between schools where pupils have similar levels of prior attainment. Low attainment as a young person is a key risk factor for poverty as an adult, so this tells us
something important about schools’ effectiveness in preventing children from having low living standards as adults.
If all secondary schools did as well as the best performing school with a similar intake (based on attainment at age 11 of pupils entering the school), the number of pupils achieving five good GCSEs including English and maths would be 37 percent higher.
This average disguises big variations, with the gap in performance being especially big in local authority areas like Knowsley, Blackpool, Barnsley, Middlesbrough and Torbay. In Knowsley, for example, 80 per cent of GCSE students would have attained five good GCSEs in 2012-13 including English and maths if every local school did as well as the highest performing school in
England which had an intake with similar prior attainment at age 11 compared to the actual figure of 44 per cent, meaning 82 per cent more children would have achieved at this level.
If every school in England went just half way to the achievements of the highest performing English school with a similar intake (based on prior attainment), 60,000 more children would have gained five good GCSEs including English and maths in 2012-3. To put that in perspective, in 2012-3 around 320,000 children got 5 good GCSEs, so this would mean 19 per cent more children achieving at this level than at present.
KEY FINDING: Some schools will need to shift their focus
towards core academic subjects and raising attainment
across the whole ability range to avoid falling in national
league tables and - most importantly - to improve social
mobility for their pupils
From 2016 the Government is introducing a new way of measuring school
performance to address deficiencies in the current accountability system which will affect children who are starting their GCSE courses in autumn 2014. The intention is to remove incentives for secondary schools to “game” performance league tables by overly focussing on pupils at the C/D borderline or by encouraging children to take “equivalent” qualifications that have not always carried the same value as GCSEs when it comes to continuing in education or getting a job. The new framework for secondary schools will introduce two new measures of performance based on the progress (“Progress 8”) and absolute attainment (“Attainment 8”) of students across a set of eight subjects, with a tougher test of which subjects and qualifications count towards the measure.
What has not been clear until now is the extent to which measured performance of schools will change in this new system. In order to better understand this, we have taken schools’ national rankings based on their performance against the current headline accountability measure (five good GCSEs or equivalent qualifications, including English and maths), and compared it to how they would have done under
v
the absolute attainment measure in the new system (“Attainment 8”), using GCSE results from 2012-13.
Our analysis shows that most schools do not change position dramatically. However, a significant minority of schools do far worse in the new accountability framework. In particular, eight per cent of secondary schools see their performance ranking fall three deciles or more on the new framework, including a fifth of schools in the North East, one in eight schools in the West Midlands and more than a quarter of schools in Sandwell, Croydon, Halton and Tower Hamlets.
On average the schools experiencing the greatest falls are those with the greatest proportion of disadvantaged children. For example, 40 per cent of pupils within schools which fall by at least three deciles are disadvantaged compared to just 20 per cent of pupils within schools whose measured performance increases by at least three deciles.6 Furthermore, 112 schools which fall by at least three deciles taught pupils living in the most deprived areas7 (29 in London, 28 in the West Midlands and 17 in the North East) - this compared to just 33 schools which saw an increase of at least three deciles (19 in London, four in the West Midlands and three in the East Midlands).
This analysis presents a profound challenge to such schools and requires urgent remedial action. The fact that these schools’ relative performance falls sharply on a system that places double weighting on the value of English and maths attainment levels may highlight weaknesses in their current performance – with children either taking too few subjects, not having access to an academic curriculum, performing far better around the C/D grade boundary than elsewhere in the ability distribution, or simply performing a lot worse in core academic subjects than children in other schools.
Teachers in the schools that the Commission visited to inform this report were passionately committed to social mobility, arguing that they aimed high for their students because it is the ‘right thing to do’. The new accountability system has the potential to add a hard ‘business case’ edge to these moral arguments for doing more on social mobility.
Now is the right time for schools, governors and teachers to rethink their approaches and assess whether their practices and culture are really driving the best results for all students, because doing so will help schools perform well under the new
accountability system. The new system also makes the case for schools to rethink how they focus resources on students – because it removes the focus on the C/D threshold, improvements in attainment will be reflected in measured performance no matter where in the attainment distribution improvements happen. Improvement strategies based on intensively focusing on those just around the C/D borderline which would be effective under the current system will no longer be sufficient under the new accountability system.
6
Caution should be given when interpreting these statistics as the number of schools within these extreme deciles is small.
7 We have defined “high deprivation” as “an IDACI ranking of less than or equal to 30”
vi
KEY FINDING: Some teachers’ expectations of students
from disadvantaged backgrounds are too low and getting
the best teachers to teach in the worst schools requires
stronger incentives, including higher pay
There is a strong relationship between quality of teaching and the attainment levels achieved by students. Expectations also matter. But children in schools in
disadvantaged areas and the most disadvantaged children within each school are least likely to benefit from the best teaching and there has also been debate about the extent to which teacher expectations about pupil potential are influenced by children’s social backgrounds.
A new survey of teachers commissioned for this report helps to shed light on this question. We asked more than a thousand teachers a range of questions, including about what influenced their expectations for the children they teach. We found that teachers generally have high expectations of students from disadvantaged
backgrounds and believe that, as teachers, they have a crucial role in shaping their students’ hopes and aspirations for the future. However, we also found evidence that some teachers’ attitudes towards disadvantaged students could act as a barrier to success. While it is clear that most teachers did not think social background had any influence on expectations at their school, over one in five (21 per cent) overall – and one in four (25 per cent) in secondary schools - agreed that some of their colleagues had lower expectations of students from disadvantaged backgrounds relative to those of other students.
In the best performing schools, there is a culture of teachers expecting the best from every child, regardless of their background. Expectations of success help to breed success. Our polling suggests some schools and some teachers are some way from adopting such a culture. It sends a very clear message to heads and governing bodies: making progress on social mobility means ensuring that every teacher displays a high expectation attitude towards all their pupils.
Our polling also revealed another concerning issue: limited appetite among teachers to seek out roles in the most challenging schools. As we have previously argued, one of the key steps in unlocking social mobility is ensuring that good teachers are deployed in weaker schools and disadvantaged areas. But just 15 per cent of
teachers in our poll agreed that they would actively seek out a future role at a school that was more challenging than the one they already taught at, either because it had poorer results or a more diverse or disadvantaged intake.
More than half (53 per cent) of respondents agreed that the pressure of working in a weaker school would be a significant deterrent, unless there were mitigating factors like salary, position and travelling time. Strikingly, when asked to pick from a list of factors that might make them more interested in securing a role in a weaker school, a majority of respondents (63 per cent) identified a salary increase - compared to 39 per cent who focussed on specific development or training and 38 per cent who opted for clear opportunities for career progression.
vii
These findings are a wake-up call to government, local authorities, headteachers and governors: if they want to get more good teachers into more challenging schools then they will need to pay them more and find other ways to incentivise them.
KEY FINDING: Schools should do more to learn from the
‘code breakers’, following five key steps to improve
students’ life chances
Our engagement with schools suggests that those performing well for disadvantaged students do not apply a single magic formula. Success is incremental and based on a series of small changes rather than a single ‘big bang’ – compared by one
headteacher to ‘being like the success of British cycling team: the aggregation of marginal gains’. What the schools that we visited did reflect, however, is a common mindset – one in which leaders use evidence carefully, look beyond their local context, seek to compare themselves to the best and be ambitious in how they define success. This report sets out five key strategies that the schools that we visited told us that they deploy to enable children from less advantaged backgrounds to fulfil their potential. The key steps that the schools commonly identified include:
1. Using the Pupil Premium strategically to improve social mobility – this
means primary and secondary schools using the dedicated funding they receive through the Pupil Premium to narrow attainment gaps between children from disadvantaged backgrounds and others. The most effective schools inform their use of their Pupil Premium funding with data-driven analysis of why, how and where poor children are falling behind. They then seek to deploy that funding to address those barriers, using the school’s freedom to innovate and informed by the evidence on what works, including from sources like the Education
Endowment Foundation toolkit.8 They also carefully examine the potential impact of income poverty on students’ learning – considering and taking steps to
alleviate the impact of hunger, lack of a place to do homework and the financial cost of wider engagement in school life (e.g. affordability of school trips, access to study materials, IT availability, transport costs and so on).
2. Building a high expectations, inclusive culture – this means being ambitious
and “sharp-elbowed” for all children, with the school leadership team and governors sending a clear message from the top that they have high
expectations of all staff and all students. It includes implementation of a firm and consistent behaviour policy and a ‘whatever it takes’ attitude to improving
standards and results among all students: not tolerating lower standards because of a mindset that disadvantaged children cannot do any better.
3. Incessant focus on the quality of teaching – this means placing the provision
of highly effective teaching, perhaps the single most important way schools can influence social mobility, at the centre of the school’s approach. It includes prioritising recruitment and development of staff, partnering with other schools to help teachers develop, and ensuring disadvantaged students have at least their
8
viii
fair share of the best teachers’ time – not just (as in some secondary schools) focusing the best teachers on the C/D borderline, or on top sets where
disadvantaged students tend to be under-represented.
4. Tailored strategies to engage parents –this meanshaving high expectations
of parents and building engagement (and – where necessary – the confidence of parents in dealing with teachers) by, for example, considering meeting parents on neutral ground outside of the school, finding creative ways of getting those who did not have a good experience at school themselves to engage and helping parents to be effective in supporting their children’s learning – not passively accepting lack of involvement.
5. Preparing students for all aspects of life not just for exams – this means
supporting children’s social and emotional development and the character skills that underpin learning. It also means working with students to identify career goals early and providing excellent careers advice, treating extracurricular
activities as key to the school experience and – particularly in secondary schools - encouraging a strong focus on working with business and universities, not - as in some schools - treating these things as optional extras.
There is one final strategy that some schools mentioned that need to be considered if prospects for a level playing field of educational opportunity are to be realised.
Walking the walk on fair admissions - not, as in some schools, covertly enabling
disadvantaged students to be selected out. This means governors and heads
recognising that securing a socially diverse student body can enhance the education experience of all students. It includes complying with the law in avoiding
discriminatory decisions and, for Academies and free schools, using their freedom to give priority to children who receive the Pupil Premium in oversubscription criteria. The Government is currently consulting on extending this freedom to other schools, which should follow suit in due course.
1
Introduction: Social mobility and education
1. It is in Britain’s DNA that everyone should have a fair chance in life. But in too much of the country, where children start out determines where they end up as adults. Gaps in cognitive development between better off and
disadvantaged children open up before the age of three and get wider as children progress through school. Those from the poorest fifth of families are on average more than eleven months behind children from middle income families in vocabulary tests when they start school at five.9 Disadvantaged children are 20 per cent less likely to achieve Level Four in reading writing and maths in Key Stage Two tests at age 11 compared to other children and 37 per cent less likely to achieve five good GCSEs including English and maths.
2. Overall, six out of ten disadvantaged young people do not gain five good GCSEs including English and Maths at 16, compared to only a third of other children. The origins of this lie in the early years and primary schools – for example, fewer than one in six children from low-income families not
achieving the expected level by the age of seven currently go on to get five good GCSEs or equivalent10: literacy and numeracy are critical. Mastering basic skills and achieving good GCSEs both matter profoundly to how well children do in the labour market as adults.
3. More than nine out of ten students who achieve five good GCSEs including English and maths move onto full time education, compared to only half of those who do not.11 Young people who end up not in employment, education or training (NEET) are also predominantly those who did not do well at
school– eight out of ten 16-24 year olds who are NEET left school without five good GCSEs. Differences in attainment are the key explanation for why pupils from the lowest social groups are three times less likely to enter university than those from the highest social groups.12
4. Of course, it is not just basic skills and exam results that shape life chances. A range of other things affect an individual’s chances of getting a good job or being unemployed – whether competing for entry level employment, an apprenticeship or a highly competitive graduate job. There is evidence that non-cognitive or character skills are associated both with academic
achievement and with getting a degree and a good job with decent earnings - but they exhibit a marked ‘social gradient’.13
There are also marked socio-economic differences in the ability of young people to access wider opportunities that can help secure good jobs – in the networks and family contacts that can be used to gain valuable work experience, in access to extra-curricular activities and cultural opportunities that help develop a
9
Washbrook, E., and Waldfogel, J., Cognitive gaps in the early years, February 2010
10
Save the Children, Too Young to Fail: Giving All Children a Fair Start in Life, 2013
11
Meschi, E, Crawford, C and Vignoles, A, Post 16 Educational Choices and Institutional Value
Added at Key Stage 5, 2010
12
Acevo, Youth Unemployment: The Crisis We Cannot Afford, 2012
13
Carneiro, E, Crawford, C and Goodman, A, The Impact of Early Cognitive and Non-Cognitive Skills
2
rounded set of skills, and in the knowledge of the system, information and advice young people need to make good choices at key transition points in their lives. The consequence for many disadvantaged young people is a triple disadvantage in the labour market: worse qualifications; less developed ‘character’ skills; and fewer of the other things that help people get ahead. 5. This is, of course, a story of averages. Not every child from a disadvantaged
background faces all of these problems and many who do are able to overcome them and succeed regardless. Overall, however, the inequalities reflected in educational outcomes and in wider knowledge, opportunities and skills really matter. The cost of this for individuals is wasted potential and lower financial security as low qualifications make it harder to find a decent job. There is evidence that these labour market penalties for low attainment are growing. In the past, children who did not do well at school could look to industrial skilled manual jobs that paid a decent wage. But changes in the economy and the labour market have squeezed the well-paid jobs ‘in the middle’ which previously offered real opportunities to those leaving school with few qualifications to gain solid employment with realistic prospects for
progression.14 The consequences of not doing well at school today are often that people are trapped in low pay or cycling in-and-out of employment and struggling to make ends meet. The cost for the taxpayer, business and society is also significant: lost growth, wasted talent, lower demand, lower tax
revenues, and higher costs for the state in social security and public services. For example, the bill for in-work tax credits, which help bridge the gap
between low earnings and the income families need to meet the cost of living, was £21 billion in 2013.15
6. In our State of the Nation 2013 report, we argued that making progress on social mobility needed everyone to play their part.16 Families have a critical role in providing warm, authoritative parenting and a language-rich
environment. Local authorities have a role in supporting parents to parent, and providing the high quality childcare necessary to close gaps in children’s development and to enable parents to work. Employers need to engage with schools, provide work experience, apprenticeships, and recruit fairly.
Universities need to commit to fair access and help schools and potential students get the results necessary to gain access. And Government needs to ensure those delivering public services have the information, incentives and tools to level the playing field, as well as taking wider action to address income and wealth inequalities.
7. We also identified a big role for schools and the school system. We called on schools to prioritise narrowing the attainment gap alongside raising
attainment, to consider carefully how they use resources across the school (ensuring that it is not just the most advantaged students in top sets or those on the C/D borderline benefiting from the highest quality teaching) and to build the wider skills in their students that enable them to fulfil their potential in
14
Clifton, C., Thompson, S., and Thorley, C., Winning the Global Race: Jobs, Skills and the
Importance of Vocational Education, 2014
15
See https://www.gov.uk/government/collections/personal-tax-credits-statistics
16
3
higher education or the workplace.
8. This report considers the steps that schools can take to improve their
students’ life chances, given the current national policy framework. It is split into three parts:
The first part considers variations in the attainment of disadvantaged children between different schools and different geographical areas in order to understand and quantify what scope there is for improvement if low performers could replicate the results seen elsewhere.
The second part considers some of the most important barriers to schools doing more to tackle social mobility – teaching quality, accountability and incentives.
The third part describes some of the steps that highly effective schools for disadvantaged children have taken that can potentially be adopted
elsewhere. It is based on as series of visits to schools - including schools that achieve excellent results for disadvantaged children.17 Figure 1 sets out what we mean by social mobility and the case for schools to focus on this issue.
9. The Commission believes that progress on social mobility depends on every part of society taking responsibility. We want to help end the blame game in social mobility where - confronted by the overwhelming evidence that
disadvantaged groups do not have fair access to top jobs and the income and power they bring - businesses blame Universities who blame schools who blame parents; with everyone blaming government.
17
We visited schools including Greenwood Academy, Castle Vale, Birmingham; RSA Arrow Vale Academy, Redditch; King Solomon Academy, Westminster; Pakeman Primary School, Islington; Castle View Primary, Runcorn; Burlington Danes Academy, Hammersmith and Fulham, Wade Deacon High School, Widnes and Havelock Academy, Grimsby. The views expressed here are the Commission’s synthesis of our visits, informed by a literature review, internal National Pupil Database analysis and other evidence.
4 Figure 1 Why social mobility?
By social mobility in this report, we mean two things. First, children doing well as adults (‘absolute’ social mobility) – that is having a job that raises their income relative to their parents. Second, children having a fair roll of the dice (‘relative social mobility’) – that is, for a given level of talent and effort, being as likely as children from more advantaged backgrounds to get a good job that raises their income.
Ensuring that children fulfil their potential as adults obviously depends on lots of things beyond the school gates – including families and the labour market. Equally it is not schools’ only goal: the education system is seeking to
produce autonomous, free, well-rounded citizens and adults, not just individuals who can make a good living.
But social mobility is nonetheless a central purpose and responsibility of the schools system. It is an economic goal because young people’s skills and qualifications shape employment, taxes, innovation and growth. It is a social justice goal because it is unfair if young people are unable to realise their potential just because of their background; equally, the economic security that comes from a good job is a critical enabler of schools’ other citizenship and wellbeing objectives. It is a responsibility because no other part of the state has the same opportunity, time and tools to change lives for the better.
If a key role for schools is preparing children to get good jobs as adults and helping them to fulfil their potential, it follows that the outcomes schools are seeking also need to be broad – much broader than those covered in
performance tables. In the Commission’s view across primary and secondary school they cover at least four closely interlinked goals:
Building cognitive skills and converting those into literacy, numeracy at primary school, and then qualifications at secondary school.
Building social and emotional skills and character.
Broadening horizons, raising aspirations and sharing cultural capital. Enabling opportunity and providing information and advice to ensure that
young people can fulfil their potential in higher education or the workplace.
5
Part one: Variation in the exam results of
disadvantaged children
10. As the Commission has previously argued, the defining feature of UK educational outcomes is the strong influence of social background. We assessed the landscape in our 2013 State of the Nation report on the key measure for which data is readily available - attainment.18 We found a system that – while improving overall – works badly for many disadvantaged children. 11. Although the exam results of disadvantaged children in England have been
rising sharply in recent years, they remain relatively low compared to other children – with just 42 per cent of disadvantaged students getting five good GCSEs including English and maths, compared to 67 per cent of other children.19
12. The attainment gap between disadvantaged students and the rest remains stubbornly resistant to improvement. While some progress has been made, the gap has been closing far too slowly as better performance for
disadvantaged children has been matched by improvements for other children.
13. Particularly striking is the fact that social background can explain more of the variation in attainment in the UK than in most other countries. Evidence from PISA suggests that in the UK, 14 per cent of the variance in pupil performance is explained by social background, compared with just eight per cent in
Finland and nine per cent in Canada.20
14. Clearly much of this is driven by factors beyond schools’ direct control – most variation in outcomes is explained by the home environment.21 But schools still have a big influence and a good school can make a real difference to a child’s life chances.
15. In England, disadvantaged children are less likely to go to a good or
outstanding school than their better-off peers. Secondary schools in the most advantaged areas are 28 per cent more likely to good or outstanding than those in the most deprived areas (83 per cent of schools in the most advantaged areas versus 65 per cent in deprived areas). Children from disadvantaged backgrounds are also less likely to attend an outstanding school, even where there is one locally.22
16. Equally troubling is that, even where disadvantaged children do go to good schools, their outcomes are – in the main – significantly worse than their
18
Social Mobility and Child Poverty Commission, State of the Nation 2013, 2013
19
These figures are from internal Commission analysis, using 2012-2013 National Pupil Database data
20
OECD, PISA 2009 Results: Executive Summary, 2010
21
Rasbash, J., Leckie, G., Pillinger, R. and Jenkins, J., Children’s Educational Progress: Partitioning
Family, Schools and Areas Effects, Journal of the Royal Statistical Society, 2010
22
6
better off peers.23 There are, in fact, bigger variations in the performance of pupils within schools than there are between schools which is, again, something which afflicts the UK more than elsewhere.
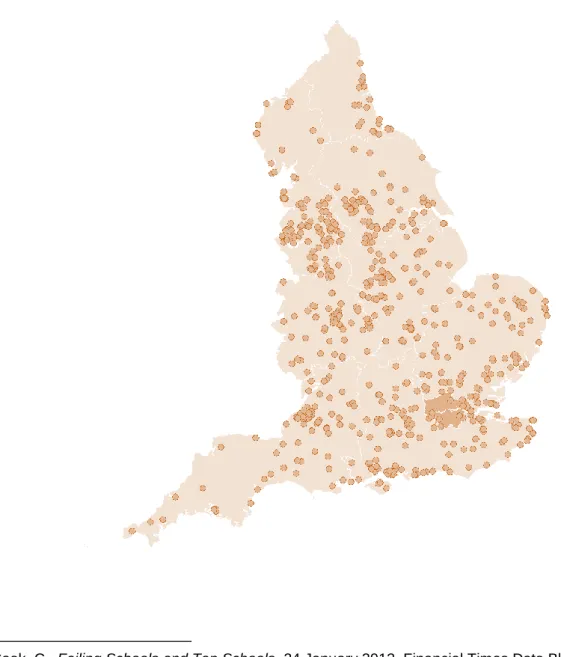
17. Figure 2 shows the location of the lowest performing 20 per cent of secondary schools for disadvantaged students, measured by absolute attainment.24 What is apparent here is that educational disadvantage is widespread. It is found across market towns, Northern cities and depressed coastal areas. What is also striking is the disproportionate number - a fifth of the total of these low schools that perform relatively poorly for disadvantaged students are found in the South East.
Figure 2 Lowest performing 20 per cent of secondary schools for disadvantaged students at GCSE (five good GCSEs including English and maths)
23
Cook, C., Failing Schools and Top Schools, 24 January 2013, Financial Times Data Blog, accessed 12 August 2013 at http://blogs.ft.com/ftdata/2013/01/24/failing-schools-and-top-schools/
24
That is, those with the lowest proportions of FSM students reaching the benchmark of five good GCSEs including English and maths.
7 Region Number of low-performing schools Percentage of low-performing schools South East 110 19.5 East of England 91 16.1 North West 83 14.7 South West 69 12.2 East Midlands 63 11.2 West Midlands 62 11 Yorkshire & Humber 61 10.8 North East 19 3.2 London 7 1.2
18. But amongst this depressing evidence on the impact that social background has on educational outcomes in England is also growing evidence suggesting that deprivation does not need to be destiny. Schools can make a decisive difference.
19. The best evidence for this comes from the experience of London. Just one in a hundred of the bottom fifth of schools for poor children in Figure 2 is found in the capital. Commission-sponsored work has previously looked at evidence on the dramatic changes in educational outcomes for children in the capital.25 In 2002, London was the lowest performing region in the entire country but now performs better than any other for disadvantaged children, with these children 38% more likely to get five good GCSEs including English and maths than children elsewhere. The advantage is even higher at higher grades, with disadvantaged children in London three times more likely to get eight A*-B grades at GCSE than those elsewhere.26 Part of the London effect is likely to be down to demographics – for example, the concentration of children from ethnic minorities. However, research suggests that this explains only about a fifth of the London advantage.27
25
Greaves, E., Macmillan, L. and Sibieta, L., Lessons from London schools for attainment gaps and
social mobility, 2014
26
Social Mobility and Child Poverty Commission, State of the Nation 2013, 2013
27
Greaves, E., Macmillan, L. and Sibieta, L., Lessons from London schools for attainment gaps and
8
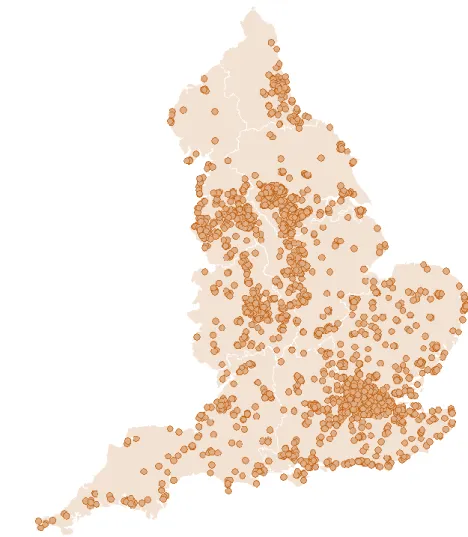
20. The good news is that there are schools who defy the odds for poor children outside of London too. Big cities like Manchester and Birmingham are also showing that deprivation need not be destiny. For example, in Birmingham nearly half of disadvantaged children achieved five good GCSE including English and maths, giving it a similar performance to outer London.28 And further examples of schools which perform well for disadvantaged children can be found across the country. Analysis by the Commission finds that disadvantaged children outperform the national average for all children in one in nine secondary schools and many primaries29 across England. Figure 3 breaks this down by region and shows it in two maps. Crucially, 60 per cent of these secondary schools and 75 per cent of these primary schools are outside the capital.
28
This is based on internal analysis using 2012-2013 NPD data. Independent, selective and special schools have been removed, as have schools with less than 6 Ever6 pupils, less than 11 total pupils have been removed and those with no recorded GCSE data for their pupils have been removed.
29
The figure for primaries is one in three. However, some of this outperformance will be explained by random variation given small cohort sizes and the higher proportions of disadvantaged children reaching the expected level at the end of primary compared to at GCSE
9
Figure 3 Primary and Secondary schools doing well for disadvantaged children
Primary schools where disadvantaged students exceed the national average for all students (Level Four in reading, writing and maths in Key Stage 2 tests)
10
Secondary schools where disadvantaged students exceed the national average for all students (five good GCSEs including English and maths)
Schools getting above the national average for all students for disadvantaged (Ever6 FSM) students
Primary Secondary Region Number of schools Percentage of schools in region Number of schools Percentage of schools in region London 711 48.9 126 32.1 North East 212 38.6 15 10.2 West Midlands 315 30.1 33 9.6 Yorkshire and the Humber 237 23.6 27 9.3 North West 510 35.5 38 9.2 East of England 195 23 26 8.2 South East 267 23.8 24 5.8 East Midlands 183 25.9 14 5.9 South West 196 27.1 9 3.3
11
21. How much scope is there for schools not doing well for disadvantaged children to improve their performance? It is clear that:
Many schools which have good results overall against headline measures perform much worse for disadvantaged students.
Attainment of disadvantaged children is much less consistent across the country than attainment of children from better-off backgrounds.30 There are wide gaps within regions.31
22. What is less clear is how much of these differences in outcomes can be influenced by the school. To help understand this, the Commission has compared differences in exam results for secondary schools with similar intakes.32
23. First, we compared the results for disadvantaged children against the headline ‘five good GCSEs including English and maths” benchmark, for schools with similar proportions of disadvantaged children. This seeks to address the fact that improving the outcomes of disadvantaged students is a very different task in a school in an urban area where the vast majority of their intake is
disadvantaged compared to a school serving a more rural area where there are relatively few disadvantaged students in each year group. Analysing the results in this way enables us to look at how much variation there is between schools which have similar proportions of disadvantaged students.
24. Second, we compared the results of secondary schools for all students (not just disadvantaged students) against the highest performing similar secondary school (defining a group of similar schools based on the prior Key Stage Two performance at age 11 of children in the school). Prior attainment explains much of how well children do in their GCSEs and so comparing the
performance of schools with similar ability intakes give a better indication of differences in how well different schools are doing. The rationale for capturing
30
Whilst the gap on the five A*-C measure including English and Maths at GCSE between London and the lowest performing regions for disadvantaged students is 17 percentage points (54 per cent of disadvantaged students reach this level of attainment in London versus just 37 per cent in the South West, South East, East Midlands and the East of England), the gap for other students is just 8 percentage points (72 per cent of non-disadvantaged students reach the threshold in London compared with 64 per cent in the South West). These figures derive from internal analysis using 2012-2013 NPD data.
31
In the North East, for example, just 29 per cent of disadvantaged children in Northumberland get five good GCSEs including English and Maths, compared to 50 per cent in North Tyneside. In the East of England, just 29 per cent of disadvantaged children in Southend-on-Sea reached the GCSE benchmark in 2012-3, compared with 49 per cent in Luton; and in the South West, 33 per cent of disadvantaged children in South Gloucestershire reached the GCSE benchmark compared with 41 per cent in Bournemouth. These figures derive from internal analysis using 2012-2013 NPD data.
32
The Commission used the performance of secondary schools to explore variations not because we think that secondary school is most important – far from it given clear evidence that early years and primary play a crucial role in establishing inequalities reflected in later outcomes - but because it is a guide to what has gone before, and a key gateway to later opportunities. We focus on exam results rather than other outcomes because they are formally assessed and the data quality is higher. We use the current accountability measures here because it is how schools have been measuring their effectiveness to date. In addition, albeit binary, the five good GCSE including English and maths measure also gives some indication of the students achieving a set of qualifications likely to grant them access to further education
12
a broader group, not just disadvantaged students, is that low attainment is a key risk factor for poverty in adulthood. As the Commission argued in its annual report, a school system that is effective in addressing poverty and social mobility for the long-term would reduce low attainment among those on middle incomes as well as those who are currently poor.33
The absolute attainment of disadvantaged students – comparing schools with similarly disadvantaged students
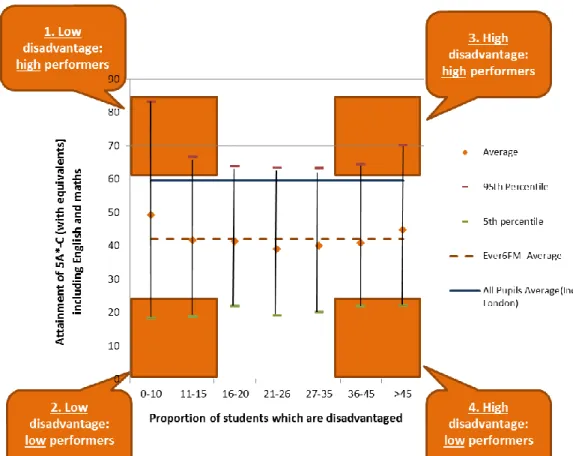
25. Figure 4 shows how schools’ results vary by the concentration of disadvantaged students in the school. It suggests that there are wide variations in outcomes for disadvantaged children between schools serving similarly disadvantaged intakes
26. The first thing to note on the graph is that the orange diamonds that highlight the average performance for schools at each level of disadvantage. They follow a ‘smile’ shape, higher at each end than in the middle. What this shows is that, on average, the schools where disadvantaged children get the best results either have lots or a few disadvantaged children; those where average results are weakest tend to have middling proportions.
27. The second thing to note is that the vertical lines, which mark the variation between the best- and worst-performers for each disadvantage band of
schools. They show significant differences between schools which – based on the profile of their students on this measure – are nominally facing a similar ‘intake disadvantage’ challenge. Moreover, they are wider at the extremes. Overall it appears that schools with lots or few disadvantaged children get the best average results for pupils but also have the most volatility and widest range.
28. For the schools with the highest concentrations of disadvantaged students,34 the difference between the best (above the 95th percentile) and the worst (below the 5th percentile) performing schools is more than 45 percentage points. In the best performing schools, more than two thirds of their poorest students (67 per cent) gained 5 A*-C grades including English and maths in their GCSEs in 2013; but in the schools with the lowest results, it was as few as one in five (21 per cent). In other words, three times as many
disadvantaged pupils get five good GCSEs including English and maths in the best schools than in the schools with the weakest results
33
Social Mobility and Child Poverty Commission, State of the Nation 2013, 2013
34
Where 36 per cent or more of the students are disadvantaged/have been eligible for free school meals in the last six years.
13
Figure 4 Performance of schools with similar proportion of disadvantaged students – proportion of disadvantaged students achieving five good GCSEs including English and Maths
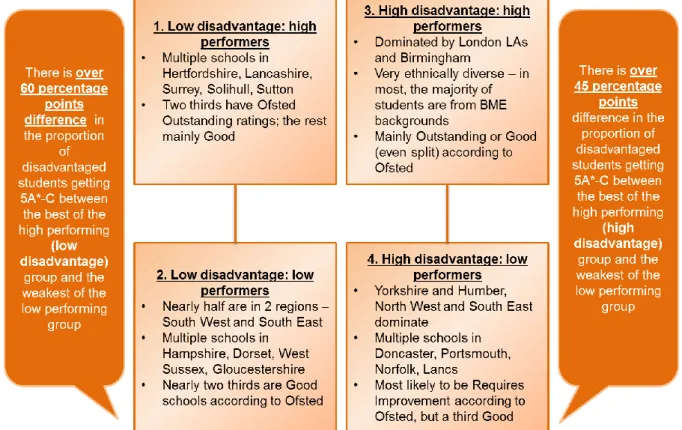
29. This variation in school performance raises a question: why are some schools achieving so much better outcomes for disadvantaged children than others? Figure 5 offers some tentative analysis of the different characteristics of the schools in the four corners of the chart – tentative because it is necessarily based on small numbers of schools (and, in low disadvantage areas, low numbers of students).
14
Figure 5 Analysis of ‘extreme’ performing schools for disadvantaged children
30. This analysis suggests that high disadvantage schools tend to be getting the best results for disadvantaged students in large urban areas with lots of
students from ethnic minorities; schools with fewer disadvantaged pupils tend to be getting the best results in a broader range of places – for example
Hertfordshire, Lancashire, Solihull and Surrey. High disadvantage, low
attainment schools are more likely to be found in the South East, North West and Yorkshire and the Humber. Low disadvantage, low attainment schools are concentrated in the South West and South East including areas like
Hampshire, Dorset, West Sussex and Gloucestershire.
31. What would happen if we could close some of the gap between these schools so that for a given level of disadvantage bottom performers got nearer to the outcomes of the top? The Commission calculates that if schools across different levels of disadvantage went just half way to closing the gap with the top 20 per cent of schools with similar concentrations of disadvantage, Over 14,000 more disadvantaged students would get five good GCSEs including English and maths each year. To put that in perspective, in 2012-13, around 61,000 disadvantaged children got five good GCSEs, so that would mean nearly 25 per cent more disadvantaged children achieving at this level.
15
The progress of all students – comparing schools with cohorts of similar prior attainment
32. The approach we have taken above does not take into account prior ability, which is a key driver of variation in GCSE results. It also only looks at part of schools’ effectiveness in addressing disadvantage: a focus on children who have claimed free school meals at some point in the previous six years. This may miss out children from working class families who have never claimed free school meals as well as low attaining children middle income who – even though not disadvantaged today – are likely to be at higher risk of poverty as adults.
33. To explore these issues further, we looked at a different measure of school success that controls for the prior attainment at the end of primary school of each school’s intake, which should give a better indication of secondary schools’ effectiveness in transforming outcomes. Using the Department for Education’s similar schools methodology, we matched each secondary school in England to the best performing school in its ‘similar’ group (that is, a school which is similar in terms of the prior attainment of its GCSE pupils when they entered the school at age 11).
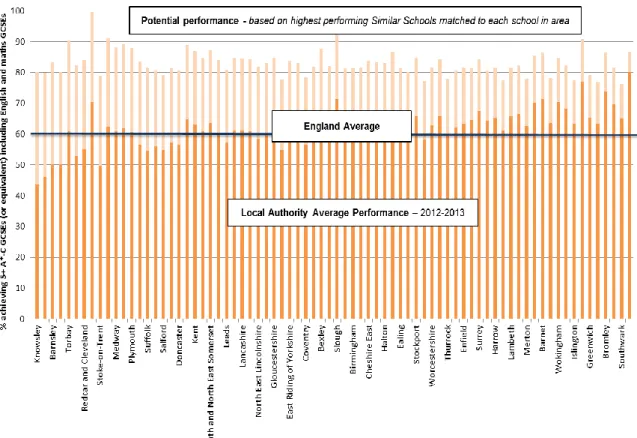
34. This analysis is presented in Figure 6. It suggests that there is a lot of variation in the results achieved by secondary schools with similar ability intakes. We looked at the gap between actual performance (the average performance across all schools in the area) and the potential performance (the average of the best performing similar schools that we matched to each school) in each local authority area and found that 37 percent more children would be achieving five good GCSEs including English and maths if all
secondary schools in England made as much progress as the best performing school with a similar intake (with the proportion of students achieving at this level increasing from 60 per cent to 82 per cent).
16
Figure 6 Variation by local authority between actual performance and potential performance based on the best similar school
35. As Figure 6 illustrates, the areas with the smallest gap between the proportion of students getting five good GCSEs including English and maths and the potential performance if they achieved the results of the highest performing similar schools are: Kensington and Chelsea (a seven percentage point gap), Southwark (11), Westminster (12), Bromley (12), Haringey (14), Greenwich (14), Sutton (14), Islington (14), Windsor and Maidenhead (14), Wokingham (14), Rotherham (14)* and Barnet (15). (*The only area in the top 20 outside of London and the South).
36. The areas with the largest gap between the proportion of students getting five good GCSEs including English and maths and the potential performance if they achieved the results of the highest performing similar schools are: Knowsley (almost twice as many would achieve the GCSE threshold - 80 per cent versus 44 per cent - meaning there is a 37 percentage points gap), Blackpool (34 percentage point gap), Barnsley (33), Middlesbrough (30), Torbay (30), Bradford (29), Redcar and Cleveland (29), Trafford (29), Stoke on Trent (29), Poole (29), Northumberland (29) and Portsmouth (29). The gap in outcomes at age 16 between schools in these areas and best performing schools with similar attaining students at age 11 amounts to about around a third of students in the lagging schools. In Knowsley, for example, 82 per cent more GCSE students could have gained five good GCSEs including English and maths if every local secondary school did as well as the highest
performing school in England which had an intake with similar prior attainment at age 11.
17
schools system to do far better for children if schools could close the gap with best performers. We estimate that if each school in England went just half way towards matching the achievements of the highest performing school with a similar ability intake, 60,000 more students would get five good GCSEs each year. In 2013, 320,000 Year 11 students achieved five A*-C grades, including English and maths, so this would mean 19 per cent more children achieving at this level.
What do better results mean?
38. Our analysis above demonstrates that if every secondary school went half way towards matching the performance of the best schools facing a similar context, this would mean thousands more disadvantaged and low attaining students leaving school with better results:
Lifting the tail for disadvantaged children in schools across disadvantage levels would mean over 14,000 more children from low-income
backgrounds getting five good GCSEs including English and maths. Raising the bar on low attainment in schools with similar intakes at 11
would mean 60,000 more students getting five 5 good GCSEs including English and maths.
39. What difference would this make to social mobility? The short answer is a significant one: higher earnings and employment levels and improvements in health and wellbeing, as well as significant savings to the taxpayer through higher tax revenues, lower expenditure on benefits and less pressure on public services.
40. On earnings:
People with five good GCSEs earn around 10 per cent more than similar people who hold lower level or no qualifications
The lifetime productivity gain of attaining qualifications at this level compared to similar people who hold lower level or no qualifications is worth £100,000 for men and around £85,000 for women35
41. On employment:
People with five good GCSEs are more likely to be in employment than individuals who hold lower level or no qualifications.36 A spell of
unemployment at the age of 18 can lower an individual’s wages by 12-15 per cent by the age of 42 compared to a comparable person who did not experience unemployment.37
42. On health and wellbeing:
35
Greenwood, C. Jenkins, A. and Vignoles, A., The Returns to Qualifications in England: Updating
the Evidence Base on Level 2 and Level 3 Vocational Qualifications, 2007
36
Ibid.
37
18
Achieving five good GCSEs is associated with a lower risk of depression, smoking and obesity in later life.38
A third (32 per cent) of young women who do not achieve at least five GCSEs at grade G or above have a child by the age of 19, meaning that they are ten times more likely to do so than those who achieve five GCSEs at grade C or above.39
43. The prize then is a big one and one worth fighting for. But the challenge is working out how we can get there. What are the barriers to unlocking the potential of more disadvantaged and low attaining children to ensure that demography does not become destiny? This question is what we now address.
38
Feinstein, L. Budge, D. Vorhaus, J and Duckworth, K., The social and personal benefits and of
learning: a summary of key research findings. Centre for Research on the Wider Benefits of Learning,
2008
39
Longitudinal Study of Young People in England: http://discover.ukdataservice.ac.uk/series/?sn=2000030
19
Part two: Accountability, teaching quality and
expectations
44. As the Commission has previously argued, two major obstacles schools face in improving social mobility are:
At a system level, the accountability framework has for many years driven a focus on those at the C/D grade borderline and encouraged the use of GCSE-equivalent qualifications that have not always carried the same value as GCSEs when it comes to getting a job as they have done in making schools look good in league tables. The consequence has been that students well below or well above the C/D borderline have sometimes been given less attention than they merit and there is also evidence that some disadvantaged students have been encouraged to take equivalent qualifications that are not always in their best interests rather than
GCSEs.40
At a school level, the key barrier has been teaching quality which, despite being perhaps the most important school-level factor influencing student attainment, varies widely between different schools and different local areas.41
45. On the first of these obstacles, the government is introducing a new
accountability framework that will measure performance across the best eight subjects with a tougher test of which subjects count and give greater
weighting to English and Maths.42 We have previously argued that this could be a positive move, with the potential to correct the worst unintended
consequences of the existing system, though much depends on its
implementation and in particular how parents react. Its strengths include that it looks at the progress of all students rather than just those at the C/D
borderline by looking at attainment across the ability distribution rather than only at the number of children who achieve a certain threshold and that it will encourage greater focus on English, maths and on qualifications that are often given more weight by further and higher education providers and employers. 46. What has not been clear until now is the extent to which the measured
performance of schools will change in this new system. This will be the new measure of school performance from 2016 so – though not yet widely recognised by parents - affects the cohort starting their GCSE courses in autumn 2014.
40
See Centre Forum, The Tail: how England’s schools fail one child in five – and what can be done, 2013 and Wolf, A., Review of Vocational Education – the Wolf Report, 2011
41
Sutton Trust, Improving the impact of teachers on pupil achievement in the UK – interim
findings, 2011
42
The new measure will include a double weighted English and Maths element, three other academic subjects within the English Baccalaureate (sciences, computer science, languages and humanities) and three other subjects. It will include an element based on absolute attainment (“Attainment 8”) and an element based on pupil progress from age 11 (“Progress 8”)
20
The absolute attainment of all students based on performance across their Best eight subjects – comparing schools’ rankings based on their performance on the current GCSE accountability measure to their ranking based on the “Attainment 8” measure that will be in place in 2016
47. We have carried out analysis of the likely impact of “Attainment 8” in order to look at the effects it will have on schools and social mobility. Using 2012-13 GCSE results, we have:
Ranked every secondary school in England, based on the proportion of all students achieving five good GCSEs including English and maths.
Re-ranked the same schools, based on the new ‘Attainment 8’ accountability measure (a score of absolute attainment i.e. not the progress measure).
Compared each school’s rankings under the two different measures. 48. This analysis helps to understand how far schools will have to go to ensure
that their curriculum, use of equivalent qualifications and attainment across the ability spectrum is in line with new expectations. We looked at the extent to which schools experience dramatic rises or falls in the new rankings to identify where there might be implications for schools in particular areas of England.
Figure 7 The impact of the new accountability framework on performance rankings of schools in 2012-13
Ranking shifted markedly- moving up 3 deciles or more
7 per cent of schools fall into this category, including:
Only 3 per cent of schools in the North East and Yorkshire and the Humber
A quarter of schools in Waltham Forest and South Gloucestershire (where no schools moved down)
Over a quarter of schools in Cumbria (two schools moved down by at least 3 deciles) and Herefordshire (where one school went down by three deciles).
Stayed the same/no drastic movement - moving -2 to + 2 deciles
86 per cent of schools fall into this category(30 per cent didn’t move decile, 36 per cent moved one decile, 19 per cent moved two deciles)
Ranking shifted markedly- moving down 3 deciles or more
8 per cent of schools fall into this category, including:
20 per cent of schools in the North East, 13 per cent of schools in the West Midlands and 12 per cent of schools in Yorkshire and Humber Over half of schools in Rotherham (where no school moved up)
A third of schools in Bournemouth, Durham and Wakefield and over a third in Wolverhampton, North Tyneside, and Sunderland (with the exception of Wolverhampton no schools in these areas moved up)
Over a quarter of schools in Sandwell, Croydon, Halton and Tower
Hamlets (with the exception of Croydon, no schools in these areas moved up)
21
49. As Figure 7 shows, most schools do not change position dramatically.
However, a minority fall significantly in performance rankings against the new measure and some regions have far higher proportions of their schools
affected than others. While overall less than one in 12 schools (eight per cent) fall three deciles or more on the new framework, this is the case for one in five schools in the North East and one in eight (13 per cent) schools in both the West Midlands and Yorkshire and Humber, as well as over a quarter of schools in Sandwell, Croydon, Halton and Tower Hamlets.
50. On average the schools which experience the greatest falls are those with the greatest proportion of disadvantaged children. For example, 40 per cent of children in schools which fall by at least three deciles are disadvantaged compared to just 20 per cent of pupils within schools whose measured performance increases by at least three deciles.43 Furthermore, 112 schools which fell by at least three deciles taught pupils living in the most deprived areas44 - this compared to just 33 schools in the most deprived areas which saw an increase of at least three deciles.
51. The fact that these schools’ relative performance falls sharply on a system that assesses performance across a set of high value subjects, double weighting the value of English and maths may expose potential weaknesses in their current offer for disadvantaged children – either children taking too few subjects, taking few of the subjects within the English Baccalaureate,
performing relatively poorly in the English Baccalaureate subjects or
performing far better around the C/D grade boundary than elsewhere in the ability distribution. These institutions are potentially those most in need of a renewed focus on social mobility; including high expectations for all students reflected in a knowledge-rich curriculum.
52. Teachers in the schools that the Commission visited to inform this report were passionately committed to social mobility, arguing that they aimed high for their students because it is the ‘right thing to do’ – indeed, changing the lives of those from disadvantaged backgrounds is the reason many entered the profession. A belief in social justice and fairness was a powerful motivator encouraging teachers to work in some of the UK’s most challenging
areas. The schools that we visited felt that an inclusive, values-driven culture which has high expectations of teachers and students improved staff
engagement, motivation, retention and performance. In addition, a number of governors and teachers described to us their strong sense of responsibility to the local community to turn out employable individuals whose futures were not determined by the circumstances of their birth or the history of the area. 53. The new accountability system has the potential to free teachers from the
perverse incentives of the threshold accountability measure. It also adds a hard edge to these moral arguments for doing more on social mobility. Now is
43
Caution should be given when interpreting these statistics as the number of schools within these extreme deciles is small.
44
High deprivation has been defined here as an Income Deprivation Affecting Children Index (IDACI) ranking of less than or equal to 30