FREC Research Reports
!!
College of Agriculture and Natural Resources
!!
University of Delaware
F
OOD
&
R
ESOURCE
E
CONOMICS
May 2000
FREC RR00-03
Factors Influencing
Participation in BR&E
Programs: A Study of Local
Coordinators in Six States
Tom Ilvento
University of Delaware
Scott Loveridge
ABSTRACT
This study used a telephone survey of coordinators of local Business Retention and
Expansion Programs (BR&E). The focus of the of the study was to survey BR&E
coordinators who conducted programs in the last five years to better understand the
factors that lead the community and the coordinator to undertake a BR&E program.
We used state program leaders to identify coordinators in six participating states:
Kentucky, Maine, Minnesota, Nebraska, North Dakota, and West Virginia. The states
represented programs that had a similar approach to BR&E in terms of a community
approach which used volunteers by design. A total of 94 Coordinators were identified,
and 80 responded to the survey during the summer and fall of 1998 (85% response
rate). Of those that did not respond, six were no longer working in the community and
could not be contacted. Initial contact was made by phone to explain the project and to
schedule a phone interview. Following the initial phone contact, a copy of the survey
and an explanation of the project was mailed to the respondent. Most of the interviews
were conducted over the phone, but in some cases coordinators sent the surveys in the
mail.
For the most part coordinators reported few concerns or conflicts prior to beginning a
BR&E program. However, local coordinators reported that many businesses were not
aware of programs available to them and that this was a motivating force in initiating
the program. Furthermore, many indicated that citizens were not knowledgeable about
economic development and the problems faced by local businesses.
In general the coordinators recognized and supported many of the benefits that we
generally use to promote BR&E programs. When asked what attracted them to a
BR&E program they answered (in order of importance) -- the program emphasized a
response to local business needs; it focused on existing local businesses; it allowed for
local decision-making; and there was a written report and written priority projects.
Coordinators were also asked to rate factors about the program that influenced their
personal participation. Their answers reflected a mix of community and personal
interests. The factors with the highest rankings were: it would help firms remain and
grow; it would help them develop better contacts with businesses; it would help them
learn about businesses; it would help their organization; and the program was needed
in the community.
ACKNOWLEDGMENTS . . . i
INTRODUCTION . . . 1
BRIEF OVERVIEW OF BR&E PROGRAMS . . . 2
What are BR&E programs? . . . 2
What Is a BR&E Visitation Program? . . . 3
SURVEY AND RESEARCH METHODOLOGY . . . 4
RESULTS OF THE SURVEY . . . 4
Description of the Social Capital in the Community. . . 6
Beginning the Program. . . 7
What Attracted Coordinators to a BR&E Visitation Program? . . . 10
Ratings of BR&E Objectives. . . 10
Factors that Influenced the Coordinator to Participate. . . 12
The Status of Economic Development Programs in the Community. . . 14
CONCLUSION . . . 15
SELECTED BIBLIOGRAPHY . . . 17
APPENDIX I: The Survey and Results . . . 18
This material is based upon work supported by the Cooperative State Research,
Education and Extension Service, U.S. Department of Agriculture, under special project
number 96-34104-2547, the Northeast Regional Center for Rural Development from the
Pennsylvania State University. Any opinions, findings, conclusions, or
recommendations expressed in this publication are those of the authors and do not
necessarily reflect the view of the U.S. Department of Agriculture.
The authors wish to thank George Morse, University of Minnesota; Kathy Tweeten,
North Dakota State University; Judy Finley, Maine Chamber of Commerce; Duane
Olsen, University of Nebraska; and Patti Kirk, Kentucky Cabinet for Economic
Development for their support and assistance in identifying coordinators for this
research project.
INTRODUCTION
Business Retention and Expansion programs (also known as BR&E) have been utilized
in the United States for nearly 30 years. BR&E is an economic development strategy
which recognizes the importance of existing businesses to the economy and
emphasizes working with existing businesses as part of local and state economic
development strategies.
Although there are many types of economic development strategies that focus on
existing businesses, the BR&E Visitation Program is one of the more comprehensive
approaches and is a good starting point for a community to begin working with existing
firms. Not all visitation programs are alike. The type of program endorsed by Business
Retention and Expansion International (BREI) has several distinct features:
1. It is a locally based program that by design utilizes local leadership in the design,
implementation, and response to the needs of the local businesses.
2. Programs use a face-to-face survey approach to identify key concerns and areas
where additional support is needed.
3. The community engages in a facilitated process to respond to the issues identified
in the business visits and puts programs in place as part of the overall economic
development strategy.
The BR&E Visitation program sanctioned by BREI seeks to help communities build
capacity and leadership while also responding to the needs of local businesses. The
dual goals of these programs - community capacity (community capital) and developing
strategies for existing businesses - set the BR&E Visitation Program apart from other
existing business approaches.
Previous research has looked at the experiences and successes of BR&E programs.
However, these studies did not examine the reasons why communities considered a
BR&E program and why coordinators decided to commit their time and energy to the
program. This study specifically seeks to add to the BR&E literature by focusing on the
decision-making process to enter into a BR&E program. This research was funded by a
grant from the Northeast Regional Center for Rural Development.
We used state program leaders to identify coordinators in six participating states:
Kentucky, Maine, Minnesota, Nebraska, North Dakota, and West Virginia. The states
represented programs that had a similar approach to BR&E in terms of a community
approach which used volunteers by design. A total of 80 Coordinators responded to
the survey during the summer and fall of 1998 (85% response rate). This report
provides a brief introduction to BR&E programs, an overview of the research process, a
summary of the survey results, and conclusions.
BRIEF OVERVIEW OF BR&E PROGRAMS
BR&E programs grew out of concerns that economic development was viewed primarily
as attracting new firms. In their efforts to lure new firms, local and state officials often
ignored existing businesses and their problems. Yet, these businesses are critical to
the local economy. Research shows that between 60 and 80 percent of new
employment is due to existing businesses. For example, Kentucky keeps statistics on
expansions and new plants for manufacturing firms. From 1995 to 1998, existing firms
accounted for 60% of employment gains and 3/4 of the investment dollars, or over $5.2
billion.
The BR&E program in New Jersey in the early 1980s is generally credited as being the
first systematic approach to retention and expansion of existing firms. The New Jersey
program was a partnership among the New Jersey Department of Commerce and
Economic Development, New Jersey Bell Telephone, and Rutgers University. This
program used local leaders to conduct business visits as well as to develop and
imple-ment recommendations. The local community was assisted by a state team who
con-ducted training, analyzed the survey information, and assisted in developing
recom-mendations. A written report summarized the results of the survey and
recommen-dations were presented to the community.
Many other states adapted and modified the New Jersey Program to meet their needs.
Changes included new support materials, written recommendations, advanced
training, and strategies for retail and agricultural businesses. Some state programs are
supported by the Cooperative Extension Service (e.g., Minnesota), while others are
ad-ministered through a partnership of state government, public utilities, and state
universities (e.g., Kentucky).
Virtually all BR&E programs have a core recognition of the importance of the existing
businesses. A BR&E program is not meant to replace other strategies, but rather is
one component of an overall economic development strategy. BR&E programs also
share the conviction that community leaders must be involved in planning the program,
conducting business visitations, and in implementing recommendations. Finally, BR&E
programs share the belief that local follow-up to problems and issues is absolutely
essential to a successful program.
What are BR&E programs?
BR&E programs refer a broad set of strategies to assist
and encourage existing businesses to continue to do business, increase efficiency, or
to grow. Successful communities engage in one or more of these programs as part of
their overall economic development plan. These include:
•
Provide technical assistance to firms
•
Sponsor seminars and workshops
Goals of a Business Visitation
Goals of a Business Visitation
Program
Program
1. Demonstrate to local business that
the community appreciates their
contribution to the local economy
2. Help existing businesses solve problems
3. Assist business in using programs
aimed at helping them become more
competitive
4. Develop strategic plans for long-range
business retention and expansion
activities
5. Build community capacity to sustain
growth and development
Source: Morse and Loveridge, 1997
•
Improve the linkage between
businesses and the schools including
school-to-work programs
•
Improve relationships among state
and local government and businesses
•
Improve quality of life, services, or the
workforce
•
Offer subsidies for retention or
expan-sion
•
Influence the retention or expansion of
state and federal facilities in an area
•
Industrial extension programs
•
Create an early warning system for
plant contractions, closings, and
relo-cations
What Is a BR&E Visitation Program?
A
Business Visitation Program
is a
mechanism by which a community can
decide upon which existing business programs it wants to emphasize. The visits
provide a community with comprehensive information that can be used by local
govern-ments, business leaders, and other planning groups. BR&E Visitation programs can
be geared toward manufacturing, retail, service or agricultural sectors of the economy.
Over 40 states have some form of a visitation program.
A BR&E Visitation program is a locally based program which can best be described as
participatory research. The community retains ownership of the program, shapes the
focus of a survey, is actively involved in collecting and analyzing data, and plans for a
response to the data. The goals of a BR&E Visitation program are listed in the Box.
There are two key elements to a BR&E Visitation program that are critical to its
success.
The first key is that it is a local process.
The program is planned and
implemented at the local level by a volunteer group. Most often these volunteers are
professionals in economic development, finance, public utilities, or members of a
chamber of commerce. In addition, a B&E Visitation Program uses selected volunteers
to conduct visits. The local involvement leads to buy-in and commitment, higher
responses rates on the survey, and increased willingness to respond to the issues
found in the survey process.
The second key element is that we plan for something to happen with the information.
A BR&E Visitation Program should not lead to another report that sits on a shelf. From
the start there is a plan for follow-up which involves a task force of experts who are
organized to respond to issues. While a community cannot guarantee that each
problem will be solved, the community does engage in a good faith effort to work with
the business community to address problems and concerns.
SURVEY AND RESEARCH METHODOLOGY
The goal of the survey effort was to interview local coordinators for BR&E programs
within the prior five years. The five year limitation was used because we were asking
participants to recall information from the beginning of their program, and we felt that
too long of a time frame would present data reliability problems.
Since there was not an available list of BR&E coordinators, we relied on the assistance
of state program leaders to identify coordinators in six participating states: West
Virginia, Minnesota, North Dakota, Maine, Nebraska, and Kentucky. The states
represented programs that had a similar approach to BR&E and participated in BREI.
All of these state programs involved a community approach which used volunteers by
design. Prior to requesting a list of coordinators, state program leaders were informed
of the goals of the research and assured that confidentiality would be maintained.
A total of 94 coordinators were identified through this process. Initial contact was
made by phone to explain the project and to schedule a 30 minute phone interview.
Following the initial phone contact a copy of the survey, an explanation of the project,
and the time and date of the scheduled interview was mailed to the respondent.
Of the 94 coordinators, 80 completed an interview for an overall response rate of 85
percent. The majority of the interviews were conducted over the phone. Some
respondents were not able to participate in a phone interview after repeated attempts,
but they were able to return a completed survey by mail. Of those that did not respond,
six were no longer working in the community and thus no longer part of the population
for the project. Removing these six from the list left an adjusted response rate of 91
percent (80 of 88).
RESULTS OF THE SURVEY
The survey was administered to coordinators of local BR&E programs in six states. For
most of the coordinators this was their first experience with a B&E program (77.5%).
The majority of coordinators found out about BR&E through a state sponsor (52.5%),
followed by a colleague (40.0%), association (25.0%), or a presentation (22.5%). Two
thirds indicated they had some form of existing business programs in the community,
but far more indicated they had an attraction program (75.8%) or encouraged new
business start-ups (75.0%). The majority of the programs (61.3%) targeted mixed firms
(manufacturing, retail, and others) while the next highest focus was manufacturing only
(28.8%). The average number of firms visited was 67 with a low of 10 to a high of 547.
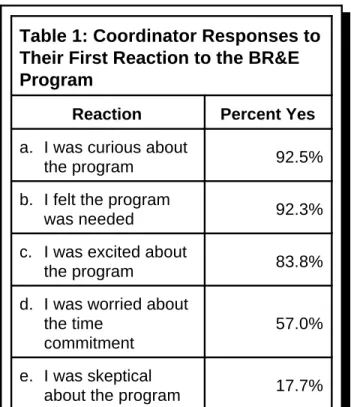
Table 1: Coordinator Responses to
Their First Reaction to the BR&E
Program
Reaction
Percent Yes
a. I was curious about
the program
92.5%
b. I felt the program
was needed
92.3%
c. I was excited about
the program
83.8%
d. I was worried about
the time
commitment
57.0%
e. I was skeptical
about the program
17.7%
Figure 1
:
Coordinators’ First
Reaction to BR&E
The coordinators were asked a series of
five statements about their first reaction
to the program. The questions are listed
in Table 1 and Figure 1. The vast
majority of coordinators were curious
about the program, felt it was needed,
and were excited about BR&E (see Table
1). Over half were worried about the time
commitment that BR&E requires (57%).
The time commitment of the coordinator
and the Leadership Team is substantial.
Morse and Loveridge estimate at least
110 hours of commitment for a
coordinator over a two year period, which
may expand further depending upon
involvement in priority projects (1997).
Only 18 percent were initially skeptical
about the BR&E program.
Coordinators were asked about their initial
role in introducing the BR&E program to
their community. The majority began as part
of a committee that studied the BR&E
program and eventually decided to
implement the program (57%). Another third
had a stronger role and indicated they
initially sold the idea to others in the
community (31.6%). Only 11 percent
indicated that someone else in the
community sold them on the idea. It
appears that most coordinators of local
BR&E programs took an active leadership
role either as the driving force for the
program or through their participation on a
committee. A second question supports this notion. The coordinators were asked
about which response best describes how they decided to get involved in a BR&E
program. Most indicated their involvement was part of their job (53.8%) or they
volunteered (32.5%). Over a small percentage indicated they were recruited (12.5%)
or felt they didn’t have a choice (1.3%).
Description of the Social Capital in the Community.
Those involved in community
development often focus on the past experiences of communities as shaping future
collective action. The next section of the survey focused on the coordinator’s
assessment of the community using a series of questions used in past research on
social capital. The actual questions are given in Table 2.
For the most part the coordinators viewed their community as a friendly, close-knit
place where people are involved in the community. For example, 66.3 percent either
agreed or strongly agreed that being in the community is like living with a group of
close friends. Four-out-of-five believed that residents of their community could be
involved in governmental affairs if they wanted to. Nearly three-quarters believed that
community organizations and clubs wanted what was best for the community. All of
these indicators suggest the communities drawn to BR&E Visitation programs have a
sense of community and a reservoir of social capital to draw on when conducting a
program. Those involved in promoting BR&E programs believe this sense of
community is important to a successful program and seek to enhance or build upon it
when assisting a community in a BR&E Visitation program.
Table 2: Coordinator Views of Social Capital Aspects of Their Communities
Strongly
Agree
Agree
Un-decided
Disagre
e
Strongly
Disagre
e
a. Being a resident of this community is
like living with a group of close
friends.
17.5%
48.8%
15.0%
16.3%
2.5%
b. If you do not look out for yourself, no
one else in this community will.
3.8%
13.8%
10.0%
61.3%
11.3%
c.
Most everyone in this community is
allowed to contribute to local
governmental affairs if they want to.
27.5%
55.0%
6.3%
8.8%
2.5%
d. When something needs to be done in
this community, the whole community
usually gets behind it.
6.3%
52.5%
18.8%
20.0%
2.5%
e. Community clubs and organizations
are interested in what is best for all
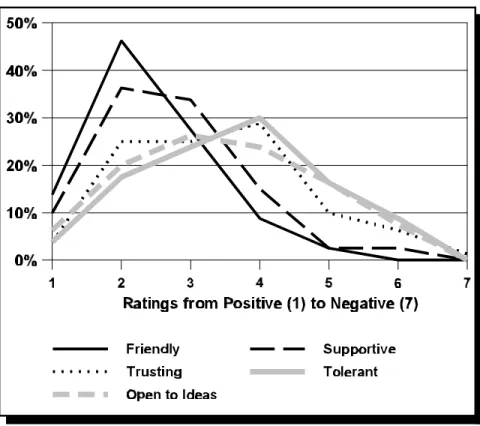
Figure 2: Coordinator Views of the Community
Via
Selected Continuums
Next the coordinators
were asked to rate their
community along a
seven point continuum
between two opposite
pairs: friendly versus
unfriendly; supportive
versus unsupportive;
trusting versus not
trusting; tolerant versus
prejudiced; and open to
new ideas versus
rejecting new ideas.
By-in-large the coordinators
rated their communities
toward the positive end
of the continuum (see
Figure 2). However, the
rating were considerably
more positive for
Friendliness (average of
2.45) and Supportiveness (2.71) compared to Tolerance (3.64) and Openness to New
Ideas (3.46) and Trust (3.4).
Beginning the Program.
The coordinators were asked several questions about the
beginning of their programs that related to problems and concerns that they or others in
the community shared about the program. A list of six different areas of concern where
given to the coordinator and he/she was asked if each was a concern, and if so to
describe the problem and how it was resolved. Specific comments are given in
Appendix II. Only 6 percent indicated problems with turf battles in their community (see
Figure 3). Turf battles were fought between government entities (city versus county) or
organizations e.g., (industrial development authorities versus other economic
development groups). Most indicated that these problems were resolved satisfactorily.
Another source of concern was over the use of volunteers. Two of every five
coordinators (42.5%) indicated there were concerns over the use of volunteers. In their
description of the problems, the major concerns were over the time commitment of the
volunteers, whether they could recruit enough, and the professionalism of the
volunteers. The resounding solution given for these concerns, and what enabled the
programs to move forward, was the mandatory volunteer visitor training. A related
Figure 3
.
Coordinators Views on
Concerns at the Beginning of the BR&E
Program
concern was over volunteers maintaining
confidentiality, where one-third of the
coordinators indicated it was a concern.
Most indicated the training and careful
selection of volunteers were the main
ways to address this concern.
Slightly less than one-third expressed
concerns about the costs of the program
(29.1%), Most of these concerns proved
to be short-lived and communities found
support from a number of sources,
including local industries, banks, utilities,
and state governments. Only 12.5
percent of the coordinators indicated
there were problems getting funding (see
question 18). In looking at the
comments, many of these problems
involved confusion over which group was responsible for which costs of the program.
Two of the largest concerns involved the time it takes to complete the program and the
overall effectiveness of the program. Over half (56.3%) were concerned about the time
factor. A BR&E program does require a substantial amount of volunteer time, and
most programs indicate the initial part of the program, from inception up to the
commencement meeting, takes six months to one year to complete. However,
communities are strongly encouraged to think of the implementation of priority projects
that come out of the survey process as requiring another one to two years to complete.
In the comments the coordinators indicated that volunteer time was a precious
commodity in their community and the initial view of a one to two year process as
daunting. They also indicated that keeping people involved and engaged during down
times was also a concern. At-the-same-time, coordinators indicated that concerns
about the amount of time required and the difficulties in keeping people engaged
resolved themselves once the surveys were returned. At that point the local people
began to became more involved by responding to issues raised by the firms.
The issue of effectiveness is a difficult one for BR&E programs, both from the
perspective of those promoting these programs and from the coordinators. Forty
percent of the coordinators were concerned over whether the program would be
effective in terms of a return on the investment into the program (in jobs and growth),
and whether they could effectively respond to business problems. Some indicated that
through the recommended process of a BR&E Visitation Program - such as establishing
a Leadership Team and Task Force, conducting Red Flag Reviews, setting priority
T
ABLE
2.
O
RGANIZATIONS
I
NVOLVED IN THE
L
OCAL
BR&E
P
ROGRAMS
O
RGANIZATIONP
ERCEN TBusiness Owners
87.5%
Chamber of Commerce
85.0%
Public Officials (Mayor/County
Official)
83.8%
Industrial Development Authority
(organization responsible for the
recruitment of manufacturing firms,
Economic Development Authority,
Community Development Authority))
77.2%
Banks
73.8%
State and Federal Agencies
68.8%
Public Schools
61.3%
Utilities
57.5%
Post-Secondary Educational
Institutions (technical schools,
colleges, community colleges)
50.0%
Others
21.3%
Religious Organizations
15.0%
Main Street Program
10.0%
projects, and having a community commencement meeting - helped to address these
concerns in the community.
The Players in the Visitation Program. BR&E Visitation programs have evolved over
time, as has the terms and structure currently recommended for a program. BREI in its
training program currently recommends a four person Leadership Team to plan and
oversee the program and a 10 to 20 member Task Force to advise and assist in the
community response. However, state programs often use slightly different terms or
recommendations for the local structure. In this survey the average size of the
Leadership Team was nearly nine persons, while the median was 7.5. The lowest was
two, and the highest was 22. The average size of the Task Force was 20, with a
median of 18. One community indicated it had no members on the Task Force while
another had 70 members.
BR&E Visitation programs are
encouraged to have representation of
five different groups on the Task
Force and Leadership Team
-Business Leaders, Development
Professionals, Local Government
Officials, Education Officials, and
Other Community Leaders (Morse
and Loveridge, 1997). The
coordinators were asked to indicate
the involvement of 12 different
organizations in the BR&E effort (see
Table 2). Nearly all the communities
had representatives from Business
owners (87.5%), Chamber of
Commerce (85.0%), Public Officials
(83.8%) and Industrial Development
Authority/Economic Development
Authority (77.2%). These
organizations were followed by
another group that were represented
onehalf to twothirds of the time
-Banks (73.8%), State and Federal
Agencies (68.8%), Public Schools
(61.3%), and Utilities (57.5%) and
Post-Secondary Education
Institutions (50.0%). Far below
these are Religious Organizations
Figure 4
.
Factors that Attracted
Coordinators to a BR&E Visitation
Program
(15.0%), Main Street Programs (10.0%) and others (21.3%). The other category
includes organizations such as Extension, Regional Development Agencies, and
foundations.
Roughly one-in-four programs indicated that there were organizations they would have
liked to participate that did not (28.8%). Reasons given for these organizations not
participating were concerns over effectiveness, confidentiality, volunteers, and in some
cases turf issues.
What Attracted Coordinators to a
BR&E Visitation Program?
The next
section of the survey focused on a series
of questions as to what attracted the
coordinator to the BR&E Visitation
Program. The questions focused on the
unique aspects of the program that are
typically emphasized in introductory
literature, such as a focus on existing
businesses, a written report, and an
emphasis on responding to needs. The
complete list of questions and the
responses are given in Table 3 and
Figure 4.
In general, the coordinators responded
favorably to the key components
emphasized in BR&E Visitation
Programs. The combination of
Very Important
and
Important
for each factor was 70
percent or higher, and very few indicated they were not aware of a particular factor.
The highest and most strongly felt reason was that the program emphasized a
response to local business needs. Nearly all the coordinators felt this was
Very
Important
(85.0%) or
Important
(12.5%). The second most important reason was that
the program focused on existing business (96.3% combined). This was followed by an
emphasis on local people making decisions (93.8%), the organization of the program
(82.5%), the use of written priority projects (80%), and the opportunity to educate local
people on economic development (80%). The use of a written report and the
reputation of the organization providing technical support also received high ratings.
Ratings of BR&E Objectives.
The Coordinators were asked to rate each of five
objectives to BR&E Visitation programs on a scale from one to ten. This strategy had
been used in previous research on BR&E programs, however, this time they were
asked to answer in relation to when the community was considering the program. The
Figure 5
:
Highest Rating for BR&E
Visitation Goals
Table 3. Factors that Attracted Coordinators to Be Involved in the BR&E
Visitation Program
VERY IMPORTANT IMPORTANT SOMEWHAT IMPORTANT NOT IMPORTANT WAS NOT AWARE DON’T KNOWa. The program emphasized
responding to local business
needs
85.0%
12.5%
2.5%
0.0%
0.%
0.0%
b. The fact that it focused on
existing businesses
61.3%
35.0%
2.5%
1.3%
0.0%
0.0%
c. The fact that local people would
make decisions about what to do
57.5%
36.3%
6.3%
0.0%
0.0%
0.0%
d. The program appeared to be well
organized
32.5%
50.0%
8.8%
3.8%
5.0%
0.0%
e. There were written priority
projects for community action to
improve the business climate
40.0%
40.0%
15.0%
2.5%
1.3%
1.3%
f. The opportunity to educate local
people in economic development
35.0%
45.0%
17.5%
2.5%
0.0%
0.0%
g. The reputation of the
organization providing technical
assistance
33.8%
38.8%
17.5%
5.0%
3.8%
1.3%
h. There was a written report
40.0%
33.8%
17.5%
6.3%
1.3%
1.3%
scale was from one to ten with one being
low importance and ten being high
importance. The objectives and the
average ratings are given in Table 4. A
graphic depiction of the top three ratings
categories (10,9, and 8) are given in
Figure 5.
All of the ratings were high, with no
average less than .7.2. The two highest
objectives were that the program
demonstrated a pro-business attitude,
and that it assisted firms in solving local
problems. Both of these had an average
rating of 8.8 out of a possible 10. The
rating for early warning of potential
closings or expansions is notably higher
Figure 6
.
The Ratings for the Highest
Factors that Influenced the Coordinator
to Participate
difference between expectations and program experience. While some BR&E
programs find out about a potential closing or relocation during the firm visits, it is not
typical.
T
ABLE
4.
C
OORDINATOR
R
ATINGS FOR
O
BJECTIVES OF THE
BR&E
V
ISITATION
P
ROGRAM
VARIABLE
MEAN
MEDIA
N
MODE
MINIMU
M
MAXIMU
M
a. Assists firms in solving local
problems
8.8
9
10
5
10
b. Demonstrates a pro-business
attitude
8.8
9
10
5
10
c. Provides data for economic
development
8.3
8
8
2
10
d. Gives and early warning of
potential closings or expansions
8.5
9
10
2
10
e. Helps firms use State and Local
Programs
7.2
7
8
2
10
Factors that Influenced the Coordinator to Participate.
The next section focused on
12 factors that influenced the coordinator’s participation in the program. These factors
included personal benefits to the coordinator to benefits to the coordinator’s
organization and community. The responses of the coordinators reflect a mixture of
both, which seems to indicate that he/she viewed participation as both advantageous to
career and to community. The scale was
from one to ten with one being low
importance and ten being high
importance. The wording of the factors
and the average ratings are given in
Table 5. A graphic depiction of the top
three ratings categories (10,9, and 8) for
the highest factors are given in Figure 6.
The highest factor that influenced the
coordinators to participate had to do with
the value of the program for existing
businesses. The top factor was that the
program would help firms remain and
grow in the community, which had an
average rating of 9 out of 10. However,
this was followed by professional
considerations – it would help me develop better contacts with local leaders (8.5) and it
would help learn more about businesses in the community (8.4). Coordinators were
also concerned with the impact on their organization. Most felt it would be good for
their organization (8.1) or provide positive public relations (8.0). Other factors, such as
personal nonprofessional benefits, received much lower ratings. For example, few felt
it would help their social life (1.9), be fun (4.3), or improve their personal economic
prospects (4.9).
TABLE 5. FACTORS THAT INFLUENCED COORDINATOR TO PARTICIPATE IN THE BR&E
VISITATION PROGRAM
V
ARIABLEM
EANM
EDIANM
ODEM
INIMUM
M
AXIMU Ma. This will help firms remain and
grow in the community
9.0
9.0
10
4
10
b. This program will help me develop
better contacts with local leaders
8.5
9.0
10
1
10
c. The program will help me to learn
about businesses in my
community
8.4
9.0
10
1
10
d. The program will help my
organization
8.1
8.5
10
2
10
e. This program will be good public
relations for my organization
8.0
8.0
10
1
10
f. This is needed, local firms have
been feeling neglected
7.6
8.0
8
2
10
g. It is my civic duty to help the
community by participating in this
program
6.8
7.0
8
1
10
h. This program will help me share
my ideas about how we should
promote the community
6.4
7.0
8
1
10
i. The program was a low risk
strategy for me
5.6
6.0
5
1
10
j. If we help local firms grow, my
personal economic prospects will
likely improve
4.9
5.0
1
1
10
k. This program will be fun
4.3
4.0
1
1
10
l. This program will help me develop
my social life
The Status of Economic Development Programs in the Community.
One of the
last questions in the survey asked coordinators to reflect on the status of economic
development activities in the community, specifically focusing on the coordination of
activities and the involvement of businesses and citizens (see Table 6). Responses
were mixed as to whether economic development activities were poorly coordinated,
with slightly more than half disagreeing with that statement for an average response of
4.9 (on a scale from 1 to 10). Far more agreed that people had a poor understanding
of economic development (average of 6.3) and that few people were involved in
economic development (average of 6.0), and that local people had a poor
understanding of business problems (average of 6.8). Coordinators were even more in
agreement that firms did not understand the resources available to them (average of
7.4) or that they were unlikely to ask for help (average of 7.6).
TABLE 6. AGREEMENT ABOUT THE STATUS OF ECONOMIC DEVELOPMENT IN THE
COMMUNITY
V
ARIABLEM
EANM
EDIANM
ODEM
INIMUM
M
AXIMU Ma. Our local economic development
activities were poorly coordinated.
4.9
5.0
3
1
10
b. People in our community had a
poor understanding of economic
development
6.3
7.0
8
2
10
c. Few people were involved in our
local economic development
efforts.
6.0
7.0
8
1
10
d. Local people had a poor
understanding of business
problems.
6.8
7.0
7
2
10
e. Firms did not understand what
resources were available to them.
7.4
8.0
8
2
10
f. Firms were unlikely to ask for
assistance.
7.6
8.0
10
2
10
g. There were turf battles about
economic development.
CONCLUSION
The coordinators from local BR&E Visitation programs represented coordinators in six
states that conduct active BR&E Visitation Programs -Kentucky, Maine, Minnesota,
Nebraska, North Dakota, and West Virginia. Their responses reflect the fears,
anxieties, and hopes of many potential coordinators as they begin to think about
participating in a BR&E Visitation program. Most begin with a curiosity and interest, but
a few are skeptical about the impact of the program, and far more are worried about the
time commitment. However, all of participants in this survey went forward with the
program and served in a leadership capacity. The purpose of this survey was to gain a
better understanding of why their community participated and what drew them to be a
coordinator.
For the most part coordinators reported few concerns or conflicts up-front in the BR&E
process. There were a few who indicated concerns with turf battles amongst competing
economic development organizations, but these issues were mostly resolved. A larger
group expressed concerns about the use of volunteers, confidentiality, and the ability to
pay for the program. Once again, the programs were able to work through these issues
through discussion and by following sound practices developed by BR&E
professionals. For example, many of those who expressed concerns about
confidentiality indicated that the mandatory training of volunteers addressed this
concern directly as part of the training.
When looking at the status of economic development activities in their communities,
coordinators reported concerns that economic activities were poorly coordinated; that
local people were not involved in economic development activities, had a poor sense of
the local economy, and did not understand the problems local firms faced; and that
firms did not always know who or what to ask for help. The BR&E Visitation program
provided some benefits in many of these areas by involving a wider group in
understanding business needs and problems, and then by coordinating this information
into a community response to the businesses.
Coordinators also recognized and supported many of the goals and benefits of a BR&E
Visitation Program that professionals generally promote. Coordinators liked that the
program focused on existing businesses and responded to their needs, that it involved
local people in decision-making, and that there was a report and priority projects
identified. The motives for participation of Coordinators reflected a mixture of
professional interests – building contacts and helping their organization – and a sense
of commitment to existing businesses.
The responses of the coordinators re-affirm many of the marketing strategies currently
used in BR&E Visitations programs. They reacted strongly to the goals of the program,
and many of the factors suggested to engage in a BR&E Visitation Program.
Professionals running state or provincial programs should emphasize these aspects of
the program when recruiting new communities. Previous research has shown that
these unique aspects of the BR&E Visitation program have lead to effective programs.
This research report shows that these same aspects can serve as effective marketing
points when promoting the program.
SELECTED BIBLIOGRAPHY
BREI Web Site, http://www.brei.org/
BREI Master Consultant Web Site,
http://www.breimc.org/
Ilvento, Thomas W. and Paul Van Auken. Retention And Expansion of Existing Businesses:
An Economic Development Approach for Communities, University of Delaware, November
1998
Loveridge, Scott, and George Morse. 1997. Implementing Local Business Retention
and Expansion Visitation Programs, Northeast Regional Center for Rural Development
Publication No. 72. The Pennsylvania State University. 7 Armsby Building, University
Park, PA 16802-5600. 814-863-4656.
Loveridge, Scott, and Thomas R. Smith. 1992. "Factors Related to Success in Business
Retention and Expansion Programs," Journal of the Community Development Society.
23(2): 66-78.
Loveridge, Scott, and Beth Loy. 1997 West Virginia Attitudes Toward Economic
Development, TVA Rural Studies Program, Contractor Paper 98-2, Department of
Agricultural Economics, University of Kentucky, 400 Agricultural Engineering Building,
Lexington, KY 40546. (606) 257-1872.
Morse, George (ed.). 1990. The Retention and Expansion of Existing Businesses:
Theory and Practice in Business Visitation Programs, Iowa State University Press,
Ames.
Local BR&E Program Coordinator Telephone Survey
Date:________
Time:________
Telephone:______________________
Community: ___________________________
State: _____________________
1.
What year did you begin your first BR&E program?
From 1988 to 1997, with 59%
since 1995
2.
Was this your first experience with a BR&E program?
(Circle your response)
Yes 77.5%
No 22.5%
3.
How did you hear about the BR&E program
? (Check all that apply)
6.3%
Brochure in the mail
22.5%
Attended a presentation
2.5%
Heard from newspaper/radio/tv
40.0%
Colleague
10.0%
Boss
25.0%
Professional Association
52.5%
Contact from state BR&E sponsor
4.
What were your reactions to the BR&E Visitation program when
you first heard about
it?
Please answer Yes or No to each one.
Yes
No
a.
I was curious about the program
92.5%
6.3%
b.
I was skeptical about the program
17.7%
82.3%
c.
I was excited about the program
83.8%
16.3%
d.
I felt the program was needed
92.3%
7.7%
e.
I worried about the time commitment
57.0%
43.0%
5.
We’d like to know a little bit about your role in introducing the BR&E program to your
area? Which of the following best describes your role? (
Choose only one)
31.6%
I sold people on the idea
57.0%
I was part of a committee that studied the program and jointly decided to
implement it
11.4%
Someone sold me and others on the idea
6. Which of the following best describes how you decided to get involved in your
areas’s BR&E program
(choose only one)
32.5%
I Volunteered
0.0%
I felt like I owed someone a favor
12.5%
I was recruited
53.8%
It was part of my job description
1.3%
I didn’t have a choice
7.
We are interested in your attitudes about the community where your BR&E program
took place. Please rate your community by indicating whether you STRONGLY
AGREE to STRONGLY DISAGREE with the following statements.
Strongly
Agree
Agree
Un-decided
Disagree
Strongly
Disagree
a. Being a resident of this
community is like living with a
group of close friends.
17.5%
48.8%
15.0%
16.3%
2.5%
b. If you do not look out for
yourself, no one else in this
community will.
3.8%
13.8%
10.0%
61.3%
11.3%
c.
Most everyone in this
community is allowed to
contribute to local
governmental affairs if they
want to.
27.5%
55.0%
6.3%
8.8%
2.5%
d. When something needs to be
done in this community, the
whole community usually gets
behind it.
6.3%
52.5%
18.8%
20.0%
2.5%
e. Community clubs and
organizations are interested in
8.
We are interested in how you would describe your community. For each of the
words pairs I will give you, please rate your community along a continuum from one
extreme to the other. For example, the first pair is friendly versus unfriendly. The
numbers in between (1, 2,3,4,5, 6 and 7) represent degrees of friendliness, with 4
representing a middle ground. Please indicate which best describes your
community.
1
2
3
4
5
6
7
Friendly
13.8%
46.3%
27.5%
8.8%
1.3%
2.5%
0.0%
Unfriendly
Supportive
10.0%
36.3%
33.8%
15.0%
2.5%
2.5%
0.0%
Unsupportive
Trusting
3.8%
25.0%
25.0%
28.8%
10.0%
6.3%
1.3%
Not Trusting
Tolerant
3.8%
17.5%
23.8%
30.0%
16.3%
8.8%
0.0%
Prejudiced
Open to New
Ideas
6.3%
20.0%
26.3%
23.8%
16.3%
7.5%
0.0%
Rejecting New
Ideas
Now we’d like to learn about the circumstances of how the community began the BR&E
program. Specifically, we would like to know about any issues that emerged when you were
deciding to begin the program. Please answer yes or no to each question.
9. Were there turf battles about who should conduct the program?
No 93.8%
Yes 6.3%
If yes, describe the problems and how did you overcome these concerns?
10.
Were there concerns about whether volunteers could conduct effective visits?
No 57.5%
Yes 42.5%
If yes, describe the problems and how did you overcome these concerns?
11.
Were there concerns about volunteers maintaining confidentiality?
No 68.8%
Yes 31.3%
12.
Were there concerns about the financial costs of the BR&E program?
No 70.9%
Yes 29.1%
If yes, describe the problems and how did you overcome these concerns?
13.
Were there concerns about effectiveness of the program?
No 60.0%
Yes 40.0%
If yes, describe the problems and how did you overcome these concerns?
14.
Were there concerns about the amount time it would take to complete the program?
No 43.8%
Yes 56.3%
If yes, describe the problems and how did you overcome these concerns?
15.
How many people were involved in organizing your local BR&E program?
Please
break it down by the following functions:
8.9
Leadership Team or Planning committee
19.6
Task Force
35.6
Volunteer Visitors
50.7
TOTAL
PARTICIPANTS
(Recognizing that some people serve in multiple
roles, estimate the total number involved)
16.
What organizations were involved in the local BR&E program?
(Check all that apply)
85.0%
Chamber of Commerce
77.2%
Industrial Development Authority (organization responsible for the recruitment of
manufacturing firms, Economic Development Authority, Community Development
Authority))
83.8%
Public Officials (Mayor/County Official)
61.3%
Public Schools
50.0%
Post-Secondary Educational Institutions (technical schools, colleges, community
colleges)
10.0%
Main Street program
57.5%
Utilities
73.8%
Banks
87.5%
Business Owners
15.0%
Religious Organizations
68.8%
State and Federal agencies
21.3%
Others _________________________________________________
17.
Were there organizations that you felt should be involved in the local effort but
declined to participate, either initially or throughout the process?
No 71.3%
Yes 28.8%
If yes, please answer a-c below:
a. What kind of organization(s)
b. What concerns did they have? (Check all that apply)
9.1%
Turf issues
4.5%
Use of volunteers
18.2%
Confidentiality
9.1%
Costs
36.4%
Effectiveness
22.7%
I Don’t Know
50.0%
Other: _______________________________________________
c. Were they convinced to participate by the end of the program?
No 60.0%
Yes 40.0%
If yes, what convinced them?
18.
Were there problems finding local funding for the program?
(Funding includes local
expenses such as copying and mailing as well as any funds for participating in the state
program]
No 87.5%
Yes 12.5%
19.
Now we would like to ask some questions about what attracted you to the BR&E
program.
As you were deciding to get involved in the program
, how important were
the following aspects of the program to you?
For each one, was it Very Important,
Important, Somewhat Important, Not Important. You can also answer that you were
not aware of an aspect or you don’t know
.
VERY IMPORTANT IMPORTANT SOMEWHAT IMPORTANT NOT IMPORTANT WAS NOT AWARE OF THIS DON’T KNOW
a. There was a written
report
40.0%
33.8%
17.5%
6.3%
1.3%
1.3%
b. The program
emphasized
responding to local
business needs
85.0%
12.5%
2.5%
0.0%
0.%
0.0%
c. There were written
priority projects for
community action to
improve the
business climate
40.0%
40.0%
15.0%
2.5%
1.3%
1.3%
d. The reputation of the
organization
providing technical
assistance
33.8%
38.8%
17.5%
5.0%
3.8%
1.3%
e. The fact that it
focused on existing
businesses
61.3%
35.0%
2.5%
1.3%
0.0%
0.0%
f.
The fact that local
people would make
decisions about what
to do
57.5%
36.3%
6.3%
0.0%
0.0%
0.0%
g. The opportunity to
educate local people
in economic
development
35.0%
45.0%
17.5%
2.5%
0.0%
0.0%
h. The program
appeared to be well
-25-20.
When you were considering the program for your community, can you tell me how
important you would have rated the following BR&E program objectives on a scale of
one to ten, with ten being highest?
The BR&E Program:
Low
Importance
High
Importance
1
2
3
4
5
6
7
8
9
10
a. Demonstrates a pro-business
attitude
0%
0%
0%
0%
3%
5%
5%
28%
16%
44%
b. Helps firms use state and federal
programs
0%
3%
1%
1%
12%
19%
17%
24%
13%
10%
c.
Assists firms in solving local
problems
0%
0%
0%
0%
4%
0%
5%
26%
30%
35%
d. Provides data for economic
development
0%
1%
0%
1%
3%
6%
8%
36%
19%
26%
e. Gives early warning of potential
closings or expansions
0%
3%
0%
1%
4%
1%
17%
13%
24%
38%
21.
Now I’m going to read a number of statements about participating in a BR&E
program. As I read these, I’d like you to try to put yourself in the frame of mind you
were in as you were considering whether to participate in the BR&E program. After
each statement, tell me on a scale of 1 to 10 whether you felt this was an important
consideration. 1 means you the factor was a Very Unimportant consideration, while
10 means you felt it was a very important consideration
.
Very
Unimportant
Very
Important
a. This program was a low risk
strategy for me.
8%
6%
5%
14%
17%
15%
8%
11%
9%
8%
b. This program will help me
learn about businesses in my
community.
3%
0%
3%
0%
5%
5%
6%
16%
28%
35%
c. This program will help me
develop better contacts with
local leaders.
3%
1%
3%
0%
5%
1%
6%
15%
26%
40%
d. It is my civic duty to help the
community by participating
Very
Unimportant
Very
Important
-26-e. This program will help my
organization.
0%
3%
3%
4%
5%
3%
5%
29%
20%
30%
f.
This program will be good
public relations for my
organization.
3%
1%
1%
1%
4%
6%
15%
20%
20%
29%
g. This program will help me
develop my social life.
68%
10%
9%
6%
1%
4%
1%
1%
0%
0%
h. This program will be fun.
21%
11%
14%
8%
13%
9%
10%
11%
1%
3%
i.
This program will help me
share my ideas about how
we should promote the
community.
10%
4%
4%
5%
14%
8%
14%
19%
11%
13%
j. If we help local firms grow,
my personal economic
prospects will likely
improve.
24%
6%
10%
5%
9%
11%
9%
11%
6%
7%
k. This is needed, local firms
have been feeling neglected.
0%
4%
5%
1%
9%
5%
6%
30%
25%
15%
l. This will help firms remain
and grow in the community.
0%
0%
0%
1%
3%
3%
3%
19%
28%
45%
22.
What basic strategies for economic development was your community pursuing
before you started the BR&E program? (Answer Yes or No for each one)
a.
Working to expand existing business
67.5%
b.
Attraction of new manufacturing plants
78.8%
c.
Encouraging new business startups
75.0%
d.
Capturing more state or federal aid
48.8%
e.
Encouraging people to buy more things locally 53.8%
f.
Developing tourism
60.0%
g.
Improving infrastructure
75.9%
h.
Improving the downtown appearance
61.3%
-27-23.
Which of the following best describes the types of firms you targeted in your BR&E
program?
(Choose only one)
28.8%
Manufacturing only
1.3%
Retail and services only
3.8%
Tourism firms only
5.0%
Agricultural firms only
61.3%
Mixed sectors (combinations of sectors)
24.
How many firms did the program ultimately visit?
66.9 firms
25.
Now I’m going to ask you a number of questions relating to the status of economic
development activities before getting involved in your local Business Retention and
Expansion program. For each question, I’d like you to give me a number that
describes your reaction, with 1 being “strongly disagree” and 10 being “strongly
agree”.
Strongly
Disagree
Strongly Agree
a.
Our local economic
development activities
were poorly coordinated.
13%
9%
18%
6%
14%
13%
10%
9%
4%
6%
b.
People in our community
had a poor understanding
of economic development.
0%
8%
10%
5%
15%
10%
15%
23%
10%
5%
c.
Few people were involved
in our local economic
development efforts.
4%
4%
18%
5%
13%
6%
15%
20%
9%
8%
d.
Local people had a poor
understanding of business
problems.
0%
5%
3%
8%
15%
9%
20%
19%
9%
14%
e.
Firms did not understand
what resources were
available to them.
0%
1%
5%
3%
10%
5%
20%
29%
18%
10%
f.
Firms were unlikely to ask
for assistance.
0%
4%
1%
6%
5%
8%
19%
19%
17%
22%
g.
There were turf battles
about economic
development.
18%
10%
10%
5%
15%
10%
8%
9%
5%
9%
26.
What are the most important things you would emphasize in marketing a local BR&E
APPENDIX II: SURVEY COMMENTS
Question
Response
1
now ongoing
2
had heard about it, not worked with it
3g
County extension agent
4a
“confused” Took a while to grasp project objective
4e
Not worried about time commitment because it was an opportunity to get into the businesses.
New in the area at the time.
4c
Enthusiastic
4d
Not sure
4e somewhat
5 state holding money over our head 5 Not applicable
6 part of funding mechanism
6 Local Economic Development make it mandatory 7d floods/blizzards demonstrates
7c core leaders, not grass roots
9 County vs. city- to include all recruited from each city to represent them
9 Port Authority has responsibility for manufacturing BR&E. They thought it was getting into their turf. The non-profit that coordinated the program and brought writer in as a consultant was able to identify how they could HELP the Port Authority ACCESS manufacturers in this neighborhood.
An underlying concern was that a high level Port Authority staff member was a graduate of the U of MN. She had a perception that this program (which in MN is through the Univ. Extension Program would not be PRACTICAL and get results (retention). I was able to give her names/references from other MN communities who had used the program and gotten results. It convinced her enough to let us try it. Now she is one of our biggest fans.
Last, the foundation that funded the program was excited about the potential. The program officer we worked with is the wife of the former long-term mayor of St. Paul. She is very influential, as is the foundation she works for.
9 Which organization held responsibility. Poorly dealt with and not completely overcome 9 Couple of non-profits wanted to lead. Overcome by collaborative effort
9 Quickly worked out- ensuing happened
10 Time
10 problem was number of people available not being enough... some did extra work, some interviews not done 10 Lack of training is problem Standardized the survey & sent pairs on interviews
10 This person participated in all visits as “backseat” to provide consistency 10 Trained volunteers and focused on confidentiality