Calhoun: The NPS Institutional Archive
Theses and Dissertations Thesis and Dissertation Collection
2016-06
Corrosion and thermal processing in cold gas
dynamic spray deposited austenitic stainless
steel coatings
Luhn, John A.
Monterey, California: Naval Postgraduate School http://hdl.handle.net/10945/49334
NAVAL
POSTGRADUATE
SCHOOL
MONTEREY, CALIFORNIA
THESIS
Approved for public release; distribution is unlimited CORROSION AND THERMAL PROCESSING IN COLD
GAS DYNAMIC SPRAY DEPOSITED AUSTENITIC STAINLESS STEEL COATINGS
by John A Luhn
June 2016
Thesis Advisor: Sarath K. Menon
i
REPORT DOCUMENTATION PAGE Form Approved OMB
No. 0704–0188
Public reporting burden for this collection of information is estimated to average 1 hour per response, including the time for reviewing instruction, searching existing data sources, gathering and maintaining the data needed, and completing and reviewing the collection of information. Send comments regarding this burden estimate or any other aspect of this collection of information, including suggestions for reducing this burden, to Washington headquarters Services, Directorate for Information Operations and Reports, 1215 Jefferson Davis Highway, Suite 1204, Arlington, VA22202–4302, and to the Office of Management and Budget, Paperwork Reduction Project (0704–0188) WashingtonDC20503.
1. AGENCY USE ONLY
(Leave blank)
2. REPORT DATE
June 2016 3. REPORT TYPE AND DATES COVEREDMaster’s thesis
4. TITLE AND SUBTITLE
CORROSION AND THERMAL PROCESSING IN COLD GAS DYNAMIC SPRAY DEPOSITED AUSTENITIC STAINLESS STEEL COATINGS
5. FUNDING NUMBERS
6. AUTHOR(S) John A. Luhn
7. PERFORMING ORGANIZATION NAME(S) AND ADDRESS(ES)
Naval Postgraduate School Monterey, CA 93943–5000
8. PERFORMING
ORGANIZATION REPORT NUMBER
9. SPONSORING /MONITORING AGENCY NAME(S) AND ADDRESS(ES)
Office of the Secretary of Defense Corrosion Policy and Oversight
10.
SPONSORING/MONITORING AGENCY REPORT NUMBER 11. SUPPLEMENTARY NOTES. The views expressed in this thesis are those of the author and do not reflect the official policy or position of the Department of Defense or the U.S. Government. IRB Protocol number ____N/A____.
12a. DISTRIBUTION / AVAILABILITY STATEMENT
Approved for public release; distribution is unlimited 12b. DISTRIBUTION CODE
13. ABSTRACT (maximum 200words)
This thesis presents research on the corrosion properties and effects of heat treatment on austenitic stainless steel coatings produced by the cold gas dynamic spray process on 316L stainless steel substrates. Previous work on the use of the low-pressure cold spray process to spray austenitic stainless steel was reproduced and validated. Heat treatment of the coatings was found to reduce porosity and evidence was found of recrystallization of the coatings. No significant changes in elemental distribution were found to occur during heat treatment. Corrosion testing was conducted by salt fog testing and anodic polarization. Coatings in the as-sprayed condition were found to be less corrosion resistant than bulk 316L stainless steel. Heat treated samples were observed to show corrosion resistance even worse than as-sprayed coatings. In fact, all heat treated samples exhibited little or no passivation behavior. Grain boundary sensitization is suspected to a probable cause for poor corrosion resistance in some samples and the presence of ferrite in the powder and coatings may also be a cause of corrosion resistance that is worse than the fully austenitic substrate.
14. SUBJECT TERMS cold spray, stainless steel, salt fog testing, potentiostatic testing 15. NUMBER OF PAGES 179 16. PRICE CODE 17. SECURITY CLASSIFICATION OF REPORT Unclassified 18. SECURITY CLASSIFICATION OF THIS PAGE Unclassified 19. SECURITY CLASSIFICATION OF ABSTRACT Unclassified 20. LIMITATION OF ABSTRACT UU
NSN 7540–01–280–5500 Standard Form 298 (Rev. 2–89)
iii
Approved for public release; distribution is unlimited
CORROSION AND THERMAL PROCESSING IN COLD GAS DYNAMIC SPRAY DEPOSITED AUSTENITIC STAINLESS STEEL COATINGS
John A. Luhn
Lieutenant, United States Navy B.S., University of California, Davis, 2008
Submitted in partial fulfillment of the requirements for the degree of MECHANICAL ENGINEER
from the
NAVAL POSTGRADUATE SCHOOL June 2016
Approved by: Sarath K. Menon
Thesis Advisor
Luke N. Brewer Co-Advisor
Garth V. Hobson
v
ABSTRACT
This thesis presents research on the corrosion properties and effects of heat treatment on austenitic stainless steel coatings produced by the cold gas dynamic spray process on 316L stainless steel substrates. Previous work on the use of the low
-pressure cold spray process to spray austenitic stainless steel was reproduced and validated. Heat treatment of the coatings was found to reduce porosity and evidence was found of recrystallization of the coatings. No significant changes in elemental distribution were found to occur during heat treatment. Corrosion testing was conducted by salt fog testing and anodic polarization. Coatings in the as-sprayed condition were found to be less corrosion resistant than bulk 316L stainless steel. Heat treated samples were observed to show corrosion resistance even worse than as-sprayed coatings. In fact, all heat treated samples exhibited little or no passivation behavior. Grain boundary sensitization is suspected as the probable cause for poor corrosion resistance in some samples, and the presence of ferrite in the powder and coatings may also be a cause of corrosion resistance that is worse than the fully austenitic substrate.
vii
TABLE OF CONTENTS
I. INTRODUCTION...1
A. MOTIVATION ...1
B. THE COLD SPRAY MATERIAL DEPOSITION PROCESS ...4
C. CORROSION ...6
D. OBJECTIVES ...8
II. COLD SPRAY OF AUSTENITIC STAINLESS STEEL ...9
A. INTRODUCTION...9
B. REPRODUCTION OF PREVIOUS WORK ...12
C. SAMPLE PREPARATION FOR CURRENT WORK ...22
III. EFFECT OF HEAT TREATMENT ON SPRAYED COATINGS ...25
A. INTRODUCTION...25
B. EXPERIMENTAL METHODS ...27
C. RESULTS AND DISCUSSION ...28
IV. CORROSION TESTING OF COLD SPRAYED AUSTENITIC STAINLESS STEEL POWDERS ...63
A. INTRODUCTION...63
B. EXPERIMENTAL METHODS ...68
1. Salt Fog Testing ...69
2. Polarization Testing ...72
C. SALT FOG RESULTS AND EVALUATION ...72
D. POLARIZATION TESTING RESULTS ...91
E. DISCUSSION ...97
V. CONCLUSION ...105
APPENDIX A. CHARACTERIZATION ...107
A. COATING MICROGRAPHS...107
B. EDS MAPS ...119
APPENDIX B. FOG CHAMBER RESULTS ...131
A. SAMPLE PHOTOGRAPHS ...131
B. SURFACE PROFILES ...139
LIST OF REFERENCES ...151
ix
LIST OF FIGURES
Figure 1. Comparison of general temperature and particle velocity range for coating spray techniques. Source: [3]. ...2 Figure 2. Schematic of the cold spray deposition process. Source: [8]. ...5 Figure 3. Schematic mechanism of pitting corrosion. Source: [29]. ...7 Figure 4. Low magnification optical micrographs of coatings sprayed with
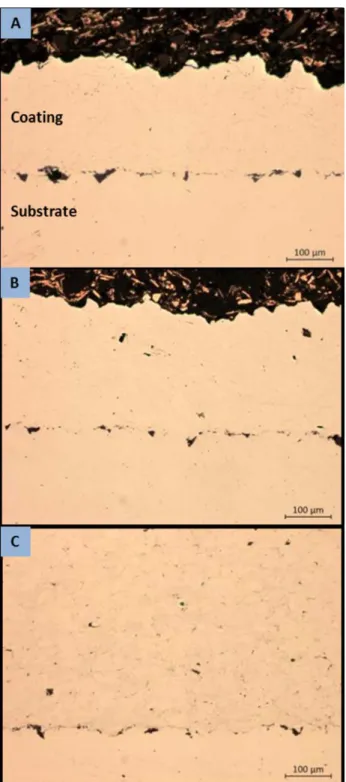
helium gas at 1.7 MPa and 230°C; 40 mm standoff distance. (a) 5001; (b) 5002; (c) PG-AMP-10. ...15 Figure 5. High magnification optical micrographs of coating sprayed with
helium gas at 1.7 MPa and 230°C; 40 mm standoff distance. (a) 5001; (b) 5002; (c) PG-AMP-10. ...16 Figure 6. Typical micrographs of PG-AMP-10 powder sprayed with N2 gas at
1.7 MPa and 450°C showing improved coating quality (decreased porosity) at 40 mm standoff distance. 16 mm standoff (top); 40 mm distance (bottom) ...17 Figure 7. Coating detachment phenomena observed during spaying of 3rd pass
with 5001 powder. He gas, 1.7 MPa at 230°C ...19 Figure 8. Coating detachment phenomena observed in 5002 powder sprayed
with helium gas at 1.7 MPa, 230°C. Increasing magnification (a) to (c). ...21 Figure 9. High magnification optical micrographs of as-sprayed coatings
showing qualitatively dense coating structure with limited porosity. (a) 5001 powder; (b) 5002 powder; (c) PG-AMP-10 powder. ...29 Figure 10. High magnification optical micrographs showing changes in porosity
with heat treatment. 5001 powder. (a) as sprayed; (b) 950°/1hr; (c) 800°C/2hrs; (d) 600°C/8 hrs. ...31 Figure 11. Backscatter electron images of 5001 powder samples showing
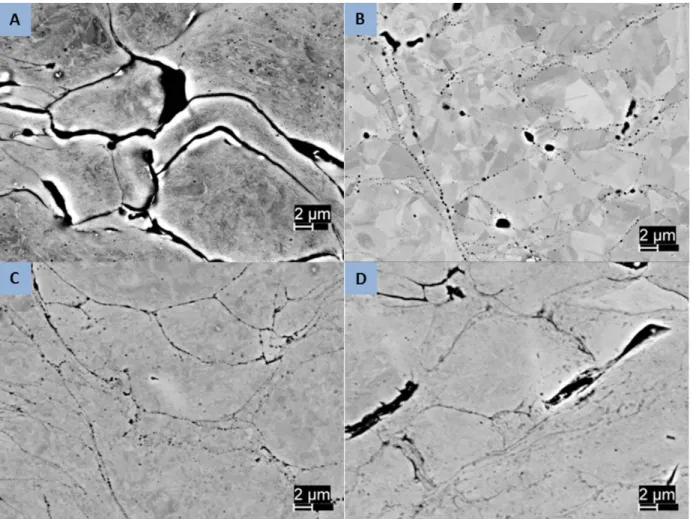
porosity reduction following heat treatment. (a) as sprayed; (b) 950°/1hr; (c) 800°C/2hrs; (d) 600°C/8 hrs. ...32 Figure 12. Backscatter electron images of 5002 powder samples showing
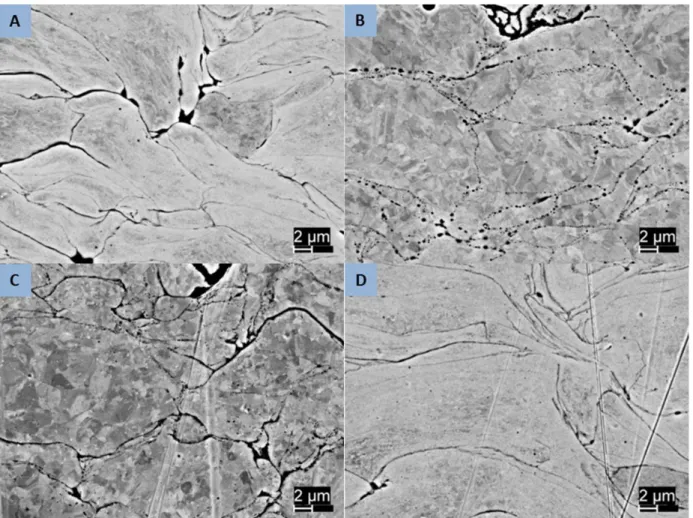
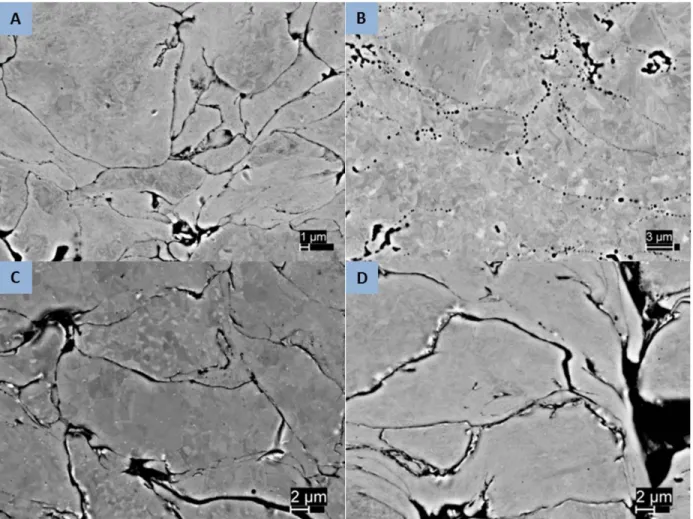
porosity reduction following heat treatment. (a) as sprayed; (b) 950°/1hr; (c) 800°C/2hrs; (d) 600°C/8 hrs. ...33 Figure 13. Backscatter electron images of PG-AMP-10 powder samples
showing porosity reduction following heat treatment. (a) as sprayed; (b) 950°/1hr; (c) 800°C/2hrs; (d) 600°C/8 hrs. ...34 Figure 14. Typical point EDS measurement of possible precipitate. ...35
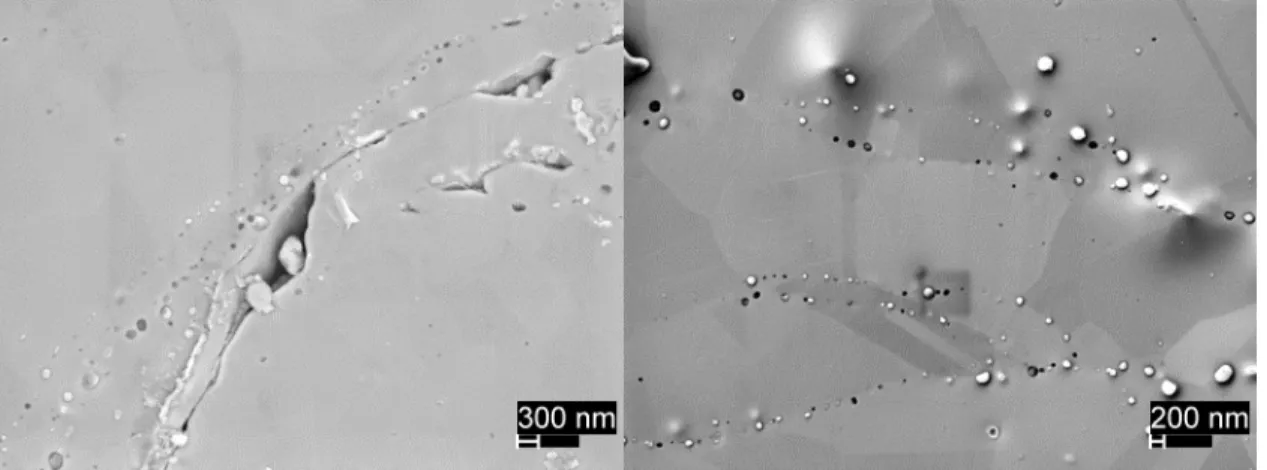
Figure 15. High resolution secondary election images of micro-porosity in 950°C/1 hr samples. 5002 powder, in lens detector (left);
PG-AMP-10 powder, secondary electron detector (right). ...36
Figure 16. Typical EDS elemental distribution map. 5001 powder, 600°C/8hrs heat treatment. ...38
Figure 17. EDS map of as sprayed PG-AMP-10 powder showing chromium rich areas likely associated with ferrite phase grains. ...40
Figure 18. EDS maps showing evidence of elemental redistribution in 5002 powder, 950°C/1 hrs (left) and 800°C/2hrs (right). Note different scale...41
Figure 19. EDS maps showing evidence of elemental redistribution in PG-AMP-10 powder, 950°C/1 hrs (left) and 800°C/2hrs (right). ...42
Figure 20. EDS maps of 5002 powder, 950°C/1 hr heat treatment at 500X (left) and 1.5KX (right) showing inconsistency in observed elemental distribution. ...44
Figure 21. EDS maps of 5002 powder, 800°C/2 hrs heat treatment at 500X (left) and 1.5KX (right) showing inconsistency in observed elemental distribution...45
Figure 22. EDS maps of PG-AMP-10 powder, 950°C/1 hr treatment at 500X (left) and 1.5KX (right) showing inconsistency in observed elemental distribution...46
Figure 23. EDS maps of PG-AMP-10 powder, 800°C/2 hrs treatment at 500X (left) and 1.5KX (right) showing inconsistency in observed elemental distribution...47
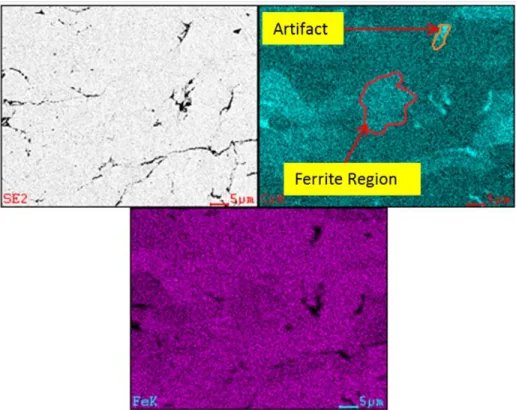
Figure 24. Chromium distribution in ferrite grains and process artifacts in PG-AMP-10 coating. ...48
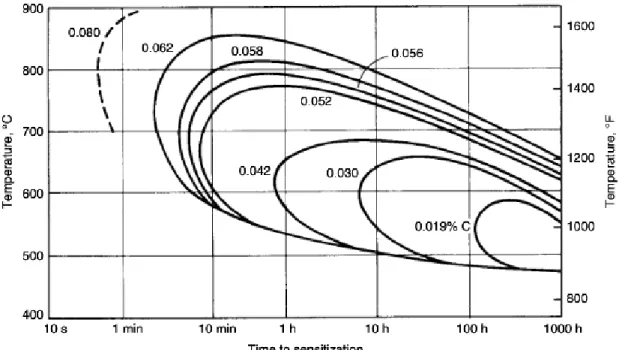
Figure 25. Time-Temperature sensitization curve for 304 stainless steel alloy with varying carbon contents. Source: [41]. ...50
Figure 26. EDS maps of high nickel particle in 5002 as-sprayed powder sample. ...51
Figure 27. X-ray diffraction spectra from 5001 powder samples. ...53
Figure 28. X-ray diffraction spectra from 5002 powder samples. ...54
Figure 29. X-ray diffraction spectra from PG-AMP-10 powder samples. ...54
Figure 30. EDS maps of chromium distribution in PG-AMP-10 powder samples showing high chromium areas likely associated with ferrite grains. (a) as sprayed; (b) 950°/1hr; (c) 800°C/2hrs; (d) 600°C/8 hrs. ...56 Figure 31. Backscatter micrographs of 950°C/1 hr heat treated samples showing
xi
visible in 5001 and 5002 samples. (a) 5001; (b) 5002; (c) PG-AMP-10...57 Figure 32. Backscatter micrographs of 800°C/2 hrs heat treated samples
showing evidence of recrystallization and grain growth. (a) 5001; (b) 5002; (c) PG-AMP-10...58 Figure 33. Average coating hardness. Results from Schiel [3] included for
comparison. ...60 Figure 34. Typical polarization curve showing passivation behavior of 316L
stainless steel in 0.05M H2SO4. Adapted from: [56]. ...67
Figure 35. Schematic diagram of a typical polarization testing cell. Source: [56]. ...68 Figure 36. Method of supporting samples in salt fog chamber ...70 Figure 37. Observed weekly salt fog sample mass loss. ...73 Figure 38. Mass loss measured after 1000 hrs salt fog exposure and cleaning of
samples with 10% nitric acid ...74 Figure 39. Example optical profiler output. (a) initial; (b) 525 hrs exposure; (c)
1005 hrs exposure, cleaned with ethanol and deionized water only; (d) 1005 hrs exposure, cleaned with 10% nitric acid. Note that color is normalized to the individual sample and varies between samples. ...76 Figure 40. Observed area fraction of sample pitting during weekly sample
inspection. ...77 Figure 41. Observed sample pit density during weekly sample inspection. ...78 Figure 42. Observed average pit area during weekly inspection. ...79 Figure 43. Pit area fraction measured after 1000 hrs salt fog exposure and
cleaning with nitric acid. ...80 Figure 44. Pit density measured after 1000 hrs salt fog exposure and cleaning
with nitric acid. ...81 Figure 45. Average pit area measured after 1000 hrs salt fog exposure and
cleaning with nitric acid. ...82 Figure 46. Maximum pit depth observed following 1000 hrs salt fog exposure
and cleaning with 10 wt % nitric acid. ...83 Figure 47. Photographs of samples showing corrosion deposits on sample
surface. PG-AMP-10 group 1. (a) initial; (b) 495 hrs; (c) 1000 hrs, cleaned with deionized water and methanol. (d) 1000 hrs, cleaned with 10% nitric acid. ...85 Figure 48. Profiler output and generated texture showing erroneous
800°C / 2 hrs heat treatment. Profile following 1000 hrs exposure
and nitric acid cleaning ...89
Figure 49. Example resolved valley profile showing pitted regions with unresolved centers (blue circled regions). 5002 powder, 950°C / 1 hr heat treatment. Profile following 1000 hrs exposure and nitric acid cleaning. ...90
Figure 50. Anodic polarization curves for 5001 powder samples. ...92
Figure 51. Anodic polarization curves for 5002 powder samples. ...93
Figure 52. Anodic polarization curves for PG-AMP-10 powder samples. ...93
Figure 53. Anodic polarization curves for as-sprayed samples. ...94
Figure 54. Anodic polarization curves for 950°C/1 hr heat treated samples. ...94
Figure 55. Anodic polarization curves for 800°C/2 hrs heat treated samples. ...95
Figure 56. Polarization curves for bulk 316L substrates. ...96
Figure 57. Photographs of samples following 1000 hours salt fog chamber exposure and cleaning with deionized water/methanol showing evidence of corrosion on coating sides. Top 5001; middle 5002; bottom PG-AMP-10. ...103
Figure 58. Low resolution optical micrographs of 5001 coating: As sprayed (top left); 950°C/1 hr (top right); 800°C/2 hrs (bottom left); 600°C/8 hrs (bottom right). ...107
Figure 59. High resolution optical micrographs of 5001 coating: As sprayed (top left); 950°C/1 hr (top right); 800°C/2 hrs (bottom left); 600°C/8 hrs (bottom right). ...108
Figure 60. Low resolution SEM micrographs of 5001 coating, backscatter mode: As sprayed (top left); 950°C/1 hr (top right); 800°C/2 hrs (bottom left); 600°C/8 hrs (bottom right)...109
Figure 61. High resolution SEM micrographs of 5001 coating, backscatter mode: As sprayed (top left); 950°C/1 hr (top right); 800°C/2 hrs (bottom left); 600°C/8 hrs (bottom right)...110
Figure 62. Low resolution optical micrographs of 5002 coating: As sprayed (top left); 950°C/1 hr (top right); 800°C/2 hrs (bottom left); 600°C/8 hrs (bottom right). ...111
Figure 63. High resolution optical micrographs of 5002 coating: As sprayed (top left); 950°C/1 hr (top right); 800°C/2 hrs (bottom left); 600°C/8 hrs (bottom right). ...112 Figure 64. Low resolution SEM micrographs of 5002 coating, backscatter
xiii
Figure 65. High resolution SEM micrographs of 5002 coating, backscatter mode: As sprayed (top left); 950°C/1 hr (top right); 800°C/2 hrs
(bottom left); 600°C/8 hrs (bottom right)...114
Figure 66. Low resolution optical micrographs of PG-AMP-10 coating: As sprayed (top left); 950°C/1 hr (top right); 800°C/2 hrs (bottom left); 600°C/8 hrs (bottom right). ...115
Figure 67. High resolution optical micrographs of PG-AMP-10 coating: As sprayed (top left); 950°C/1 hr (top right); 800°C/2 hrs (bottom left); 600°C/8 hrs (bottom right). ...116
Figure 68. Low resolution SEM micrographs of PG-AMP-10 coating, backscatter mode: As sprayed (top left); 950°C/1 hr (top right); 800°C/2 hrs (bottom left); 600°C/8 hrs (bottom right). ...117
Figure 69. High resolution SEM micrographs of PG-AMP-10 coating, backscatter mode: As sprayed (top left); 950°C/1 hr (top right); 800°C/2 hrs (bottom left); 600°C/8 hrs (bottom right). ...118
Figure 70. EDS Maps of 5001 powder as sprayed. ...119
Figure 71. EDS Maps of 5001 powder, 950°C/1 hr heat treatment...120
Figure 72. EDS Maps of 5001 powder, 800°C/2 hrs heat treatment. ...121
Figure 73. EDS Maps of 5001 powder, 600°C/8 hrs heat treatment. ...122
Figure 74. EDS Maps of as sprayed 5002 powder. ...123
Figure 75. EDS Maps of 5002 powder, 950°C/1 hr heat treatment...124
Figure 76. EDS Maps of 5002 powder, 800°C/2 hrs heat treatment. ...125
Figure 77. EDS Maps of 5002 powder, 600°C/8 hrs heat treatment. ...126
Figure 78. EDS Maps of as sprayed PG-AMP-10 powder. ...127
Figure 79. EDS Maps of PG-AMP-10 powder, 950°C/1 hr heat treatment. ...128
Figure 80. EDS Maps of PG-AMP-10 powder, 800°C/2 hrs heat treatment. ...129
Figure 81. EDS Maps of PG-AMP-10 powder, 600°C/8 hrs heat treatment. ...130
Figure 82. 5001 Group 1 Photographs. As sprayed (left), 950°C/1 hr (center), 800°C/2 hrs (right). ...131
Figure 83. 5001 Group 2 Photographs. As sprayed (left), 950°C/1 hr (center), 800°C/2 hrs (right). ...132
Figure 84. 5001 Group 3 Photographs. As sprayed (left), 950°C/1 hr (center), 800°C/2 hrs (right). ...133
Figure 85. 5002 Group 1 Photographs. As sprayed (left), 950°C/1 hr (center), 800°C/2 hrs (right). ...134
Figure 86. 5002 Group 2 Photographs. As sprayed (left), 950°C/1 hr (center),
800°C/2 hrs (right). ...135
Figure 87. PG-AMP-10 Group 1 Photographs. As sprayed (left), 950°C/1 hr (center), 800°C/2 hrs (right). ...136
Figure 88. PG-AMP-10 Group 2 Photographs. As sprayed (left), 950°C/1 hr (center), 800°C/2 hrs (right). ...137
Figure 89. Bare Substrate Photographs. As sprayed (left), 950°C/1 hr (center), 800°C/2 hrs (right). ...138
Figure 90. 5001 As-sprayed sample #1 surface profile and texture analysis. ...139
Figure 91. 5001 As-sprayed sample #2 surface profile and texture analysis. ...139
Figure 92. 5001 As-sprayed sample #3 surface profile and texture analysis. ...140
Figure 93. 5001 950°C/1 hr sample #1 surface profile and texture analysis. ...140
Figure 94. 5001 950°C/1 hr sample #2 surface profile and texture analysis. ...141
Figure 95. 5001 950°C/1 hr sample #3 surface profile and texture analysis. ...141
Figure 96. 5001 800°C/2 hrs sample #1 surface profile and texture analysis. ...142
Figure 97. 5001 800°C/2 hrs sample #2 surface profile and texture analysis. ...142
Figure 98. 5001 800°C/2 hrs sample #3 surface profile and texture analysis. ...143
Figure 99. 5002 As-sprayed sample #1 surface profile and texture analysis. ...143
Figure 100. 5002 As-sprayed sample #2 surface profile and texture analysis. ...144
Figure 101. 5002 950°C/1 hr sample #1 surface profile and texture analysis. ...144
Figure 102. 5002 950°C/1 hr sample #2 surface profile and texture analysis. ...145
Figure 103. 5002 800°C/2 hrs sample #1 surface profile and texture analysis. ...145
Figure 104. 5002 800°C/2 hrs sample #2 surface profile and texture analysis. ...146
Figure 105. PG-AMP-10 As-sprayed sample #1 surface profile and texture analysis. ...146
Figure 106. PG-AMP-10 As-sprayed sample #2 surface profile and texture analysis. ...147
Figure 107. PG-AMP-10 950°C/1 hr sample #1 surface profile and texture analysis. ...147
Figure 108. PG-AMP-10 950°C/1 hr sample #2 surface profile and texture analysis. ...148 Figure 109. PG-AMP-10 800°C/2 hrs sample #1 surface profile and texture
xv
Figure 110. PG-AMP-10 800°C/2 hrs sample #2 surface profile and texture analysis. ...149 Figure 111. Bare substrate as-sprayed sample surface profile and texture
analysis. ...149 Figure 112. Bare substrate 950°C/1 hr sample surface profile and texture
analysis. ...150 Figure 113. Bare substrate 800°C/2 hrs sample surface profile and texture
xvii
LIST OF TABLES
Table 1. Commercial powder nominal composition summary. Adapted from: [3]. ...10 Table 2. Summary of commercial austenitic stainless steel powder size.
Adapted from: [3]. ...10 Table 3. Summary of commercial austenitic stainless steel powder
characteristics. Adapted from: [3]. ...10 Table 4. Summary of cold spray coating characteristics for four commercial
austenitic stainless steel powders. Adapted from [3]. ...11 Table 5. Summary of cold spray stainless steel coatings achieved using
helium carrier gas at 230°C and 1.7 MPa. Adapted from: [3]. ...12 Table 6. Summary of deposition efficiency and coating thickness per pass for
replication of previous work and testing the effect of increased standoff distance. ...13 Table 7. Cold spray machine settings used to grit blast coupons prior to
coating deposition. ...22 Table 8. Cold spray machine settings used for coating preparation. ...23 Table 9. Elemental composition in wt % of cold spray coatings with various
heat treatments obtained through EDS. ...36 Table 10. Coating phase composition as determined by X-ray diffraction. Data
reported by Schiel [3] included for comparison. ...55 Table 11. Average coating hardness. Results from Schiel [3] included for
comparison. ...59 Table 12. Qualitative corrosion performance of as-sprayed cold spray coating
relative to uncoated 316 stainless steel substrate. ...86 Table 13. Qualitative corrosion performance of heat treated coatings relative to
corrosion performance in the as-sprayed condition. ...86 Table 14. Measured open circuit and pitting potential voltages from coating
xix
ACKNOWLEDGMENTS
I would like to thank both of my advisors, Dr. Luke N. Brewer and Dr. Sarath Menon, for their generous assistance, technical insight and help through this project. Both of these gentlemen devoted numerous hours to supporting this thesis; without them I would never have been able to complete it.
Likewise, Dr. Chanman Park, Dr. Dragoslav Grbovic and Mr. Max Neumann provided invaluable assistance with operation and training on various instruments, facilities and techniques required to complete this work.
Also, I am indebted to Ms. Miki Ngai at the University of Alabama for her generous assistance in conducting polarization testing. Without her assistance, a major section of this research could not have been completed.
Funding for this project was provided by Mr. Richard Hays, Deputy Director of the Office of the Secretary of Defense Office of Corrosion Policy and Oversight.
Finally, I would like to thank all of the faculty of the Mechanical and Aeronautical Engineering department at the Naval Postgraduate school for their technical expertise and generous assistance whenever and wherever needed. The education and experience I have received with their assistance and guidance will be an invaluable resource in my future career as an Engineering Duty Officer. I am also grateful for the assistance and support of my fellow students in this fine program.
1
I.
INTRODUCTION
A. MOTIVATION
Many material failures both within the Navy and outside of it occur due to either mechanical wear or corrosion or both. Consequently, a very large amount of effort has been invested over the years in the prevention and repair of wear and corrosion. Prevention of wear can be accomplished though design and operation changes, but also by improved materials. A major goal of material science research has been to develop materials that are harder and/or stronger in order to better resist mechanical wear. Likewise, corrosion is also responsible for significant cost in design and repair of damage; one source [1] gives an annual corrosion cost to the Department of the Navy of roughly $7 billion.
One common solution to help reduce corrosion or wear is to add a coating of a harder or more corrosion resistant material to a part in order to protect the base material. This approach allows the use of a less corrosion- or wear-resistant base material for structural, economic or other reasons. It is also common to use a material addition process to restore a worn or damaged part surface to the required dimensions. The traditional method for applying a thin uniform coating of a material is to use a thermal spray process. In this process the coating material is applied to the surface as a spray of molten droplets or heated solid particles at high temperature, which cool and solidify on contact with the base metal [2]. The thermal spray method is well developed and has many advantages including relatively low cost, simple use, fast deposition rates and a breadth of knowledge and experience in its use. However, the high temperature of the coating material can cause undesirable oxidation or property changes in the sprayed material as well as heating and possible thermal damage to the substrate material [2].
A recently developed alternative is the cold gas dynamic spray process, which uses kinetic energy of coating particles rather than thermal energy to form a coating. Consequently, the particles of coating material are subjected to much lower temperatures, greatly reducing many of thermal spray’s undesirable side effects such as vaporization of
volatile elements, thermal stresses in the coating and oxidation or property changes in the coating and/or substrate materials due to high temperatures [2]. When conducted correctly, the cold spray process also gives a more dense coating due to a plastic peening effect from succeeding particles impacting on the applied coating and from the lack of a “splashing” effect that occurs with the impact of liquid or nearly liquid droplets [2]. The range of application temperatures and velocities used in the cold spray technique as compared to other coating spray technologies is shown in Figure 1.
Figure 1. Comparison of general temperature and particle velocity range for coating spray techniques. Source: [3].
There are numerous applications for this coating technology, but those of greatest importance to the department of defense are the repair of damaged parts that cannot readily be repaired by more conventional methods and the application of protective coatings to parts made of corrosion prone materials such as magnesium. Work on the use
3
was conducted in 2010 by Spencer and Zhang [4], with the result that the stainless steel coating significantly reduced the corrosion potential of a sample when compared to uncoated magnesium alloy substrates in electrochemical corrosion testing. Their finding showed that any amount of coating had some positive benefit, and a thicker coating approached the behavior of bulk 316 stainless steel showing a pronounced passivation effect. This demonstrates a potential for the use of this coating technique for corrosion protective coatings. Notably, even though the coating has some degree of porosity, the behavior of a sufficiently thick coating suggests that adequate protection of the substrate is still achieved. This is important as the substrate material in this application will almost certainly be anodic to the coating material and hence a small exposed area of the substrate will suffer rapid corrosion due to the large available cathode area of the coating and consequent concentrated corrosion on the small exposed substrate section. The use of an aluminum coating to protect a different magnesium alloy, AZ91D, was demonstrated by Tao et al. [5] in 2010. Their work suggested that the coating reduced the pitting potential on the substrate. Similar work by DeForce et al. in 2011 demonstrated the use of a Al-5 wt % Mg coating on an otherwise active ZE41A-T5 magnesium alloy [6]. Other more exotic combinations have also been investigated; Al-Mangour et al. examined the use of a cold spray Co-Cr coating on 316L stainless and showed marked improvement in the corrosion resistance of the stainless steel [7].
The cold spray process has also been demonstrated as a viable repair process for the restoration of part surfaces that have suffered wear, corrosion or other mechanical damage [8, 9]. To repair this type of damage, new material must be added to the component without causing any detrimental changes in the base component material. For many materials, such as magnesium alloys, traditional material addition techniques such as welding or thermal spray would cause sufficient damage in the base material to render the part unusable. Traditionally, these parts would be scrapped and replaced once a certain wear/damage allowance was exceeded. The cost and operational impacts of this approach can be significant. For these applications the cold spray process offers an economical method of building up the needed material without causing base material damage and hence restoring the components to service. Not only does this offer
potentially significant cost saving, but may also allow a much faster repair, thereby minimizing downtime. P. F. Leyman and V. K. Champagne have demonstrated this use of the cold spray technique in the repair of helicopter mast supports in U.S. Army aircraft, with over 50 successful repairs conducted. These parts would have otherwise been scrapped [8]. Villafuerte and Wright have likewise demonstrated cold spray repair of other aircraft components with the repair meeting all FAA certification requirements [9]. Notably, the repairs demonstrated operationally to date have been to restore a critical dimension, rather than the repair material being used structurally. The use of the cold spray process for structural repair is an area of ongoing research [10–13].
With the current and predicted future tight defense budgets, there is a strong impetus for the U.S. Navy to investigate and develop the most effective and efficient techniques for the repair of mechanical and corrosion damage to ships and aircraft. With a proven record of success in the repair of light alloy structures, the cold spray process may prove to be an economical technique for the repair of steel structures.
B. THE COLD SPRAY MATERIAL DEPOSITION PROCESS
The cold gas dynamic spray process is a relatively recent technology originating from supersonic wind tunnel testing at the Institute of Theoretical and Applied Mechanics of the Siberian Branch of the Russian Academy of Science in Novosibirsk during the 1980s [14]. In this process, particles of the coating material are accelerated by entrainment in a supersonic jet of gas produced by the expansion of a working gas through a converging-diverging (DeLaval) nozzle. Typical particle sizes of 5 to 100 μm are used, and these particles obtain a velocity of 500–1,200 m/s when entrained in the gas jet. This velocity gives sufficient kinetic energy that the particles bond to a substrate upon impact through plastic deformation [4, 15–21]. The critical parameter in the successful adhesion of a particle is its velocity on impact with the substrate. Investigation has shown that there is a “critical velocity” where particles having a velocity in excess of this will adhere and those with a velocity below will not. The velocity achieved by a particular particle is primarily influenced by the choice of working gas and the velocity of the gas
5
in the nozzle, which is in turn a function of the upstream gas pressure and temperature. In order to increase this velocity the working gas is typically preheated prior to entering the nozzle. As the gas expands, the temperature decreases so the actual gas temperature at the point of particle entrainment is in the range of -100 to +100°C; hence the name “cold spray” [22–24]. There are two main variants on the overall cold spray process; high pressure and low pressure cold spray systems [24]. In high pressure systems the powder is entrained in the gas stream prior to expansion through the nozzle whereas low pressure systems entrain the powder on the expansion side of the nozzle. Low pressure type system typically operate at a pressure below 2.0 MPa [3] and are more portable [24]. The overall process for a low pressure type cold spray system is illustrated schematically in Figure 2.
Figure 2. Schematic of the cold spray deposition process. Source: [8].
Selection of the working gas used in the cold spray process has a great deal of effect on quality of the final coating produced [25]. The gas used must be inert to avoid undesirable reactions with the powder or substrate metals. It is desirable to have a high sonic velocity as the final nozzle exit velocity is directly related to the sonic velocity of the gas. Likewise, a high gas density is desirable to achieved the most effective acceleration of the entrained particles. Helium, nitrogen and air are the most commonly used working gasses. Of these, helium typically gives the best performance due to a high
sonic velocity, but is also by far the most costly. Nitrogen is much cheaper to use, but does not offer as good of performance [25].
C. CORROSION
Corrosion is defined as a destructive chemical reaction between a metal or alloy and its environment. It has been described as “extractive metallurgy in reverse,” as the general trend is from the refined metal to return to the lower energy chemical compound of its ore [26]. In almost all cases corrosion reactions are electrochemical in nature; that is, they involve the transfer of electric charge as part of the overall chemical reaction. The electrochemical nature of the reaction means that it may be separated into two physically separate half reactions provided there is an electrical connection between the two. This conductive path is typically proved by a conductive electrolyte which is water with dissolved ions in common environmental corrosion.
Stainless steels are characterized as a steel alloy having at least 10.5 wt% chromium added [27]. The additional chromium promotes the formation of a passive surface layer and gives a material with generally excellent corrosion resistance. However, stainless steels are susceptible to other specific corrosion modes, notably pitting, crevice corrosion and stress corrosion cracking [28]. Pitting and crevice corrosion are both forms of localized corrosion damage resulting from a similar mechanism. At its heart this is a failure of the passivation layer. Chlorine ions cause a local breakdown of the passive film leading to the nucleation of a pit. Local corrosion then leads to deaeration of the water thus forming a local acidic solution and anodic region. The surrounding water becomes alkaline by cathodic reduction of dissolved oxygen and allows the surrounding metal surface to act as an anode. Once a pit is established it forms a sheltered local environment where ferrous ions resulting from the anodic corrosion reaction can react with chlorine ions dissolved in the water to produce ferrous hydroxide and hydrochloric acid. This mechanism for acid production in turn decreases the local pH in turn produces more favorable conditions for galvanic corrosion [26]. This is shown schematically in Figure 3.
7
Figure 3. Schematic mechanism of pitting corrosion. Source: [29].
The difference between pitting and crevice corrosion is simply that crevice corrosion occurs at a mechanical feature on the material, such as a seam, void or near biological organisms such as barnacles whereas pitting can occur anywhere upon the surface [26]. Stress corrosion cracking is a form of environmentally induced cracking where a corrosion type reaction from environmental exposure results in material failure through brittle cracking [26]. However, this form of corrosion damage requires the presence of a tensile stress in the material, and since the surface of the cold spray coating is known to have significant compressive residual stress this corrosion mode will not be considered in this study [26].
D. OBJECTIVES
Two main technical objectives were set for this thesis work:
1. Investigate the corrosion properties of low pressure cold spray austenitic stainless steel coatings.
While the corrosion properties of austenitic stainless steel are well known, there is limited work on the corrosion properties of cold spray austenitic coatings, and specifically a lack of work on the properties of low pressure cold spray coatings. The low pressure process generates a coating that may be substantially more porous than the high pressure spray or bulk material, hence it is expected the corrosion properties may be significantly different. This research aims to investigate these properties through salt fog (ASTM B117) and electrochemical polarization testing (ASTM G5) of low pressure cold spray austenitic stainless steel coatings. Several different powders and heat treatments will be applied to investigate the changes in corrosion properties from these treatments.
2. Investigate the effects of heat treatment on the microstructure and characteristics of cold sprayed austenitic stainless steel coatings. Previous work has demonstrated successful deposition of austenitic stainless steel coatings on stainless steel substrates using both high and low pressure cold spray techniques [3–4, 7, 15–17]. The optimal cold spray parameters for use of certain powders with a low pressure cold spray machine have also been determined and the microstructure of these powders and the resulting coatings have been characterized [3]. There has been work conducted on the microstructure and property changes in austenitic stainless steel coatings applied with the high pressure cold spray technique, however, there is a lack of investigation into the effects of annealing heat treatment on the coating microstructure and properties when a low pressure technique is used to apply the material. This research will aim to reproduce the previously reported successful low pressure austenitic stainless steel cold spray deposits and will attempt to fully characterize the microstructural changes to the coating resulting from annealing heat treatments.
9
II.
COLD SPRAY OF AUSTENITIC STAINLESS STEEL
A. INTRODUCTION
Previous work on the application of austenitic stainless steel coatings was conducted at NPS by Schiel in 2014. In this work, he used 4 austenitic stainless steel powders; one of a nominal 304L stainless steel, one 316 and two 316L. These powders are Centerline “S5001” (SS304L) and “S5002” (SS316L), Inovati KM316 (SS316) and Plasma Giken PG-AMP-10 (SS316L). The manufacturer’s nominal compositions for these powders are given in Table 1. Schiel also characterized the powders using a variety of experimental methods. A summary of his results is shown in Tables 2 and 3 [3]. Analysis of the particle size distribution in the powders found that the 5001 and KM316 powders have a unimodal symmetric distribution of particle sizes while the 5002 and PG-AMP-10 powders have a distinct fraction of larger powder particles. All of the powders except the PG-AMP-10 also were found to have a relatively spherical particle shape; the PG-AMP-10 powder has a mix of irregular shapes [3]. The particle morphology is important in how well the particles are accelerated by the gas stream. A mix of smaller and larger particles is also expected to give lower porosity as the smaller particles more effectively fill the gaps between larger ones [3]. Within the individual power particles the grain size and phase distribution changes the mechanical properties of the material with a smaller grain size being associated with a harder material having lower ductility but greater strength [30]. All of the stainless steel alloys used here are typically almost entirely composed of the austenite phase with a very small amount of ferrite [27]. The properties of these two phases are significantly different, so a large amount of ferrite could result in bulk material properties that are different than expected for these types of stainless steels. Specifically, ferrite is known to be less corrosion resistant than austenite [31]. The grain orientation spread (GOS) is a measure of the plastic deformation experienced by a material. Typical annealed deformation-free crystalline materials can be expected to exhibit a GOS of 0.1–0.3° [32]. The higher values observed here suggest substantial plastic deformation of the particles [3].
Table 1. Commercial powder nominal composition summary. Adapted from: [3].
All elemental contributions are given in weight percent.
Table 2. Summary of commercial austenitic stainless steel powder size. Adapted from: [3].
Table 3. Summary of commercial austenitic stainless steel powder characteristics. Adapted from: [3].
Schiel also conducted characterization of sprayed coatings using the above four powders and helium working gas at 1.7 MPa and 230°C. His results are shown in Table 4 [3]. His results verify that a satisfactory low pressure cold spray coating can be achieved with this configuration. His characterization of the coatings indicates that a substantial amount of the ferrite seen in some of the original powder is retained in the coatings produced and the grain size in the coatings is reduced by roughly a factor of 10 to a submicron size in all four powders. The GOS values obtained show that a very high degree of plastic deformation is also present in the coating [3].
Powder Fe Cr Ni Mn Mo Si C
S5001 (304L) 68.4 19.0 10.9 1.0 ‐ 0.6 0.017
S5002 (316L) 65.5 17.2 13.0 1.5 2.2 0.5 0.014
KM 316 (316) 68.2 16.8 10.8 1.3 2.1 0.6 0.02
PG‐AMP‐10 (316L) 69.0 17.0 12.0 ‐ 2.0 ‐ ‐
Powder Mean Size (μm) D10 (μm) D90 (μm)
S5001 (304L) 19.9 12.5 28.4
S5002 (316L) 45.6 18.1 75.2
KM 316 (316) 17.2 6.7 25.5
PG‐AMP‐10 (316L) 61.3 14.3 164.8
Powder Mean Size (μm) % Ferrite (XRD) Crystallite Size (μm) Average GOS (°)
S5001 (304L) 19.9 ~0 2.7 1.8
S5002 (316L) 45.6 50 6.4 2.4
KM 316 (316) 17.2 23 4.1 2.4
11
Table 4. Summary of cold spray coating characteristics for four commercial austenitic stainless steel powders. Adapted from [3].
Sprayed with helium gas at 230°C and 1.7 MPa. † denotes collection via X-Ray diffraction. * denotes the ferrite crystal GOS.
Additionally, Schiel conducted a systematic investigation into the optimal spray conditions for these powders. For this he used both N2 and helium carrier gas and
examined a number of gas pressure and temperature combinations to find those that gave the optimal coating deposition. Quantification of the coatings for this study was conducted by measurement of the deposition efficiency and the coating thickness, with the deposition efficiency being measured as the mass of the final coating divided by the mass of the powder sprayed. The coating mass was determined by measurement of the substrate before and after spraying with the powder mass likewise being the initial mass of powder loaded minus the mass removed from the system following spraying.
From this investigation, Schiel determined that the best conditions for deposition of all four of the stainless steel powders were with helium gas at 230°C and 1.7 MPa. These results are summarized in Table 5. Only the PG-AMP-10 powder was successfully deposited with N2 carrier gas and this was only achieved at one spray condition, 450°C
and 1.7 MPa. A 4.1% deposition efficiency and a 0.26 mm coating thickness was reported with these conditions. [3]
Powder Deposition Efficiency (%) Thickness per Pass (mm) % Ferrite (EBSD/XRD) Crystallite Size (μm) Average GOS (°) S5001 (304L) 11.8 0.67 1 0.22 2.3 S5002 (316L) 12.3 0.71 19/48† 0.38 1.7 KM 316 (316) 41.8 0.15 1 0.33 2.4 PG‐AMP‐10 (316L) 29.4 0.93 27/58† 0.33 2.2/1.3*
Table 5. Summary of cold spray stainless steel coatings achieved using helium carrier gas at 230°C and 1.7 MPa. Adapted from: [3].
B. REPRODUCTION OF PREVIOUS WORK
An initial goal of this research was to verify the results reported by Schiel and to ensure a reproducible quality coating could be produced for use in further work. Additionally, some further investigation was conducted into the effects of an increased standoff distance. Schiel developed a mathematical model of the fluid dynamics of the spray jet, which suggests that an increase in standoff distance from the 16 mm used in his optimization work to 40 mm should result in an increase in the average particle velocity [3]. As the particle velocity is the primary controlling factor in the successful deposition of the coating, this result suggests that better coating results should be obtained at an increased standoff distance. Schiel briefly investigates this effect with one powder and reports finding no change in the deposition efficiency or coating thickness, but some evidence of improved coating quality in the form of reduced porosity. This result was investigated further, and some additional testing was conducted using other powders with N2 carrier gas. Schiel had tested a number of N2 spray conditions and reported negligible
deposition in all but one case, however it was deemed possible that the increase in particle velocity from the increase in standoff distance could be enough to have a sufficient number of particles now exceed the critical velocity and hence achieve a measurable coating.
A number of test sprays were conducted, using both N2 and helium gas in both
cases using a 1.7 MPa gas pressure and temperature of 230°C with helium and 450°C
Test No. 1 2 3 4
Powder Material S5001 S5002 KM316 PG‐AMP‐10
Working Gas Helium Helium Helium Helium
Substrate Material Grey Cast Iron Grey Cast Iron Grey Cast Iron Grey Cast Iron
Gas Temperature (°C) 230 230 230 230
Gas Pressure (MPa) 1.7 1.7 1.7 1.7
Powder Feed Rate (g/min) 60.4 54.8 2.4 19.6
Deposition Efficiency (%) 11.8 12.3 41.8 29.4
13
sprays using a 16 mm standoff distance vs 40. In all cases 316 stainless steel substrates were used. Substrates were grit blasted using Centerline G0002 grit with machine parameters as listed in Table 7 and were cleaned with ethanol prior to coating deposition. A summary of the coatings produced is shown in Table 6.
Table 6. Summary of deposition efficiency and coating thickness per pass for replication of previous work and testing the effect of increased standoff
distance.
Deposition efficiency not measured in samples marked by ‘-‘
Overall the results achieved agree reasonably well with those reported by Schiel. Even with the increased standoff distance no measurable coating was achieved with N2
and the 5001 or 5002 powders. The PG-AMP-10 powder was observed to form a measureable coating, but with lower deposition efficiency than reported by Schiel. This may be a measurement error. Deposition efficiency was not accurately measured in several other samples as well. Some variation was noted in the coating thickness. In part this is due to a difference in measurement method; Schiel measured the thickest portion of the coating which typically occurs at the ends of the coated area where the cold spray system would dwell for a sort time while the control moved to the next program step. This region would be significantly thicker than the majority of the coating. For this work, the average bulk thickness of the coating was measured as this is the critical dimension for practical application. It was also determined that the coating thickness produced is highly dependent on the actual powder feed rate which cannot be accurately controlled.
Powder Working Gas Standoff Distance (mm) Deposition Efficency Coating Thickness per pass (mm) N2 40 0.0% 0.00 He 40 12.4% 0.33 N2 40 0.0% 0.00 16 ‐ 0.39 40 ‐ 0.32 N2 40 0.5% 0.06 16 27.2% 0.36 40 28.0% 0.80 5002 PG‐AMP‐10 He He 5001
The cold spray system used has a nominal feed rate setting, however the actual powder feed rate is also highly dependent on the material level in the feeder and is thus difficult to consistently and accurately set. Schiel’s modeling shows that the powder velocity distribution and thus the overall coating quality is not greatly affected by the feed rate; hence the variation in effective powder feed rate due to this inconsistency in feed rate results solely in a variation of coating thickness and not a notable variation in coating quality.
Sections were taken of these samples and polished for optical microscopy. Polishing was conducted on an automatic polishing machine using grinding paper through 1200 (P4000) grit followed by polishing through 0.05 μ alumina on a cloth wheel. Optical Microscopy was conducted to inspect the coating porosity both within the coating and at the coating/substrate interface. This examination showed a generally consistent dense coating in agreement with Schiel’s reported results. Typical micrographs are shown in Figures 4–6.
15
Figure 4. Low magnification optical micrographs of coatings sprayed with helium gas at 1.7 MPa and 230°C; 40 mm standoff distance. (a) 5001; (b)
Figure 5. High magnification optical micrographs of coating sprayed with helium gas at 1.7 MPa and 230°C; 40 mm standoff distance. (a) 5001; (b)
17
Figure 6. Typical micrographs of PG-AMP-10 powder sprayed with N2 gas at
1.7 MPa and 450°C showing improved coating quality (decreased porosity) at 40 mm standoff distance. 16 mm standoff (top); 40 mm distance
(bottom)
When using helium working gas, no significant differences were found between 16 mm and 40 mm working distances either in coating thickness or quality. There was a measurable difference in thickness as seen in Table 6, however thicknesses were sufficiently inconsistent across all samples that this difference is inconclusive. The coating quality was observed to be consistent across all samples, and generally matches that reported by Schiel. The PG-AMP-10 and 5002 coatings were observed to have qualitatively greater porosity than the 5001. Both still showed high density within the coating however. Notably, Schiel reports evidence of decreased coating/substrate boundary porosity when the standoff distance was increased but this effect was not seen
in this work. PG-AMP-10 samples sprayed with N2 working gas did show an
improvement in coating quality with an increase in standoff distance from 16 to 40 mm as seen in Figure 6. The coating produced at a 40 mm standoff distance shows qualitatively lower porosity within the coating, though with no change in the coating/substrate interface porosity.
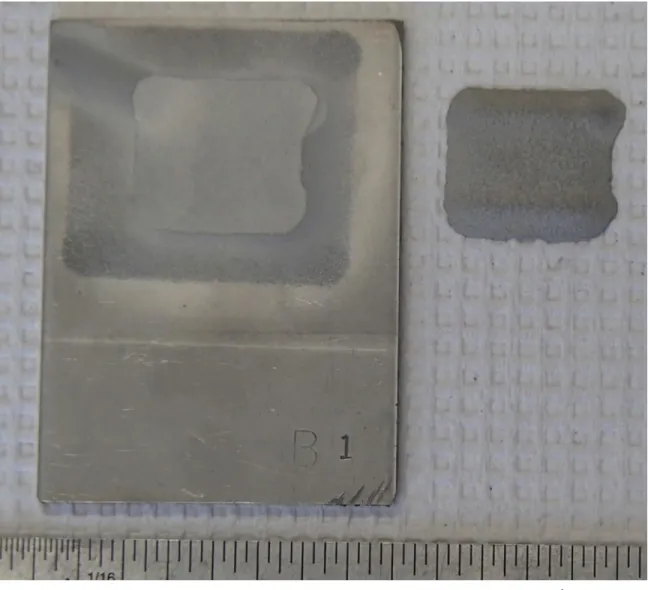
In several instances the spraying of an additional layer on a previously well adhered coating was observed to result in the entire coating detaching from the substrate. An example of this phenomena is shown in Figure 7. The sample illustrated is using the 5001 powder with helium gas, however complete detachment was also observed with PG-AMP-10 powder and N2 gas on the 4th pass. Additionally, multiple other samples
exhibited partial detachment where the coating was only attached on one side of the deposit. Partial detachment was observed in samples of all 3 powders. Schiel also reports observing a similar phenomenon during some of his N2 test sprays. No systematic
investigation was conducted, however the general trend observed is that this is primarily associated with a thicker multiple pass coating. The detachment of the coating consistently happened during the spraying operation and no external mechanical force was involved—the coating detachment occurs solely as a result of stresses resulting from the particle impact or thermal effects.
19
Figure 7. Coating detachment phenomena observed during spaying of 3rd pass with 5001 powder. He gas, 1.7 MPa at 230°C
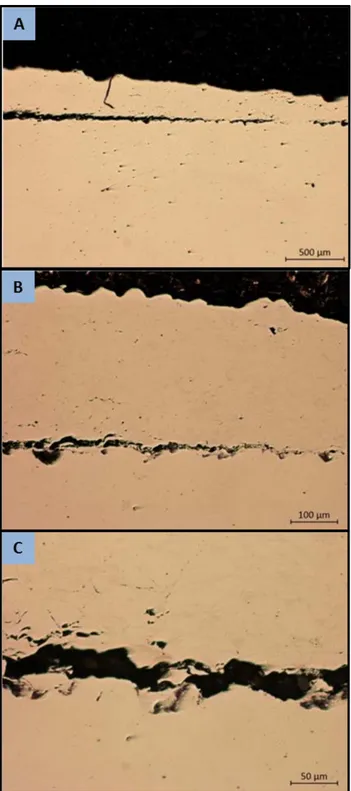
Examination of micrographs of other samples shows evidence of the mechanism that leads to this detachment. Almost all samples observed showed some degree of porosity at the coating/substrate boundary, but in several samples sections up to several mm in length were seen where the coating was detached from the substrate within an otherwise well adhered coating. This is shown in figure 8. Close inspection of the surfaces in these regions reveals a surface morphology in the coating that closely matches that of the substrate surface, suggesting that the coating was previously adhered to the substrate in these regions and was subsequently pulled up off of the substrate by some force. The gross coating detachment observed may the result of this small scale
detachment occurring over a large area and resulting in the entire coatings being completely detached from the substrate. The evidence of a force pulling the coating off the substrate suggests that the ultimate cause is a tensile stress in the coating at the substrate/coating boundary. Work conducted on residual stress in cold spray coatings [33, 34] shows that compressive residual stress is found in the coating surface, and a tensile residual stress is common at the coating/substrate boundary; however the magnitude of this stress appears to be dependent on the exact spray parameters used and the substrate/coating material. Notably, results reported in the available literature focus on aluminum and copper coating with no data available on stainless steel coatings. Further investigation is warranted to measure the residual stress in low pressure cold spray stainless steel coatings and determine mitigation measures to prevent the coating detachment problem observed. This problem would prevent the application of a reliable high quality coating and hence makes practical application of the process very difficult. Residual stress studies could show if the ultimate problem is high residual stress in the coating or low bond strength. If the problem lies in a high residual stress then it is possible that a stress relief heat treatment between coating passes could alleviate this problem.
21
Figure 8. Coating detachment phenomena observed in 5002 powder sprayed with helium gas at 1.7 MPa, 230°C. Increasing magnification (a) to (c).
C. SAMPLE PREPARATION FOR CURRENT WORK
Centerline “S5001” and “S5002” along with Plasma Giken “PG-AMP-10” powders were used for all further investigation work. These powders will henceforth be referred to as “5001”, “5002” and “PG-AMP-10”. All substrate coupons used were commercially available cold rolled unpolished 316 stainless steel strip with nominal dimensions of 76.2 x 50.8 x 3.18 mm (3 x 2 x 1/8″) Coupons were cut from lengths of 50.8 x 3.18 mm (2 x 1/8″) strip using either abrasive or bandsaw cutting. All low pressure cold spray deposits were made using a Centerline (Windsor) Limited SST Model P low pressure cold spray deposition system located at NPS and operating under automatic control. Coupons were grit blasted using Centerline SST-G0002 grit media. This is a 80 grit alumina blasting grit supplied specifically for cold spray substrate preparation with a nominal particle size of 100–300 μm. Machine settings used for grit blasting are shown in Table 7. Substrates were cleaned after grit blasting using ethanol and allowed to air dry prior to coating deposition. Coating deposition was conducted using the machine settings shown in Table 8. Multiple passes were used as needed to give the desired thickness for the testing in question.
Table 7. Cold spray machine settings used to grit blast coupons prior to coating deposition.
Blasting Media SST‐G0002
Gas Nitrogen
Gun Type Automatic
Nozzle WC
Gas Temperature (°C) 125
Gas Pressure (MPa) 1.0 (150)
Nominal Powder Feed Rate (%) 15
Gun Stand‐off Distance (mm) 15
Gun Traverse Speed (mm/s) 50
23
Table 8. Cold spray machine settings used for coating preparation.
Heat treatments were conducted in a Lincoln “Blue M” radiant type electrically fired furnace fitted with automatic temperature control. The furnace was preheated to the specified temperature prior to samples being inserted, and the treatment time was started upon the insertion of samples into the preheated furnace. The furnace atmosphere was air with no special treatment. Samples were removed from the furnace and allowed to cool in still air. Three heat treatment procedures were used: 600°C for 8 hours (henceforth referenced as “600°C/8 hrs”), 800°C for 2 hours (henceforth referenced as “800°C/2 hrs”), and 950°C for 1 hour (henceforth referenced as “950°C/1 hr”).
Powder 5001, 5002, PG‐AMP‐10
Gas Helium
Gun Type Automatic
Nozzle WC
Gas Temperature (°C) 230
Gas Pressure (MPa) 1.7(250)
Nominal Powder Feed Rate (%) 40
Gun Stand‐off Distance (mm) 40
Gun Traverse Speed (mm/s) 40
25
III.
EFFECT OF HEAT TREATMENT ON SPRAYED COATINGS
A. INTRODUCTION
Heat treatment is a well-known and commonly used processing technique to change the properties of the material [30]. By heating the material to a temperature below its melting point various processes are either activated or accelerated at the microscopic level resulting in changes to the microstructure and hence the macroscopic material properties. This type of treatment typically consists of a relatively rapid heating of the material to a specified temperature followed by a certain time held at that temperature and a relatively rapid cooling and is commonly known as annealing. Most of the microscopic processes occurring during this treatment occur as a result of diffusion and follow a Arrhenius form rate equation:
(1) Here “A” is a pre-exponential term characteristic of the process, “R” is the universal gas constant, “T” is the absolute temperature and “E” is an activation energy associated with the process. In a process of this type there is an activation energy “E required for the process to occur and an exponential dependence of the process rate on the temperature. From a practical point of view, this means that the process will not occur at a practically useful rate below a specific temperature and will exponentially accelerate in rate with increasing material temperature.
Three stages of annealing are generally defined: recovery, recrystallization and grain growth [30]. Recovery occurs at the lowest temperature of the three and does not typically effect the overall grain structure but does decrease residual stresses through the movement and in some cases annihilation of dislocations within the crystal structure. This treatment typically has little visible macroscopic effect but does improve electrical conductivity and in some cases corrosion resistance.
The next stage of heat treatment is recrystallization. A definitive boundary temperature is difficult to define and changes depending on the degree of cold work of the material but is generally given as 0.4 times the absolute melting temperature (Tm).
The melting temperature of the 3xx stainless steel is approximately 1650K, so recrystallization in this material should occur at around 375°C. Above this temperature diffusion occurs rapidly enough to allow atomic diffusion sufficient for a new unstrained grain structure to nucleate and begin to grow in highly deformed regions. The diffusion rate is still low enough that these new grains remain relatively small and a certain amount of the original grain structure remains. Because the new grains tend to form at high stress regions (i.e., where there are a high concentration of dislocations), this process tends to greatly reduce the number of dislocations in the material and hence result in increased ductility and decreased tensile strength in the material.
At higher annealing temperatures, the diffusion rate becomes even higher and rather than numerous small grains formed during recrystallization, smaller numbers of strain-free nuclei grow rapidly due to the increased diffusion controlled growth rate resulting in a relatively small number of individually large grains. These large grains result in a material with very high ductility and low strength [30].
Several researchers have investigated annealing treatments of austenitic stainless steel cold spray coatings [35–37]. X. M. Meng et al. investigated the effects of annealing at 950°C for 2 hours on 304 stainless steel coatings and found evidence of full recrystallization, a substantial decrease in coating porosity and coating ductility/hardness values equivalent to those of annealed bulk 304 stainless steel [35]. Xian-Ming Meng et al. performed similar annealing treatments on cold sprayed 304 stainless steel coatings using temperatures of 300°C, 600°C, 800°C and 950°C [36]. Sundararajan et al. performed work on cold spray 316L stainless steel coatings using heat treatments at 400°C, 800°C and 1100°C reporting reduced porosity and improved bonding and mechanical properties [37]. Notably, these investigations have all been on coatings produced by the high-pressure cold spray process.
In the as-sprayed condition cold spray coatings are known to have a very high amount of plastic deformation and thus high strength but very low ductility with properties substantially different than bulk stainless steel [34]. In many application this
27
to improve the properties of the coating and more closely match the coating properties to the substrate.
B. EXPERIMENTAL METHODS
Samples were prepared as described in (II.C). A nominal 12.5 x 19 mm (1/2 x 3/4″) deposit was used with two passes being used on 5001 and 5002 samples and one on the PG-AMP-10 samples. Two samples of each powder were prepared, with the average coating thickness being 0.66 mm (0.026″) for the 5001 powder, 0.47 mm (0.018″) for the 5002 powder and 0.91 mm (0.036″) for the PG-AMP-10 powder. Each of the samples was then cut down the long axis of the substrate roughly at the center of the deposit to give two roughly identical size samples with a roughly 12.5 x 9.5 mm (1/2″ x 3/8″) deposit from each original substrate, for a total of four samples of each powder.
Following heat treatment the samples were cut to give specimens for examination using a Struers metallurgical saw. A transverse cross section and coating surface sample was prepared for microscopy, as well as a surface sample for X-ray diffraction studies. The transverse cross section samples were used for microhardness measurements following the completion of microscopy examination. X-ray diffraction samples were polished through a 1200 (P2500) grit grinding paper using a Buhler automatic polishing machine. Microscopy samples were polished through 1200 (P2500) grit grinding paper and further polished through 0.05 µm alumina powder using polishing cloths on an automatic Buhler polishing machine. Final polishing was initially conducted using 0.05 µm colloidal silica in a vibrator polishing machine however this was determined to be insufficient for reliable EBSD mapping and electro polishing was instead used with a 10% perchloric acid/ethanol electrolyte at -40°C with a 20V potential and 30 second polishing time.
Microstructural characterization of samples was performed using a number of techniques. Optical microscopy was performed using a Nikon Epiphot 200 metallographic microscope equipped with Nikon ‘NIS Elements’ image capture software. Magnifications of 100x and 200x were used. Optical images were used primarily to characterize large-scale porosity in the coating. Electron microscopy was performed
using a Zeiss Neon 40 scanning electron microscope (SEM) using both secondary electron and backscatter electron imaging modes. Magnifications of 1.5KX and 3KX were used to quantify microscopic porosity and overall microstructure. Energy dispersion spectroscopy (EDS) was used to identify the elemental composition and distribution in the samples. Overall sample composition was measured at a magnification of 300x and EDS mapping was conducted at a magnification of 500X and 1.5KX. In addition to iron, nickel, chromium, silicon and molybdenum concentrations and distribution were measured. Trace elements were not measured. Electron backscatter diffraction mapping (EBSD) was conducted to determine the phase distribution, grain size and grain orientation mismatch. In all cases a 20kv accelerating voltage was used, with a 30 μm aperture for secondary electron imaging and 60 μm with high current used for EBSD and EDS work. EBSD mapping was performed at a magnification of roughly 900X to give a scan size of roughly 85 x 300 μm. X-ray diffraction (XRD) measurements were conducted on a Rigaku MiniFlex 600 instrument with a high speed position sensitive detector using Cu Kα1 radiation using 40 kv excitation voltage and 15 ma filament
current. A scan of 2ϴ angles from 40°-100° was used with a 0.02° step and a 10° per minute scan rate.
Hardness testing was conducted using a Struers DuraScan-50 microhardness testing machine. A Vickers type indenter was used with a 0.9807 N load (HV 0.1 scale). The load was applied and maintained for 15 seconds. A minimum of 25 individual points were used in each test with a 0.1 mm spacing between points. Individual test points were inspected and any that coincided with large scale porosity were rejected.
C. RESULTS AND DISCUSSION
Examination of the coating microstructure at low magnification shows that all three powders produce a qualitatively dense coating with relatively low porosity as shown in Figure 9. Qualitatively the different powders produce similar amounts of porosity but with a different spatial distribution. The 5002 and 5001 powders tend to have long thin regions while the PG-AMP-10 tends to shows a greater number of smaller
29
5001 and 5002 powders have a spherical morphology with generally consistent size while the PG-AMP-10 has a bimodal size distribution and a much more irregular particle shape [3].
Figure 9. High magnification optical micrographs of as-sprayed coatings showing qualitatively dense coating structure with limited porosity. (a)
In the cold spray process a very high degree of deformation occurs during the particle adhesion process resulting in a highly stressed microstructure with very small grains [22]. Rapid recrystallization and recovery can thus be expected during annealing. All three of the heat treatments used in this work are above the generally accepted recrystallization temperature of 0.4Tm so evidence of recrystallization can be expected in
all heat treatments. For reference, 600°C is 0.53Tm, 800°C is 0.65Tm and 950°C is
0.74Tm.
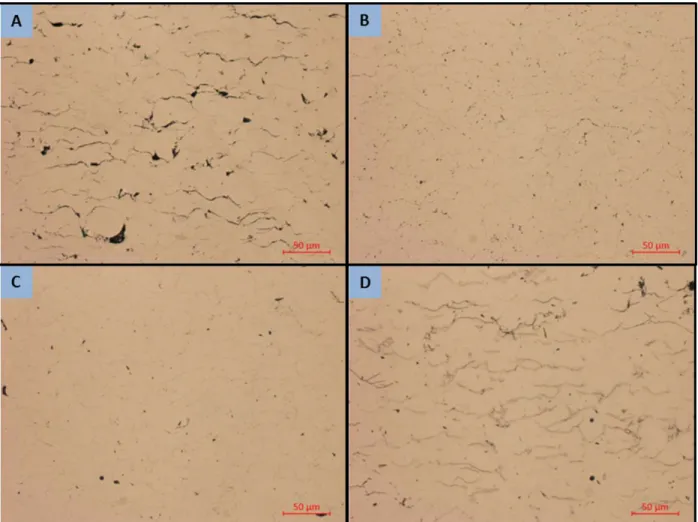
The most visible change resulting from heat treatment is in the sample porosity. The lowest energy state is a complete absence of porosity, so the trend is expected to be towards reduced porosity as diffusion rates increase with temperature. Since the complete elimination of porosity would require substantial large scale diffusion this is not likely. As an intermediate lower energy state, the consolidation of numerous smaller porous regions in single larger areas and the conversion of long thin regions to one or more spherical regions can be expected. This behavior is seen in the 5001 samples as seen in Figures 10 and 11. The lower temperature heat treatment shows a structure similar to the as-sprayed sample but in both the higher temperature samples the long thin regions of inter-splat porosity are seen to have consolidated into circular regions. With longer or higher temperature treatment, these would be expected to consolidate further to individually larger but less numerous regions. Similar results are seen in the 5002 and PG-AMP-10 powders as shown in Figures 12 and 13.
31
Figure 10. High magnification optical micrographs showing changes in porosity with heat treatment. 5001 powder. (a) as sprayed; (b) 950°/1hr; (c) 800°C/2hrs; (d) 600°C/8 hrs.
Figure 11. Backscatter electron images of 5001 powder samples showing porosity reduction following heat treatment. (a) as sprayed; (b) 950°/1hr; (c) 800°C/2hrs; (d) 600°C/8 hrs.
33
Figure 12. Backscatter electron images of 5002 powder samples showing porosity reduction following heat treatment. (a) as sprayed; (b) 950°/1hr; (c) 800°C/2hrs; (d) 600°C/8 hrs.
Figure 13. Backscatter electron images of PG-AMP-10 powder samples showing porosity reduction following heat treatment. (a) as sprayed; (b) 950°/1hr; (c) 800°C/2hrs; (d) 600°C/8 hrs.