DISCUSSION PAPERS IN ECONOMICS
Working Paper No. 13-05
Tax Evasion and Subsidy Pass-Through under the Solar
Investment Tax Credit
Molly Podolefsky
University of Colorado at Boulder
November 2013
Department of Economics
University of Colorado at Boulder
Boulder, Colorado 80309
Tax Evasion and Subsidy Pass-Through under the Solar Investment
Tax Credit
Molly Podolefsky†∗
November 11, 2013
Abstract
Over $1.5 billion has been awarded under the federal Solar Investment Tax Credit (ITC), the largest solar incentive program in the US, though little is known about who benefits under the program. This paper examines possible tax evasion by PV firms under the ITC, and incidence of the subsidy in terms of pass-through to firms. I investigate differences in per unit price between third party and customer owned systems reported by firms operating simultaneously in both markets to reveal the degree of potential price misreporting. Over-reporting price allows firms to reap larger tax credits. I find the prices firms report for third party systems exceed prices of customer owned systems by 10%, or $3,900 per system. My findings imply that third party PV firms in California were awarded $25 million in excess ITC tax benefits due to price over-reporting between 2007 and 2011. I estimate the incidence of the subsidy using a change in ITC benefits due to a cap-lift in 2009, which increased the mean award by $10,000. I find that 83% of ITC benefits accrue to firms, with only a small portion realized by consumers.
∗
The author thanks Jonathan Hughes, Chrystie Burr, Kelsey Jack, Joe Craig, Austin Smith, Dustin Frye, Daniel Steinberg of NREL and seminar participants at the 2013 Front Range Energy Camp. Jean Agras of Ventyx and Thomas Dickinson at CU Boulder generously provided geographic and Census data. James Loewen of the CPUC Energy Division provided data assistance and Dan Yechout of Namaste Solar provided industry insights.
†
1
Introduction
The federal Solar Investment Tax Credit (ITC) is a nation-wide, multi-billion dollar incentive pro-gram to encourage PV adoption. While tax break subsidies play an important role in incentivizing green technologies, little is known about the incidence of, and inefficiencies that may exist under, these policies. The third party model has increasingly become the norm in the solar market over the past five years, and other green energy markets may follow. In light of the growing importance of third party markets, it is especially important to understand the interaction between third party markets and green technology subsidies.
Non-transparent reporting mechanisms and a lax enforcement regime make the ITC an ideal vehicle for tax evasion by third party PV firms. Lacking a transacted system price, third party firms generate system prices to report under the ITC which are intended to capture the fair market value of systems. Given that ITC awards are increasing in reported price, third party firms have both the opportunity and incentive to cheat by over-reporting prices. My empirical analysis of price misreporting is based on observation of several large firms simultaneously operating in both the customer owned and third party markets over time. A detailed California Solar Initiative dataset allows me to observe the make and model of solar modules being installed within firm, across market types over time. I exploit within firm, within module pricing variation to estimate a fixed effects model of third party price misreporting. I also estimate this pricing differential using propensity score matching, which provides the advantage of an improved counterfactual. I find that on average third party PV firms over-report prices by 10%, translating to $3,900 per system in excess ITC benefits.
My results suggest that cheating is not uniform across third party firms, though most price over-reporting appears due to a few large firms. While some major third party firms over-report prices by as much as 28%, others exhibit no price premium for third party systems. I estimate that in aggregate third party PV firms in California have misreported some $83 million in taxable assets resulting in $25 million in tax benefits earned under the ITC due to price misreporting between 2007 and 2011. Using an event study centered around 2012 when several large firms were issued federal subpoenas on suspicion of tax evasion through price over-reporting, I find that firms appear to have responded to the increased threat of punishment by ceasing to over-report prices.
In addition, I examine the incidence of the ITC subsidy in the customer owned systems market. On January 1, 2009 the $2,000 cap on ITC awards was lifted, increasing the mean award by over $10,000. I exploit this source of exogenous variation to estimate a difference-in-differences
model of subsidy incidence under the ITC. I estimate the degree of pass-through of the subsidy from consumers to firms in the form of higher prices by comparing prices on customer owned systems pre and post cap-lift. I find a pass-through rate of 83% from consumers to firms in this market, suggesting that the vast majority of ITC benefits are actually realized by firms, rather than consumers.
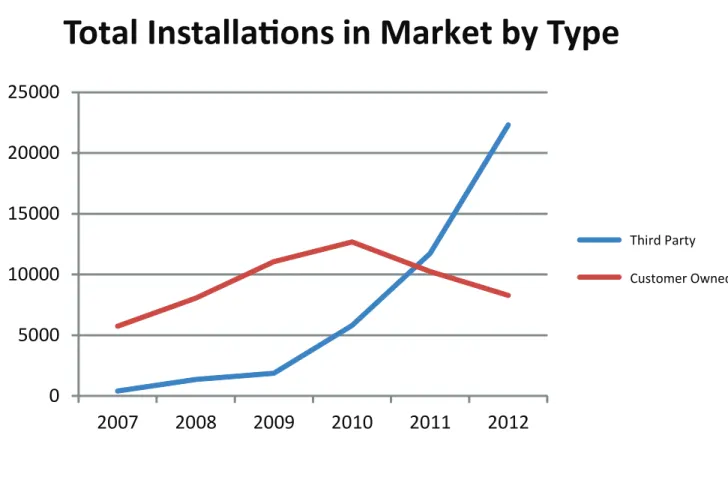
Nationwide, billions of dollars have been spent incentivizing uptake of green technologies through tax break subsidies. Meanwhile, third party is becoming the model of choice in the PV industry, and could become a model for other green technology markets. From 7% of California’s residential PV market in 2007, third party systems quickly eclipsed customer owned systems, capturing over 70% of the market by 2012 (see Fig’s 1 & 2)1. Therefore, understanding the interaction between the third party market and the efficient design and implementation of tax subsidies has important policy implications. Moreover, this paper contributes to a better understanding of the incidence of green technology subsidies. To the best of my knowledge, this paper is the first to investigate tax evasion under the ITC and pass-through of the subsidy from consumers to firms.
The ITC was originally implemented in 2005 as a demand side incentive to encourage PV adoption by providing consumers with tax benefits based on transacted system price. In the rare case of a third party transaction, firms were asked to generate plausible “prices” to report which were intended to capture the system’s fair market value. As the market transitioned to predominantly third party, the ITC became largely a supply side subsidy and the reporting mechanism remained unchanged, presenting third party firms with the opportunity to exploit larger tax benefits by mis-reporting system prices. The results of this study suggest the need to carefully consider other green technologies which have the potential to become third party markets, and to anticipate the potential consequences for incentive mechanisms.
Due to legislative and regulatory challenges surrounding third party PV financing, only a hand-ful of states allow third party PV, and fewer still have mature markets. California presents an ideal setting in which to analyze the behavior of third party PV firms because this model is legal and encouraged in California’s three large Investor Owned Utilities (IOU’s), SCE, PG&E and SDG&E, serving more than three quarters of the state’s population of 38 million. Moreover, the California Solar Initiative (CSI), a multimillion dollar agency dedicated to incentivizing PV adoption, keeps detailed records of all customer owned and third party PV installations in the state which have recieved the CSI subsidy. Several of California’s largest PV firms operate simultaneously in the third party and customer owned PV markets, providing invaluable within firm pricing variation
1Third party describes systems which are leased or held under a power purchase agreement (PPA) by households
between markets.
This paper contributes directly to the economic literature on illicit behavior and tax evasion. To the best of our knowledge, this study is the first to rigorously examine possible tax evasion in the third party PV market, and compliments a well-established tax evasion literature (Allingham and Sandmo (1972); Slemrod, Blumenthal, and Christian (2001); Cowell (2004); Slemrod (2004);). Most literature in this area explores how firms and individuals avoid paying taxes by under-reporting income or purchases. Fisman and Wei (2001) investigates tax evasion through under-reporting of Chinese imports, while Marion and Muehlegger (2008) explore tax evasion in the diesel fuel market by firms mis-reporting the use of non-taxed diesel fuels for on-road transportation purposes. Mer-riman (2010) investigates how consumers avoid cigarette taxes by purchasing packs in neighboring cities with lower tax rates. While these papers investigate firms or individuals directly avoiding or evading taxes by misreporting income or purchases, this paper investigates the inverse case of firms exploiting tax benefits by over-reporting prices. This paper also contributes to the understanding of the function of reporting and enforcement regimes in the manifestation of tax evasion. Specifically, the event study in this paper illuminates how strengthening enforcement may convince firms to stop evading. This study also contributes to a growing literature based on empirical analysis of data to identify evidence of criminal and illegal activity (Hsieh and Moretti (2006); Levitt (2012)). More specifically, this paper contributes to a recent literature examining the PV industry from the perspective of energy and environmental economics and public policy. To date, most academic economic studies of the PV industry either examine the effectiveness of demand side policy (Hughes and Podolefsky (2013), Burr (2013)), learning by doing Van Benthem, Gillingham, and Sweeney (2008) and peer effects on PV adoption Bollinger and Gillingham (2012), or present social cost-benefit analysis of PV policy Borenstien (2008). Borenstein (2007) also investigates the interaction of time-of-use electricity rates and PV subsidies. In contrast to previous studies, this paper focuses on efficiency and distribution. This study explores the consequences of transforming a demand side subsidy to a supply side subsidy, and investigates inefficiencies of solar tax incentives due to tax evasion and low pass-through rates to consumers.
A well established literature investigates tax-incidence, through symmetry and how pass-through to consumers and firms varies according to market type, institutions, time horizons and demand structure (Seade (1985); Kotlikoff and Summers (1987); Karp and Perloff (1989); Anderson, De Palma, and Kreider (2001); Fullerton and Metcalf (2002); Cox, Rider, and Sen (2012)). The literature on the incidence of subsidies is sparser, particularly in terms of green technology subsidies. Kirwan (2009) investigates the pass-through of agricultural subsidies from farmers of rented land to land ownders. Saitone and Sexton (2010) explore how market power contributes to incomplete
subsidy pass-through to farmers in the ethanol market.To the best of my knowledge, this study is the first to provide evidence of low rates of pass-through to consumers under green technology tax subsidies.
2
Institutional Background
2.1 Third Party PV
Third party is a term used to describe PV systems that are installed on a customer’s rooftop and either leased or held under a power purchase agreement (PPA) rather than being purchased outright in the customer owned market. In the case of a lease, the consumer makes monthly payments on the PV equipment to a third party firm, and owns the electrical output of the sytsem. In a PPA, the third party firm owns the electricity generated by the system, and the consumer makes monthly payment in exchange for the electricity. The main difference from the firm’s perspective is that a PPA allows any excess electricity generated by the system to be fed back into the grid, generating revenue for the firm, versus in the case of a solar lease this revenue accrues to the lessee.
The consumer benefits in several ways from holding a third party system rather than purchasing a system outright. The most salient benefit is that third party arrangements largely or entirely eliminate the upfront cost of purchasing a system. Between 2007 and 2012, per watt installed PV prices for all residential installations in the study area, third party and non, declined steadily from a mean price of $8.13 per watt in 2007 to $5.46 per watt in 2012. Despite falling prices, large upfront costs remain one of the largest obstacles to PV adoption. Third party arrangements also relieve consumers of the costs of ongoing maintenance and the uncertainties associated with the possibility of future system failures.2 From the consumer’s perspective the lease and PPA are fairly equivalent. Both generally entail a 20 year escalating price contract, in both cases all tax and subsidy benefits accrue to the firm, and in either case the consumer typically has the option to purchase the 20-year-old system at the end of the contract at fair market value.
CSI does not differentiate between the two third party arrangements, leases and PPA’s, in its database. Fortunately there is little practical difference from the perspective of this study. This paper focuses on the incentive for firms to exaggerate the size of the taxable asset in order to maximize tax subsidy benefits, and this incentive is the same for either transaction type. As a result there is no need to distinguish between these arrangements in my study.
2
Though both types of arrangement generally include periodic system maintenance by the firm, the firm clearly has a stronger incentive to maintain the system in a PPA situation where the homeowner is buying the electricity generated by the rooftop system directly from the firm.
Third party PV has only had a significant market presence in California since 2007, when third party systems accounted for just 7% of the residential market. In that year a mere 400 third party residential systems were installed compared with nearly 6000 customer owned sales in California’s Investor Owned Utilities (IOU’s),3 a market encompassing 33 million customers. By 2012, total installations in this residential market totaled over 30,000, and third party installations had eclipsed traditional sales, now accounting for 73% of the market (see Fig. 2).4
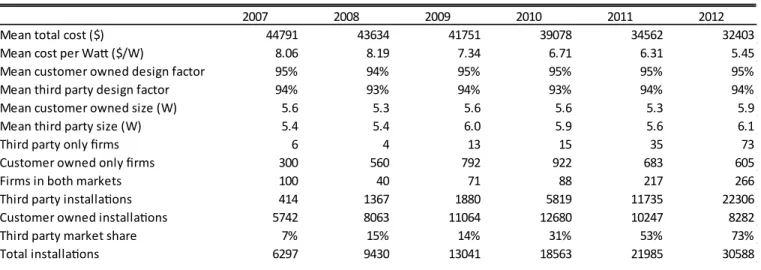
Several differences are apparent between the third party and customer owned markets (see Table 1). First, throughout this period, the mean third party installation is significantly larger than the mean customer owned installation, on the order of 6%. Second, the actual productivity of systems, as measured by the CSI designated design factor,5 is consistently higher for customer owned installations by 1 to 2 percentage points. The mean design factor for traditional installations 2008 and forward is 95%, while for third party system mean design factor vacillates between 93 and 94%. In other words, third party systems, on the average, are slightly less optimized for performance and significantly larger than purchased PV systems.
Though trends in California would suggest that the third party PV model may dominate in the future, the spread of third party PV has been significantly slowed by legal and regulatory challenges. Third party PV is currently available in only 10 states. The difficulty lies in the fact that different states and jurisdictions variously define third party PV owners as monopoly utilities, competitive service suppliers (in competition with utilities), or some combination thereof, thereby requiring regulation by the Public Utilities Commission (PUC). In addition to the challenge of regulation, some states do not allow net metering, presenting a further obstacle for the successful deployment of third party PV. Moreover, in states which have deregulated electricity markets, the utilities often maintain monopoly rights, and may forbid entry by third party PV firms outright.6
3
California’s IOU’s, Southern California Edison (SCE), Pacific Gas & Electric (PG&E) and San Diego Gas & Electric (SDG&E) serve over 33 million customers, or roughly 85% of the market. The remainder is served by Publicly Owned Utilities (POU’s) such as Sacramento Municipal Utility District (SMUD) and the Los Angeles Department of Water and Power (LADWP). IOU’s are for profit investor owned firms, while POU’s are not-for-profit firms governed by rate of return regulation and held by municipalities or other government agencies.
4
Unless otherwise stated, the market referred to throughout is the portion of the California market served by the three IOU’s, SCE, PG&E and SDG&E.
5
The design factor is a number between 0 and 2 describing the actual output of the system as a fraction of nameplate (the output listed in equipment specifications), due to factors specific to a particular installation including shading, tilt, geographic placement (angle of the sun), and various other factors. Design factor values in excess of 1 are rare but possible because the setup of a system can positively affect its output so that the realized output exceeds the nameplate value of the system. CSI’s full definition of design factor is given in the Appendix.
6
2.2 Tax Structure and Third Party PV Firm Profits
The solar Investment Tax Credit (ITC) is a key federal policy mechanism in support of accelerating uptake of green energy technologies. The ITC, also referred to as the Residential Renewable Energy Tax Credit, was established under the Energy Policy Act of 2005 and provides a tax break for installed PV systems worth 30% of system price.7 The tax credit has been extended to non-solar renewable energy sources such as geothermal and wind, though most deductions are claimed for solar. The credit is currently scheduled to expire December 31, 2016. The original cap at $2,000 was removed in 2009, so that benefits are now unlimited.8
At its inception in 2005 the ITC was designed and implemented as a demand side subsidy for PV adoption. At that time a tiny fraction (less than 5%) of the market consisted of third party transactions, and the majority of awards were made to consumers on the basis of the transacted price of PV systems purchased outright. In the case of third party installations, the award accrued to firms, who were entrusted with generating plausible prices for these systems reflecting fair market value, on the basis of which awards were made. Within a few years the market shifted radically towards the third party model, which today accounts for the vast majority of installations. This transformed the solar ITC program into mainly a supply side subsidy to third party firms. Failure to anticipate this shift in the market, and failure to revise reporting and award mechanisms in line with new market realities allowed for the emergence of tax evasion.
In order to claim ITC benefits, third party PV firms generate a price for each installation intended to capture the system’s fair market value and report this to the IRS. This price is not in any way based on the lease payments paid by the consumer. Since tax benefits are increasing in reported system cost, it would not be in the interest of the firm to report a price based on cost only. If the firm were to sell the system rather than lease it, the price, of course, would be weakly
7
The ITC is claimed in Section 48 of the Federal Tax Code, and so is sometimes referred to as the Section 48 credit. Because some firms cannot access the full value of all their ITC credits in the current year, firms are al-lowed an alternate form of the ITC, generally referred to as a Section 1603 grant. This alternative award process is administered by the US Treasury instead of the IRS, and rather than receiving a tax credit, the firm receives the money directly as a grant disbursed by the Treasury. The review process is largely the same, regardless of which option the firm chooses, and the liability for audit by the IRS is identical between these two mechanisms. For clarity of exposition, I will refer to both throughout the paper as the ITC, despite the more complex real-ity that firms have two different options for receiving the credit. Further clarification of these two options can be found in ”Evaluating Cost Basis for Solar Photovoltaic Properties,” Office of the Fiscal Assistant Secretary, US Treasury, available at: http://www.treasury.gov/initiatives/recovery/Documents/N%20Evaluating Cost Basis for Solar PV Properties%20final.pdf and in ”Cost Basis for the ITC and 1603 Applications,” publication of the Solar Energy Industries Association (SEIA) , available at: http://www.seia.org/research-resources/cost-basis-itc-1603-applications
8DSIRE, the Database of State Incentives for Renewables & Efficiency, offers a summary of the ITC and its history
greater than cost—hence the true installation cost is a lower bound on the reported price. On the other hand, since the homeowner does not purchase the system for a set price, but rather leases the system (or purchases the power generated by the system) for a monthly fee, determining the upper bound on reported price is not straightforward. Especially in the case of large third party PV firms which design and build their own systems, derivation of the final price is obscured by the many layers of engineering, procurement and construction.9
The US Treasury provides limited guidance in this matter by periodically publishing its Fair Market Value Assessment (FMVA), which loosely regulates the eligible cost basis10 for different categories of property. In the case of PV, the most recent FMVA, published in 2011, generously sets the eligible cost basis for residential PV systems under 10 kw at $7 per watt, whereas $5 per watt is the market mean. The firm typically supports its reported price by submitting a cost workup for each project, including hard costs, soft costs and profit11. A generally agreed upon profit markup is considered to be 10-20% of cost. Even if a firm’s claimed cost basis is below the $7 per watt benchmark and it’s profit markup is below 20%, the Treasury and IRS have discretionary powers to deny or reduce the claim.12
In deciding whether and how much to cheat, firms consider the likelihood of detection and severity of potential punishements. Enforcement of compliance with appropriate cost basis report-ing has been neither frequent nor uniform. Because price depends on so many factors specific to each installation, some claims below the $7 per watt benchmark have been questioned or denied, while other claims above this benchmark have been accepted. Moreover, the IRS has the ability to audit claims years after the initial taxes are finalized. Even in the case of enforcement, penalties are assessed on a case by case basis by the IRS, making it difficult for firms to accurately gauge the consequences of large-scale non-compliance. Most importantly, no firms prior to the issue of federal subpoenas in 2011 had ever been investigated or charged for inappropriate price reporting. This may have left firms with the impression that enforcement was lax and expected penalties low. Non-transparent reporting and lax enforcement invite cheating by firms.
Recent developments highlight the need for better understanding of tax evasion by third party PV firms. SolarCity, SunRun and Sungevity, some of the largest third party PV firms operating
9
These firms are often referred to in industry as EPC’s because they control engineering, procurement and con-struction in house
10
Eligible cost basis refers to the system price reported to the IRS for tax purposes.
11
“Evaluating Cost Basis for Solar Photovoltaic Properties,” Office of the Fiscal Assistant Secretary, US Treasury,
available at: http://www.treasury.gov/initiatives/recovery/Documents/N%20Evaluating Cost Basis for Solar PV Properties%20final.pdf
12“Cost Basis for the ITC and 1603 Applications,” publication of the Solar Energy Industries Association (SEIA)
in CA, have come under federal scrutiny for alleged price inflation. In July 2012, the US Treasury issued subpoenas launching an investigation of these firms’ business practices based on allegations of tax evasion through price misreporting.13 It is not clear what penalty these firms will face in the event they are found guilty. However, if these firms were to lose ITC funding, or if the Solar ITC program were discontinued, the consequences for the solar industry could be severe.
2.3 Descriptive Statistics
Summary statistics for the residential third party PV market are consistent with the idea that firms may be over-reporting prices. Of particular interest to this study is the difference between the price of systems sold outright versus prices reported for third party transactions.14 A simple comparison of means between the price charged by the same firm for customer owned systems versus third party systems is consistent with price over-reporting. Figure 3 illustrates, for the five largest firms operating in both markets in 2008, the difference in dollars between the mean price charged for third party installations as compared with traditional. It is apparent from Figure 3 that SolarCity exhibits a large pricing differential. In dollar terms, SolarCity’s mean third party system price exceeds its customer owned price by nearly $3.00. Sungevity and SunRun, the two other large firms under investigation for price misreporting are absent from this figure because Sungevity operates solely in the third party market, and SunRun operates wholly through subsidiary sellers and installers, and thus is invisible in the CSI dataset.
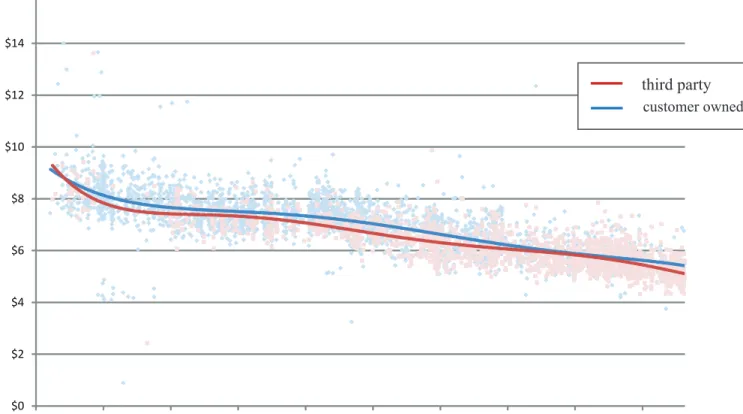
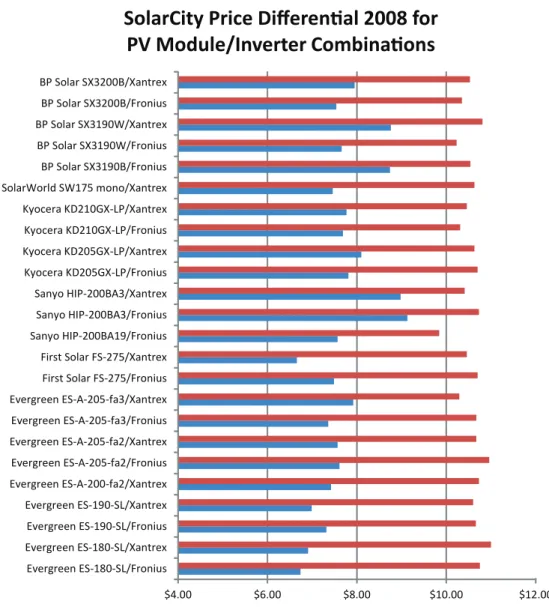
Figures 4 and 5 demonstrate clearly the difference between firms in pricing third party systems versus customer owned. Figure 4 plots REC Solar’s customer owned and third party system prices together on one graph, showing that throughout the study period, these prices are virtually indis-tinguishable. This contrasts with SolarCity’s pricing in Figure 5, where it is clear that it’s third party prices greatly exceed its customer owned prices throughout. A natural question that arises is perhaps SolarCity is systematically installing different, more expensive solar modules in its third party systems, which might explain this differential. However, inspection of Figure 6 suggests this is not the case. Figure 6 plots average per watt prices for more than 20 common solar module and inverter combinations installed by SolarCity. The first thing to notice is that SolarCity uses all of these combinations in both types of installations. Moreover, the per watt price differential
13
Dates and other information on the legal action available in “SolarCity Reveals Details Of Treasury Investigation In Pre-IPO Documents” at http://solarindustrymag.com/e107 plugins/content/content.php?content.11339#.UT4wzVeJ2hk
14A representative of the Energy Division of the California Public Utilities Commission confirmed by phone on
2/26/13 that the total cost variable reported for third party transactions in the CSI dataset is self-reported by firms, not in any way calculated or generated by CSI or the utilities administering rebates.
striking. There is consistantly more than a $3 gap in per watt prices for identical module and inverter combinations between the two installation types.
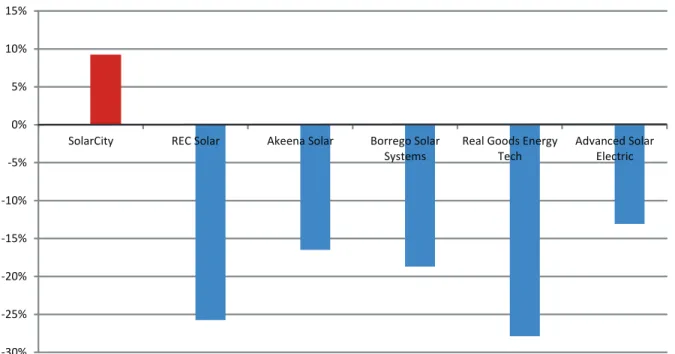
SolarCity’s third party price is also a standout compared with the whole market mean third party price. This point is clearly illustrated in Figure 7 which shows the percentage by which each firm’s mean third party price exceeds the whole market third party mean price for the six largest firms in the market in 2008. At first glance it would appear SolarCity’s price excess should be much larger to balance out all the other firms whose prices are significantly below this market mean, however the unbalanced appearance of this figure is due to SolarCity’s enormous market share. Because SolarCity controls such a large share of the market, its moderately high third party price drags the average up considerably, so that all the other firms appear significanly below the mean.
Due to fixed costs of installation, per watt price is generally decreasing in system size. As a result, we might be concerned that the price differential between third party and customer owned installations is driven by systematic differences in size. For instance, if third party installations are typically smaller, then ceteris paribus we would expect third party per watt price to be higher. A comparison of means in Table 1 reassures us that this is not the case. In every year the mean third party system size exceeded mean customer ownedl system size.
3
Data
The main dataset used for empirical analysis in this paper comes from the California Solar Ini-tiative, CSI, a state agency devoted to incentivizing uptake of PV. The CSI oversees state solar rebates administered through California’s three investor owned utilities (IOU’s), SCE, PG&E and SDG&E. CSI keeps detailed records on every PV installation in these three utilities including the date, size, cost, firms involved, module types, inverters and system performance measures. In this study I utilize residential system installation records from the years 2007 to 2012 in all three utility territories. The summary statistics for this dataset are displayed in Table 1. Some overall trends are readily apparent. Third party firms are increasing in market share throughout, but especially from 2009 forward. While the total number of annual third party installations increases throughout, the annual number of customer owned transactions increases through 2009, and decreases there-after. The mean per watt price of both traditional and third party systems is steadily decreasing throughout.
reported to the IRS for tax purposes. Through direct conversations with a CPUC representative, I have determined that this is the case.15 There are three acceptable methods of price reporting by third party PV firms under the CSI, but out of these only one, the Fair Market Value (FMV) approach, is relevant. The first applies to commercial transactions where a third party purchases systems from a contractor during construction of new housing developments, in which case they may report the actual “sales price.” Because this study only considers retrofitting of existing residential systems, that reporting option will not appear in my dataset.16 The second is to report the “appraised sum of cost inputs,” which is purely a total of all input costs. Because CSI benefits are increasing in reported price, the firm would never optimally report a cost-only workup as reported price under the CSI.
The remaining method is reporting Fair Market Value (FMV) for the system, an estimate of market value of a property defined as “what a knowledgeable, willing, and unpressured buyer would probably pay in an arm’s-length transaction.” This is the price reported for tax filings with the IRS and is inclusive of overhead and profit margins in addition to hard costs. For the reasons given above, the overwhelming majority of prices reported in the CSI dataset are likely to be generated in this manner. Another reason we should expect prices reported under both programs to be the same is that reporting different prices for federal tax purposes and state subsidy payments would raise red flags that firms with questionable pricing policies would want to avoid. Finally, the appearance of any cost-only prices in my dataset would downward bias my results. In other words, the positive coefficient on third party would be even larger if there were no cost-only prices reported in the dataset.
4
Theory
Non-transparent reporting mechanisms, lack of enforcement and uncertain consequences make the Solar Investment Tax Credit a likely target for tax evasion by third party PV firms. The ITC was intended primarily as a demand side subsidy for which individual consumers would claim the transacted amount spent on the purchase of their solar PV system. Third party transactions pose
15
In both email and phone conversations with a CPUC Energy Division representative, I was informed of the three price reporting methods for third party PV systems accepted by the CSI detailed in this section. The representative also directed me to the Frequently Asked Questions page of the California Solar Statistics website where these three reporting methods are detailed: http://www.californiasolarstatistics.ca.gov/faq/
16
The dataset I am using is that compiled for the CSI upfront cash rebate program in which residential, commercial, government and non-profit entities are awarded rebates for installing PV systems on existing structures. I restrict this dataset to residential observations for this study. CSI also manages a program called the New Solar Homes Partnership (NSHP) that deals with installations on new construction, however this data is recorded in a separate dataset is not included in my study.
a challenge for this system because there is no transacted system price to report, and the claimants are large firms reporting thousands of systems. Due to lack of a transacted price, firms are trusted to generate prices to report for the ITC which as nearly as possible capture the Fair Market Value of a system. Given that ITC awards are increasing in system price, the incentive for firms to report inflated prices is clear. Prior to the issue of federal subpoenas in 2012 against Sungevity, SolarCity and SunRun for possible tax evasion through the ITC, no enforcement actions had been taken against third party PV firms for misreporting system costs. As a result, with no precedent on which to base expectations, firms may have judged the probability of detection and punishment to be low.
Economic theory provides the motivation for my investigation of cost over reporting by third party PV firms. A well established literature explores the issue of tax evasion by individuals and firms who consider the probability of detection and the penalty if caught when deciding whether or not to cheat. I borrow from the work of Cowell (2004) in formalizing the conditions under which we would expect third party PV firms to over report prices in order to exploit tax breaks.17
The firm chooses β to maximize its expected profit:
E[Π] =
P−m−g(β)−[(1−p)(1−β)t+p(1 +sβ)t]
Q (1)
whereP is actual price,Q is demand,m is constant marginal cost,t is the corporate tax rate,s
is the penalty rate andp is the probability of detection. β, subject to 0≤β ≤1, is the proportion of sales the firm avoids paying taxes on through price misreporting. Misreporting is assumed costly, where the average cost per unit of misreported sales is given by convex functiong(β).
For simplicity, let
¯
t= [(1−p)(1−β)t+p(1 +sβ)t] (2)
Taking the first-order condition for a maximum yields
dg(β)
dβ +
∂¯t
∂β = 0 (3)
17
Cowell’s chapter, ”Sticks and Carrots in Enforcement,” in Aaron and Slemrod (2004), ”The Crisis in Tax Admin-istration,” includes a section on tax evasion by firms, in which Cowell develops a basic framework for firms’ decisions to evade with respect to costly concealment and the rates of detection and punishment. Cowell references Cremer and Gahvari (1993), Virmani (1989), Marrelli (1984) and Marrelli and Martina (1988) in developing a TAG (Tax Payer as Gambler) model of tax evasion specific to firms.
Evaluating at β= 0 and simplifying yields
1−p(1 +s)>0 (4)
which implies that firms will evade optimally so long as the probability of detection and the punishment rate are low enough that the expected rate of return to evasion is positive.
In the context of third party PV firm cost reporting for tax incentives, condition (4) is not difficult to satisfy. Up until 2012, when federal subpoenas were issued to several third party firms for cost over reporting, no firms had ever been investigated for misrepresenting costs under the ITC. This might lead firms to believe that the chance of detection was small. Indeed, if firms looked at IRS corporate income tax audit rates for guidance, which are less than 1%, they would conclude that the risk of detection was small. At the very least, firms likely percieved the probability of detection as highly uncertain. Firms had similarly little precedent on which to base perception of potential punishment or consequences in the event of detection. Individual ITC award claims had, in the past, been occasionally reduced or denied in cases where costs were judged to be excessive. However, none of these actions resulted in consequences beyond the immediate reduction of awards. This provided little guidance for firms in gauging the potential risks of cheating. Given this background, it is likely that at least some third party PV firms percieved the expected penalty rate to be less than the corporate tax rate of 35%. The goal of the empirical section which follows is to detect whether and to what extent firms in the third party PV industry exaggerated reported costs in order to maximize benefits from ITC green energy tax incentives.
5
Estimation
5.1 Estimating Third Party Price Premium
I begin my empirical analysis of third party PV firm price over-reporting by focusing on firms that I observe operating in both the customer owned and third party residential markets simultaneously. In this manner I can analyze the price differential in transactions in which the same firms sells a system of the same size with the same modules at the same time and place for a different price based on whether the transaction is a customer owned sale or a third party transaction.
My basic identification strategy is a within firm, within module model OLS regression of price on third party status with zip code, utility, time, firm and module fixed effects:
lnpriceit=β0+β11(thirdparty) +β2lnsizeit+ηz+ψu+φt+ωf +νm+it (7)
The variable of interest in this model is the dummy variable thirdparty denoting that the instalationl was third party as opposed to customer owned. Size is included in the model to control for system size, as per watt price is decreasing in size due to fixed costs of installation.18. An observation in this model is an individual PV system installation in a given zip codez and utility service territory u, installed at time t by firm f using modules of type type m. Adding inverter fixed effects does not change the results, so inverter fixed effects are not included. Higher order system size variables are not included for the same reason. The model includesit, a standard zero
mean error term. Standard errors are clustered at the zip code level for estimation throughout. The rationale for clustering at this level is that the figures reported to the CSI appearing in the dataset may come from regional CSI offices, and zip code is the best level on which to correct for this.
The entire dataset is used in this specification. Firm fixed effects eliminate potential bias due to unobserved heterogeneity at the firm level so that I have accounted for any idiosyncratic firm characteristics other than third party status influencing price. I am also concerned about the effect of covariates specific to module type that may also be correlated with price. Module fixed effects, specific to module make and model, eliminate unobserved module specific heterogeneity. Firm and module fixed effects mean the model identifies the premium charged by firms for third party systems relative to their customer owned prices for identical systems. A distinct but equally important question is the price differential between third party and traditional installations partly owing to systematic differences in module choice. This question will be dealt with in the following section.
Because various subsidy programs and regulations related to PV installations are administered at the utility level, it is important to include utility service territory fixed effects to account for unobserved covariates that might biasthirdparty.
I pay special attention to how time enters my model because there are so many time trending variables involved. Not only is the dependent variable, mean per watt price, trending downward over time, but the total number of installations and the market share of third party firms are trending upwards, while the market share of customer owned PV sales, prices of PV panels and modules, as well as utility and municipal level cash subsidies are all trending downwards throughout.
18
Controlling for system size is clearly important, but including size as an explanatory variable when the dependent variable is in terms of price per Watt might be questioned. Alternatively, I have included size deciles in place of the variablesize and the results are unchanged.
In response, different specifications include year, quarter and quartersample fixed effects both separately and interacted with utility or zip code. Alternately a third degree polynomial time trend is interacted with utility to flexibly control for time trends at the utility level. As demonstrated in Hughes and Podolefsky (2013), accounting for time trending variables at the utility level can be critical in the context of California solar variables. The preferred OLS specification includes a third degree polynomial time trend interacted with utility:
lnpriceit=β0+β11(thirdparty) +β2lnsizeit+ηz+ψu∗φt+ωf+νm+it (8)
While the within-firm, within-module fixed effects model above provides a good starting point for my analysis, it falls short of a true ”apples to apples” comparison of prices between markets. The ideal would be to compare differences in price between identical systems sold in third party and customer owned markets by the same firm. To more closely approximate this ideal, I turn to non-parametric propensity score matching Rosenbaum and Rubin (1983).
The advantage of propensity score matching in this case is that it allows me to create a better counterfactual. The coefficient in my fixed effects model may be biased if variables that explain price vary significantly between third party and customer owned markets. Matching pairs third party observations with customer owned observations which are most comparable in terms of observable characteristics such as size, module type and location, discarding observations for which there exists no common support. Conceptualizing third party transactions as being “treated”, letDi = 1 if the
ith system is third party, andDi = 0 if it is customer owned. Then potential price outcomes Yit(1)
and Yit(0) represent the price of system i at time t conditional on that system being sold in the
third party or customer owned market, respectively.
Through matching, we estimate the average treatment effect on the treated (ATT) as:
ΛT T =E[Yit(1)−Yit(0)|Di= 1] (9)
or equivalently:
ΛT T =E[Yit(1)|Di = 1]−E[Yit(0)|Di= 1] (10)
where ΛT T is the difference in the expected prices of third party systems actually sold in the the third party market and prices of third party systems had they instead been sold in the customer owned market. In other words, ΛT T measures the price premium for third party systems.
In practice, propensity score matching uses a vector of observable characteristics (system size, solar module models, zip code, etc.) to generate a propensity score, P S = P(D = 1|X = x), for every observation that describes the probability of that observation being treated (third party) based on its observable characteristics. These propensity scores are then used to match third party observations with the most comparable customer owned observations for estimation. In generating the propensity scores for matching, my vector of observable characteristics includes system size (W), solar module models, zip code, utility and quarteryear. I use nearest-neighbor matching, in which each treatment observation is paired one-to-one with its closest control match, restricting observations to those with common support, to estimate ΛT T.19 Standard errors are estimated following Abadie and Imbens (2006).
Table 3 presents results from OLS and propensity score matching. Each of the four OLS specifications allows time to enter differently into the model as discussed above, though in all cases the results are qualitatively similar. The prefered specification is estimated using propensity score matching, and these results are presented in Column 5.
The preferred specification suggests that the same firm installing two identical systems charges a 10% premium for the third party system compared with the customer owned system. Though I am not concerned with estimating size in this model, the negative coefficient on size corresponds with the intuition that per Watt price is decreasing in system size due to fixed costs.
The large and statistically significant coefficient onthirdparty is consistent with the hypothesis that firms are over reporting third party system prices in order to maximize tax benefits under the ITC. This 10% inflation of reported price translates to $3,900 higher price per third party system at the mean. Third party firms claimed a total of $250 million in third party ITC benefits during this period. Based on my finding of 10% price over-reporting at the mean, this implies $25 million in solar ITC tax benefits owing to price inflation.
An important issue to address is the concern that even after controlling for modules and invert-ers, there remains some unobservable quality difference responsible for the observed price differential between third party and customer owned systems. Firms installing third party systems incur ongo-ing maintenance costs, and in the case of a PPA, they directly profit from the electricity generated by a system. Thus, it could be the case that firms install higher quality, more expensive systems
19
I implement nearest-neighbor propensity score matching using the PSMATCH2, the most commonly used user written propensity score matching program by E. Leuven and B. Sianesi. (2003). ”PSMATCH2: Stata module to perform full Mahalanobis and propensity matching, common support graphing, and covariate imbalance testing”. http://ideas.repec.org/c/boc/bocode/s432001.html., version 4.0.6, 17 May, 2012. Common support refers to the range of observable values for which there is overlap between the treatment and control groups. Restricting estimation to observations with common support improves the quality of matches used in estimating the treatment effect.
in third party transactions.
A careful examination of the components of a PV system and their contribution to system price helps address this concern. A recent NREL publication by Goodrich, James, and Woodhouse (2012) suggests that solar modules, inverters and balance of system (BOS) components contribute $3.00 per Watt to installed system cost. Propensity score matching controlls well for modules and inverters, so that estimation is based on a comparison of systems with the same components.20 The remaining cost contributors are BOS components such as the frame, wiring and small hardware components, which together contribute approximately 40 cents to total cost. I contend that BOS materials such as wiring and misellaneous hardware are not likely to be the margin along which firms improve quality in third party systems, since the solar modules are the primary determinant of system output and longevity. Even if firms optimized third party sytsem performance through BOS hardware, this would not come close to explaining the large price differential.
Comparing factor design measures for third party and customer owned systems in Table 1 reinforces the idea that firms are not installing higher quality third party systems. Factor de-sign is a percentage describing the actual performance of a system versus its nameplate potential. Throughout my sample, factor design ratings show that third party systems are 1 to 2 percentage points less optimized for performance than customer owned systems. Finally, the choice of modules by firm between third party and customer owned systems appears very similar. Table 2 shows that module manufacturers used by three of the largest firms are fairly evenly distributed between customer owned and third party installations, while Table 6 reveals that 24 of the most common module/inverter combinations used by SolarCity are used in both of its installation types. While it is impossible to completely rule out the existence of unobserved quality issues affecting price, the evidence suggests unobserved quality factors are unlikely to explain the large price differential found in this study.
5.2 Price Misreporting by Individual Firms
A simple comparison of means conducted in Section 3 suggested that SolarCity and Sungevity, two of the firms currently under federal investigation, may be responsible for much of the observed higher price of third party systems. Because price misreporting is potentially illegal, determining whether the behavior is uniform across firms or unique to specific firms is imperative. Because
20
As mentioned earlier in Section 5, I have estimated the prefered specifications adding inverters and this did not change the results. For this reason my models do not include inverter model.
SolarCity operates in both traditional sales and third party sales, while Sungevity offers only third party systems, I approach evidence of price misreporting differently for each firm.
I analyze data on installations by three large firms operating in both the traditional sales market and the third party market to investigate how much of the estimated price misreporting can be attributed to the pricing behavior of SolarCity. The two firms I use for comparison in this analysis are Real Goods Energy Tech and REC Solar.21 I estimate the prefered specification from equation 8, without firm fixed effects, using data from each of these firms in isolation to identify the third party premium by firm.
Table 4 displays the results of this estimation. The results are striking. Neither REC Solar nor Real Goods display any premium for third party systems. In both cases the coefficient onthirdparty
is indistinguishable from zero, consistent with no price misreporting. By contrast, SolarCity displays a price premium of 28% for third party installations relative to non. Again, this result is highly statistically significant. This evidence is consistent with the hypothesis that certain firms are misreporting prices in order to maximize tax benefits under the ITC.
Finally, in order to better gauge the contribution of large firms to the 10% premium found in my main results, I run the main set of specifications from equation 8 while excluding SolarCity and Sungevity. The results, displayed in Table 5, suggest that the majority of the price difference in the third party market is attributable to SolarCity and Sungevity. The results suggest that smaller firms contribute 1 to 2 percentage points to the overal finding of a 10% price premium for third party systems. In other words, several large firms appear to be responsible for most of the overall finding of price over-reporting.
5.3 Price Misreporting Post-Subpoena, 2012
Following a well established literature on tax evasion, I have proposed in Section 4 of this paper that lack of transparency in reporting mechanisms combined with lax enforcement may lead firms to evade taxes. If firm propensity to cheat is decreasing in the perceived probability of detection and the severity of punishments, then the events of 2012 should have discouraged firms from over-reporting prices. In July of 2012 the US Treasury issued federal subpoenas for SolarCity, SunRun
21
These three firms, SolarCity, REC Solar and Real Goods Energy Tech, are the only large firms operating simul-taneously in both markets across years. While Akeena Solar had a large market share in 2008, its share 2010 and forward was very small. The remaining large third party PV firms operate only in the third party market. While Sun-Run and Sungevity are included in the Treasury’s investigation of price inflation, Sungevity only operates in the third party market. SunRun cannot be distinguished in our dataset because it operates whollly through subsidiary sellers and installers, many of whom also operate independently of SunRun. As a result, neither SunRun nor Sungevity enters this analysis
and Sungevity, three of California’s largest third party PV suppliers, to testify on charges of unlawful price inflation. Prior to that, no third party PV firm had been investigated for pricing irregularities, and the only consequences firms had witnessed were the IRS’s occasional refusal to honor an ITC claim or reduction of individual ITC awards on the basis of insufficient price justification. However, after July of 2012, all firms faced the reality of potentially serious consequences for cheating. It is likely that the three large firms in question knew of the impending Treasury action well in advance of recieving federal supboenas.
This unprecedented legal action presents the opportunity to analyze the post-subpoena period in order to detect a change in pricing behavior either on the part of the three firms in question, or the industry more broadly. Because these large, well-connected firms were likely aware of the impending legal action somewhat in advance of July, 2012, I expect any change in pricing behavior to happen prior to the formal issue of subpoenas. Moreover, I expect the price change for the industry as a whole to be gradual rather than abrupt due to sticky prices and firms’ desire not to further incriminate themselves with a sudden price drop.
Figure 8 clarifies for the entire market how and when third party prices re-aligned with customer owned prices. This figure shows that the price premium for third party systems hovered between 10 and 15% up until July 2011, one year prior to subpoenas. Then beginning in July 2011, third party prices are adjusted in line with customer owned prices over a period of 7 months, so that by March 2012 the price premium is erased, 5 months before the issue of subpoenas. The point estimates used to construct this graph come from running 33 separate propensity score matching regressions, one for each month between February of 2010 and October of 2012. Because installations are still a relatively rare event, monthly data did not provide sufficient statistical precision. Hence each of these regressions is run on a 5-month window of data surrounding a given month. Together, these point estimates provide a 5-month moving average picture of the evolution of third party price premiums during this period.
For my main post-subpoena results, I re-run the basic fixed effects and propensity score matching models using data only from 2012 to estimate the premium firms charge for third party systems. The results presented in Table 6 are starkly different from the main 2007 to 2011 results presented in Table 3. The point estimate on thirdparty for the preferred specification is not statistically different from zero, which is consistent with the idea that firms are no longer over-reporting price. The implication is that third party firms abruptly shifted their pricing in 2012 to bring third party prices in line with their prices on customer owned systems.
present-ing these results in Table 7. SolarCity appears to have completely shifted its third party pricpresent-ing to bring it in line with customer owned pricing. The coefficient onthirdparty of -0.009 is not statisti-cally different from zero, and suggests that SolarCity is no longer pricing third party systems above customer owned systems. This result coincides with the hypothesis that when making the decision whether or not to evade taxes, firms are responding to the perceived probability of detection and severity of punishment. SolarCity’s swift reversal on pricing of third party systems suggests the threat of punishment encapsulated in the federal subpoena was a sufficient deterrent to completely eliminate cheating. In terms of the theoretical framing, SolarCity incorporated the new information embedded in the subpoena regarding the percieved likelihood and severity of punishment, and the updated value of the penalty rate,r, became sufficiently large to deter cheating.
5.4 Pass-Through of the ITC
Using a difference-in-differences approach to investigate pass-through of the Solar ITC in the cus-tomer owned market, I exploit the lifting of the federal cap on ITC awards in 2009 as a source of exogenous variation. Prior to January 1, 2009, while the ITC award was nominally worth 30% of installed system price, the maximum award was capped at $2,000. Because the mean system price in the customer owned market was $41,568, the full award at the mean would have been $12,470. Given that very few systems sold for less than $6,666, the cap was binding in nearly all cases. Thus the average award increased by over $10,000 discontinuously at the start of 2009, and I utililize this exogenous shift in the ITC award to analyze pass through from consumers to firms in the customer owned systems market. Given that prices may be sticky and that firms may have anticipated the cap-lift, the resulting shift in prices is not observable as a discrete break on January 1, 2009. Thus a true regression discontinuity approach is not feasible. Instead, I estimate a difference-in-differences model, restricting data on customer owned installations to a 6-month window on either side of the cap-lift:
lnpriceit=β0+β11(postcapdummy) +β2lnsizeit+ηz+ψu+φt+ωf+νm+it (11)
This model includes zip code, utility, time, firm and module fixed effects, and a mean zero error term. As in previous modesl, standard errors are clustered at the zip code level. The results of this estimation are presented in Table 8, where the second column is my prefered specification with time entering separately from utility fixed effects as a third degree polynomial time trend. I suspect that during this relatively short period of time the main time trending variable to account for will be component prices which likely trend independently of utility, which is why my prefered
specification, unlike the models of price over-reporting, does not interact time trends with the utility fixed effects. The coefficient of 0.21 on the post-cap dummy in my prefered specification in Column 2 implies that the mean system price increased 21% post cap-lift from $41,992 to $50,810, in response to a mean ITC award increase of $10,598, from $2,000 pre-cap-lift to $12,598 post. In terms of subsidy incidence, this implies a pass-through rate of 83%. In other words, 17% of the ITC subsidy falls on consumers, while the remaining 83% is realized by firms.
While there are only a small number of utility level solar rebate level changes during this period, these up front cash rebates are downward trending during this period, so one could argue that utility level time trends are important to captue. To this end, in column 1 I include results with time trends interacted with utility fixed effects in order to better control for trends at the utility level. The regression discontinuity approach hinges on identifying a behavioral shift in an arbitrariliy small time period surrounding the exogenous source of variation, so choice of the window size shouldn’t unduly influence my results. To verify this, I also present results widening the window to 12 months on either side of the cap lift, reported in Column 3. Estimation results of both models are reassuringly similar to prefered specification results, with coefficients of 0.22 and 0.19 respectively, as compared with the prefered specification coefficient of 0.21.
As a robustness check on the results above, I estimate the prefered specification for time peri-ods other than the cap-lift period, in which case the post-cap dummy should not be statistically significant. For this falsification test I use January 1, 2010, July 1, 2008 and July 1 2010 as cap-lift dates, and restrict my data to a 6-month window on either side. Results from this test are presented in Table 9. The coefficient on the post-cap dummy in this case is not statistically different from zero, while the coefficient on log system size is statistically significant and consistent with previous results. This result strengthens my claim that the post-cap dummy in my model is in fact identified off the exogenous variation in ITC awards provided by the cap-lift at the end of 2009.
Without data on leasing prices in the third party market, it is impossible to similarly estimate pass-through in the third party PV market under the ITC. As I have demonstrated, reported prices are prone to exaggeration, and are not a function of actual lease payments remmitted by consumers, and thus cannot be used in any sort of pass-through estimation. As discussed in the Theory section, a basic assumption of microeconomics is that the incidence of a subsidy, as with a tax, should be independent of which party is nominally assessed. Rather, the incidence will be deterined by the relative elasticities of both parties. However, intuition suggests, and recent research confirms, that in reality this may not be the case, especially in situations of informational asymmetry (Busse, Silva-Risso, and Zettelmeyer (2006); Kopczuk et al. (2013)). In the third party PV market, consumers are likely to have less information than firms regarding the ITC. In fact,
the majority of leasing customers may not even be aware that in return for leasing them a system, the firm claims a 30% tax break under the ITC based on the system value. Contrast this with the customer owned market, in which virtually all consumers are aware of and claim the ITC award, and yet the majority of the award is nonetheless passed through to firms. However, pass-through rates are highly sensitive to the shape of demand curves, which may be quite different between the customer owned and third party markets. For this reason I remain agnostic regarding pass-through in the third party market. In the case that pass-through is similar to or lower than that in the customer owned market, the $25 million lost to tax evasion is largely a cash transfer to third party firms in the form of rents. However, significant pass-through to consumers would help to justify the amount lost to tax evasion by bringing down installation costs for consumers. This is an important question to explore, and presents an opportunity for future research.
6
Discussion
Between 2007 and 2011, almost 70,000 residential PV systems were installed in California’s IOU’s, of which over 21,000 were third party systems. The reported value of these third party systems totals over $2.7 billion, implying over $250 million in claimed Solar Investment Tax Credits by third party PV firms. I estimate that while some large third party firms exaggerated reported system prices by more than 28%, on average third party firms over-reported prices by 10%, or $3,900 per system. This allowed third party PV firms in California to accrue an extra $25 million in Solar ITC benefits due to price misreporting, beyond the $225 million in legitimate ITC awards earned by third party firms. Additionally, I find that pass-through to firms in this market is very large. 83% of ITC benefits are realized by firms, while the remainder accues to consumers. This finding suggests that funds lost through tax evasion mainly constitute a cash transfer to firms in the form of rents.
I find that the majority of this result is due to the pricing behavior of Sungevity and SolarCity, two of the largest third party firms. My results suggest that SolarCity charges 28% more at the mean for a third party system than it does for a customer owned system of the same size using the same solar modules. Sungevity prices average 21% higher than the mean prices charged for similar systems sold in the customer owned market.22 My results also show that strengthening enforcement while leaving reporting mechanisms unchanged may discourage cheating. Both So-larCity and Sungevity appear to have completely erased the price premium for third party systems
22As discussed in the Results section, the data subset used for estimation of the Sungevity price premium excludes
following their receipt of federal subpoenas in 2012 on the suspicion of tax evasion through price over-reporting.
The Solar Investment Tax Credit was designed as a demand side incentive to speed adoption of solar PV systems. At the time the ITC was first introduced under the Energy Policy Act of 2005, third party PV accounted for a tiny fraction of the market. As a result it appears not much thought was given to how to adjust ITC reporting and awards in the case of third party installations. The main difficulty arises from the fact that, unlike in a traditional PV system sale, in the case of third party systems there is no transacted price to report. As a de facto solution, third party firms were entrusted with the responsibility of generating “prices” to report that as closely as possible reflected the fair market value of a third party system. However, this setup presents a strong incentive for firms to inflate reported prices to exploit higher tax benefits. In this sense, the inefficiency identified in this paper is largely an unintended consequence of policy due to its failure to adapt to changing market realities.
Two important policy considerations are (1) is there a better alternative proccess for making awards in the case of third party transactions under the ITC, and (2) is the ITC program, even in the customer owned market, an efficient incentivization scheme for PV. In regards to the first question, it would appear that making awards to consumers instead of firms would be the simplest way to preserve the intention of the program as a demand side subsidy while eliminating tax evasion. Instead of basing a single tax break in year one on total system value, consumers could file for a series of smaller annual tax breaks based on actual yearly lease payments. Answering question 2 is beyond the scope of the current paper, however, given my finding that the overwhelming majority of ITC benefits in the customer owned PV market are realized by firms rather than consumers, exploration of alternative incentive schemes such as upfront cash rebates may be warranted in the interest of minimizing distortionary effects.
Despite drawbacks of the ITC program identified in this paper, incentivising the third party PV market may be well justified. A 2012 paper by Drury et al. (2012) suggests that third party PV is tapping into a new pool of potential adopters, increasing total demand for PV rather than just supplanting customer owned PV demand. In this case the mere availability of third party PV may increase the adoption rate, and subsidies for the third party PV industry may be warranted especially considering the profitability of the third party PV industry is heavily reliant on tax benefits. While the industry appears to be exploiting the ITC for tax evasion purposes, it is also likely contributing significantly to the upward trend in PV adoptions–not just by appropriating customers who would otherwise have installed customer owned systems, but by tapping into a new pool of adopters and creating new installations that would not have happened in the absence of
third party availability.
In order to weigh the portion of ITC funds lost to tax evasion against the potential benefits of increased adoption owing to third party availability, I perform a simple back of the envelope excercise. I would like to be able to calculate the dollar value of avoided CO2 emissions due to third party availability, however in the absence of any research quantifying the effect of third party availability on adoptions, I present calculations based on a range of potential contributions. On the high end I assume that 50% of observed third party installations would not have occurred as customer owned sales in the absence of third party availability, and on the low end I assume 10%. For my calculations I use the high, central and low value of the social cost of carbon (SCC), $35, $21 and $5 respectively, from Greenstone, Kopits, and Wolverton (2011). I assume an 18% capacity factor and a 20-year useful life for the average PV system. For emissions rates, I use the average marginal emissions rate of 0.36 MT/MWh derived in Graff Zivin, Kotchen, and Mansur (2013) for the Western interconnection (WECC), based on the US EPA’s coninuous emissions monitoring data.
The result of these calculations, shown in Figure 9, demonstrates that, for a wide range of contribution rates and SCC values, the benefit in terms of carbon abatement never outweighs the cost of ITC funds lost to tax evasion.23 Even under the assumption of a high value of SCC of 35$/MT CO2, it would take a contribution rate of over 50% in order for the benefits of carbon emissions abatement to outweigh the $25 million in ITC funds lost through price over-reporting. In other words, even if over 50% of all observed installations would not have occurred in the absence of the ITC program—an extreme assumption—the benefits from carbon reduction fail to balance the funds lost to tax evasion. This excercise demonstrates that the amount lost to tax evasion under the ITC is likely to outweigh potential benefits in carbon reduction under any plausible contribution scenario.
23
By contribution rate I mean the percentage of observed third party PV installations that occurred due to the availability of third party PV, rather than installations that would have occurred as customer owned installations in the absence of third party.
References
Aaron, Henry J and Joel Slemrod. 2004. The crisis in tax administration. Brookings Institution Press.
Abadie, Alberto and Guido W Imbens. 2006. “Large sample properties of matching estimators for average treatment effects.” Econometrica 74 (1):235–267.
Allingham, Michael G and Agnar Sandmo. 1972. “Income Tax Evasion: A.” .
Anderson, Simon P, Andre De Palma, and Brent Kreider. 2001. “Tax incidence in differentiated product oligopoly.” Journal of Public Economics 81 (2):173–192.
Bollinger, Bryan and Kenneth Gillingham. 2012. “Peer effects in the diffusion of solar photovoltaic panels.” Marketing Science 31 (6):900–912.
Borenstein, Severin. 2007. “Electricity Rate Structures and the Economics of Solar PV: Could Mandatory Time-of-Use Rates Undermine Californias Solar Photovoltaic Subsidies?” .
Borenstien, Severin. 2008. “The Market Value and Cost of Solar Photovoltaic Electricity Produc-tion.” Working Paper 176, Center for the Study of Energy Markets, University of California Energy Institute, Berkeley, CA.
Burr, Chrystie. 2013. “Subsidies, Tariffs and Investments in the Solar Power Market.” Working paper, University of Colorado, Boulder, Boulder, CO.
Busse, Meghan, Jorge Silva-Risso, and Florian Zettelmeyer. 2006. “$1,000 cash back: The pass-through of auto manufacturer promotions.” The American Economic Review :1253–1270. Cowell, Frank. 2004. “Carrots and Stieks in Enforeement.” The crisis in tax administration :230. Cox, James C, Mark Rider, and Astha Sen. 2012. “Tax incidence: Do institutions matter? an
experimental study.” Tech. rep., Experimental Economics Center, Andrew Young School of Policy Studies, Georgia State University.
Cremer, Helmuth and Firouz Gahvari. 1993. “Tax evasion and optimal commodity taxation.”
Journal of Public Economics 50 (2):261–275.
Drury, Easan, Mackay Miller, Charles M Macal, Diane J Graziano, Donna Heimiller, Jonathan Ozik, and Thomas D Perry IV. 2012. “The transformation of southern California’s residential photovoltaics market through third-party ownership.” Energy Policy 42:681–690.
Fisman, Raymond and Shang-Jin Wei. 2001. “Tax rates and tax evasion: Evidence from” missing imports” in China.” Tech. rep., National Bureau of Economic Research.
Fullerton, Don and Gilbert E Metcalf. 2002. “Tax incidence.” Handbook of public economics
4:1787–1872.
Goodrich, Alan, Ted James, and Michael Woodhouse. 2012. “Residential, commercial, and utility-scale photovoltaic (PV) system prices in the United States: current drivers and cost-reduction opportunities.” Contract 303:275–3000.
Graff Zivin, Joshua, Matthew J. Kotchen, and Erin T. Mansur. 2013. “Spatial and Temporal Het-erogeneity of Marginal Emissions: Implications for Electric Cars and Other Electricity-Shifting Policies.” Working paper, Dartmouth College, Hanover, NH.
Greenstone, Michael, Elizabeth Kopits, and Ann Wolverton. 2011. “Estimating the social cost of carbon for use in us federal rulemakings: A summary and interpretation.” Tech. rep., National Bureau of Economic Research.
Hsieh, Chang-Tai and Enrico Moretti. 2006. “Did Iraq cheat the United Nations? Underpricing, bribes, and the oil for food program.” The Quarterly Journal of Economics 121 (4):1211–1248. Hughes, Jonathan and Molly Podolefsky. 2013. “Getting Green with Solar Subsidies: Evidence
from the California Solar Initiative.” Working paper, University of Colorado, Boulder, Boulder, CO.
Karp, Larry S and Jeffrey M Perloff. 1989. “Estimating market structure and tax incidence: the Japanese television market.” The Journal of Industrial Economics :225–239.
Kirwan, Barrett E. 2009. “The incidence of US agricultural subsidies on farmland rental rates.”
Journal of Political Economy 117 (1):138–164.
Kopczuk, Wojciech, Justin Marion, Erich Muehlegger, and Joel Slemrod. 2013. “Do the Laws of Tax Incidence Hold? Point of Collection and the Pass-through of State Diesel Taxes.” Working paper.
Kotlikoff, Laurence J and Lawrence H Summers. 1987.Tax incidence. National Bureau of Economic Research.
Levitt, Steven D. 2012. “Identifying Terrorists using Banking Data.”The BE Journal of Economic Analysis & Policy 13 (3).