Improved Public Transit
Introduction
One of the major means of reducing vehicle miles of travel (VMT) in a region, and thus of reducing auto emissions, is to encourage the use of higher occupancy vehicles. Most U.S. urban areas currently have some level of public transit service that can provide, for many travelers, an alternative to auto use. Many urban areas also are currently in vari ous stages of constructing extensive additions to their transit systems. Los Angeles is in the midst of implementing an extensive subway/light rail system throughout Los Angeles County and the region is engaged in restoring commuter rail service over hundreds of miles in the 4-county area. San Francisco has proposed and design is underway on four extensions to the 71 mile BART system which, in total, add 35 miles to the system. This program also includes major investments in commuter and light rail extensions in Bay Area counties. Baltimore is constructing a 26-mile light rail line through the middle of the metropolitan area. Houston, Minneapolis and Northern Virginia are developing some of the nation's most effective high occupancy vehicle facilities in the country. Seattle is undertaking a comprehensive study that will identify the most appropriate transit future for that metropolitan area, a future that links transit explicitly to urban form. Milwaukee has recently formed a new regional transit authority whose purpose is to develop short- and long-range transit strategies for southeastern Wisconsin.
Public transit is thus viewed in many urban areas as an important component of a re-gion's transportation system, and certainly in many of the nation's older, transit-oriented cities, as an indispensable part of the city's economic survival. In the New York/New Jersey metropolitan area, for example, major investments totaling more than $1.5 billion are planned for the next five years to upgrade and extend the region's vast network of public transportation services. The newer cities who have experienced rapid growth over the last twenty years have also recognized the important role transit sys tems play in maintaining mobility and thus economic prosperity.
The effectiveness of traditionally structured transit services, however, is closely related to the land use patterns associated with an individual urban area. Historically, dense urban cores with major transportation corridors radiating into neighboring communities provided an ideal environment for the movement of large numbers of people with mass transit services. However, as growth characteristics in and around urban areas changed over the last forty years due in part to the impact of the national highway building pro gram, traditional transit services were unable to serve cost-effectively new and widely dispersed residential and commercial areas. The suburb-to-suburb trip pattern in U.S. metropolitan areas, by far the most prominent characteristic of metropolitan travel today, is not necessarily conducive to high capacity transit services that primarily serve high density corridors having well-defined origin and destination locations. The
increasing importance of non-work trips in regional VMT implies that an increasing proportion of regional travel is not part of the traditional transit work market. Finally, the increasing costs associated with the construction of transit facilities along with the operating costs required to provide transit service on these facilities has, in some cases, limited the expansion of transit services and service areas at the same time as metro politan areas have grown dramatically.
Although the above trends and patterns have significant impacts on the provision of effective transit services, some argue that there are other patterns that offer significant new opportunities for an enhanced role for transit in the future. For example, the American Public Transit Association (APTA) in its Transit 2000 report identifies several "forces" that it feels will help to increase transit ridership in the coming decades.(1) These include:
• Congestion and Auto Dominance
"Auto availability and use will continue to increase, but the cost, convenience and consequences of personal vehicle travel are likely to deteriorate significantly in more and more areas of the country, heightening the need for new options and strategies to enhance mobility...the high rate of suburban growth is expected to continue into the next century....emerging development patterns require a broader range of public transportation solutions and related actions focused on capturing "choice" riders and serving the needs of particular consumers, geographic sub-areas and trip purposes." • Threats to the Environment
"Worsening air quality represents a growing crisis for the nation....It appears, there fore, any success in reducing air pollution will require strategies that seek to alter travel behavior, including efforts to increase ridership on transit and other high-occupancy modes."
• Threats to Energy Independence
"As a nation, we now risk becoming more dependent on foreign sources of petro leum than at any time since the early 197O's....A coherent long-term energy policy must be put in place....Increasing ridership on transit and high-occupancy services will be an important element of this policy"
• Inadequate Infrastructure Investment
"The trend of declining infrastructure investment, particularly in transportation and public transit remains a mounting threat to our economy and quality of life."
• Demographic Change
"The number of persons over 65 will grow....the number of women in the work force will increase....minorities will account for nearly 60 percent of the population growth through the year 2000....By virtue of their sheer numbers, these segments of the population will require that increased attention be paid to their varying travel pref erences and patterns, and that the availability of both traditional and non-traditional services be expanded."
The APTA report also notes that transit agencies, must view their role much more broadly than they have in the past in order to meet the changing mobility needs of our citizens. The report suggests that transit agencies should really be "managers of regional mobility" or "full-service" transit agencies, encompassing not only the more traditional services such as rail and fixed route bus, but also such things as ridesharing and work ing with employer-based transportation management organizations.
Responding to this challenge, transit agencies across the country are forging new relationships and managing new types of services that meld traditional transit services with new growth centers and markets. The Seattle Metro, for example, is a full service mobility agency which provides traditional bus as well as ridesharing services, flexible work hour programs, and other services. The Southeastern Pennsylvania Trans portation authority operates in conjunction with employers in suburban activity centers subscription buses to and from rail stations. New Jersey Transit works with employers in New Jersey to develop feeder and subscription bus services to their fixed route ser vices. And the Houston Metro is developing a large network of HOV lanes in addition to its plans for a new rail system. These types of activities coupled with new ways to market, inform and attract riders provide examples of a range of effective strategies to deal with congestion, air pollution and mobility problems.
Although individual transit measures can provide improvements in a region's trans portation system, improving public transit must be viewed from a strategic perspective, including not only the expansion and enhancement of specific transit facilities and services, but also putting in place a number of complementary policies and programs like parking management programs, information services, marketing, and financial incentives that will help transit succeed. This chapter describes the types of transit improvements that can be implemented to encourage greater use of rail, bus, and paratransit systems. Some of the complementary policies that support transit services and will help transit succeed are found in other chapters in these Transportation Control Measure Information Documents.
Description of Measures
Transit improvements can range from relatively low cost options like marketing and enhanced public awareness programs to major investments like regional rail systems. Physical and service improvements alone do not make a transit system successful. Equally important are fare policy, adequate financing, and public policies which support transit usage. In developing a program of transit improvements, emphasis needs to be given to achieving balanced transit service having a mix of line-haul, feeder and shuttle systems. Transit improvements can therefore include a wide range of actions having varying levels of impact on ridership and costs. It is also important to note that many transit measures can be undertaken not only by transit operators, but also by general transportation agencies, private transportation firms, and by employers, businesses, transportation management organizations, and civic associations. Coordination of these
various services is important to maximizing total system ridership, including opportunities for involving the full range of potential users and providers in both planning new improvements and operating existing services.
In this chapter, transit improvements are identified as consisting of three major types: system/service expansion, system/service operational improvements, and measures aimed at increasing ridership through demand or market strategies. These categories were chosen because they seem best related to possible reductions in VMT and overall trip reduction in single-occupant vehicles.
In assessing the role of public transportation services in a region's air quality plan and especially transit's potential for limiting the growth of vehicle miles of travel, it is important to consider options which maintain or rehabilitate, as well as expand, existing services. For example, a recent benefit/cost analysis conducted by the Delaware Valley Regional Planning Commission showed that investment in maintaining the public transportation system operated by the Southeastern Pennsylvania Transportation Authority (SEPTA) in the Philadelphia metropolitan area would have substantial eco nomic benefits that outweigh the public subsidy costs for residents of Philadelphia.(14) The analysis specifically showed that rehabilitation and continued operation of SEPTA would return three dollars to the region and the state for every dollar spent on SEPTA, just in transportation benefits alone. In terms of total impact on the economy, the return to the region and the state of Pennsylvania would be over nine dollars for every dollar spent on SEPTA.
System/service expansion implies that new riders will be using new services, a portion of whom will presumably be substituting transit for previously used automobiles. System/service operational improvements result in more efficient operations or operations that provide more reliable service at greater speeds. Such improvements, if maintained consistently over time, could also attract more riders to transit. Marketing strategies aimed directly at increasing ridership would, by definition, result in some portion of these trips being attracted from single occupant automobiles. Discount fares, marketing, employer fare subsidies and passenger amenities when combined with fast, reliable, and convenient services, are examples of such measures. The public transit measures included in each of these categories and discussed in this chapter are shown in Table 1.
System/Service Expansion
Transit systems and services can be expanded using many different types of measures. The feasibility of each measure depends on the projected demand for such services, the costs associated with implementation, and its relationship to the transit technology already in use in the transit system. Expansion strategies can be divided into three basic types of services: fixed guideway transit, bus transit, and para transit strategies.
Table 1. Public Transit Measures
System/Service Expansion Fixed Guideway Transit Express Bus Services
Circumferential and Local Bus Services Paratransit Programs
System/Service Operational Improvements Feeder Bus Service
Express Bus Service
Bus Route and Schedule Modifications Improved Transfers
Schedule Coordination Bus Traffic Signal Preemption Road Operational Changes Operations Monitoring Maintenance Improvements Park/Ride Service
Subscription Bus Service Demand/Market Strategies
Employer Offered Incentives
Marketing and Information Programs Peak/Off-peak Transit Fares
Simplified Fare Collection Reduced Fares
Monthly Passes Uniticket Programs Passenger Amenities
Joint Development Activities
Fixed Guldeway
There are five major types of transit services in this category: heavy rail, light rail, com muter rail, fully automated rail, and transitways.(2)
• Heavy rail rapid transit is a high speed (75 to 85 mph), high capacity (between 20,000 to 34,000 passengers per hour) transit line using an exclusive right-of-way. Because of the requirement for an exclusive right-of-way and the substantial cost of vehicle acquisition, heavy rail rapid transit is the most expensive of transit invest ments. As a general rule of thumb, rapid rail transit is most suitable for serving areas having more than 50 million square feet of non-residential development and in corri dors averaging more than 12 dwelling units per acre. Several cities have constructed new rapid transit lines in the past several years, including Miami and Baltimore. Los Angeles is constructing a new rapid transit system, and Atlanta is considering exten sions of its existing rapid transit lines into suburban communities. Washington, D.C. has one of the most extensive and highly regarded modern rapid rail system in the nation. The New York City metropolitan area, with the largest system in the country, is examining extending service into New Jersey to provide improved access for this expanding market.
• Light rail transit is a medium capacity (ranging from 2,000 to 20,000 passengers per hour) rail service that can operate either on reserved rights-of-way or in mixed traffic on urban arterial streets. Because light rail can be more easily fit into urban corri dors, it is less expensive to construct than heavy rail. However, it does not carry as many passengers. Light rail is generally suitable for service to non-residential concentrations of 35 to 50 million square feet and having average residential den sities in the line's catchment area of about nine dwelling units per acre. Light rail lines have been the most popular form of rail investment during the past decade. New lines have been opened in San Diego, Portland (OR), San Jose, Sacramento, Los Angeles, and Buffalo. A new light rail line is under construction in Baltimore, and such rail systems are under consideration in Seattle, Denver, Minneapolis, Milwaukee, Detroit, Topeka, Atlanta, Dallas, Houston and St. Louis. Los Angeles is integrating the development of one of its light rail lines into the median of a major new freeway.
• Commuter rail services usually operate on existing mainline rail lines between suburban communities and urban centers. The service is characterized by high-speed, station-to-station service, with frequent service in the peak hours. Because existing rail mainlines can be used, commuter rail services could be a very cost-effective alternative for the suburb-to-center city trip. Given the high speed and wide station spacing, commuter rail can serve low density residential areas (one to two dwelling units per acre), but the destination of the rail line should lead to non residential concentrations of greater than 100 million square feet. Commuter rail services are quite common in the older, more industrial cities of the east and midwest. Urbanized areas like Boston, New York, New Jersey, Philadelphia, Washington D.C, and Chicago have had commuter rail services for many years. San Francisco also has had commuter rail services for some time. Some of these cities are seriously considering expanding such service. New Jersey for example, is planning
to interconnect its rail system providing linked service from one commuter shed to its other service area. Other cities, such as Atlanta, Miami, and Dallas, are exploring the possibility of instituting commuter rail services. Los Angeles is purchasing hundreds of miles ofright-of-way from freight railroads in order to begin providing commuter rail service on an extensive commuter rail network.
• Full automated guideways are a relatively new phenomenon in the United States. Miami, Detroit, and Seattle have built such systems, and they are under con sideration in other areas. These types of systems are generally used for circulation within urban areas or to facilitate connections between transportation hubs and major destinations like airports, for example. These systems are also in place at many airports such as in Orlando, Atlanta and Tampa, and under construction at Newark International airport in New Jersey.
• Transitways are exclusive roadways or lanes designated for use by high occupancy vehicles. The major purpose of transitways is to provide high occupancy vehicles with time savings as they bypass areas of severe congestion. Transitways can be completely separate from a freeway, such as is found in Pittsburgh and Ottawa, Ontario; located within a freeway right-of-way but physically separated such as the Shirley Highway in Washington D.C. and Houston METRO'S transitways; or lanes added to or taken from existing highway lanes for exclusive use by HOV's as found in Los Angeles, Orange County (CA), and New York City. (See the High Occupancy Vehicle Lane chapter of these Information Documents.)
There are other forms of "fixed guideway" transit services that could be potentially applicable in selected urban areas. For example, waterbome transportation consists of the use of waterborne vehicles such as ferries operating on frequent peak hour schedules carrying anywhere from 100 people to thousands. These services are often operated by the public sector. A variety of small and mid-sized services have sprung up over the last few years operated by private businesses. In New York, the Port Authority of New York and New Jersey allows for the operation of a commuter ferry service between Hoboken, N.J. and lower Manhattan by a joint private operator during peak periods. The service started in 1989 has grown steadily carrying over 1800 people.
Bus Services
By far the most traditional form of transit is fixed route and express bus services. Fixed route service is provided on a regularly scheduled basis along a specified route. Gener ally, expansion of fixed route service can be provided in one of three ways. Additional buses (using the standard 35-40 foot bus) can be used to provide more frequent service or extend routes into new market areas. Smaller buses or vans could be used to provide service in areas that do not warrant larger capacity buses. Or articulated buses, usually 55 to 60 feet in length, can be used to provide greater passenger-carrying capacity along heavily patronized routes. A minimum level of bus service (one bus per hour) can serve residential areas averaging four to five dwelling units per acre, corresponding to residential densities of 3,000 to 4,000 people per square mile or non-residential concentrations in the range of five to eight million square feet of floorspace. A frequent level of local bus service (one bus every 10 minutes) is often provided in residential areas
averaging 15 dwelling units per acre or 8,000 to 10,000 people per square mile, or for non-residential concentrations of between 20 to 50 million square feet.
A significant challenge to traditional bus services arises when such services are planned for suburban areas. Several transit agencies have investigated and initiated alternative ways of serving such suburb-to-suburb or circumferential trips. Portland, OR has imple mented a timed-transfer system in the suburban areas that allow passengers to transfer vehicles without undue delay. Other areas have explored the possibility of "freeway flyers" that pick up passengers at specified points (such as park and ride lots) and deliver them to a selected number of suburban destination locations (such as major employment centers or rapid transit stations). Mid-day shuttles from employment sites to retail areas have been initiated as well as feeder services and buspools.
Express bus services have been used in many urban areas to provide service between suburban communities and center cities. By its very definition, express bus services are designed to compete directly with the automobile by providing fast and reliable service. These services are usually used in conjunction with HOV facilities that provide these time savings. In many urban areas, express bus services are provided by private oper ators. In other areas, public transit agencies in suburban communities have established such services. Also, private employers have worked with transit operators to provide subscription services from central points (i.e., park-and-ride lots) to employment centers. In Philadelphia, SEPTA has been successful in developing feeder bus service from its suburban rail stations to adjacent activity centers.
Paratranslt Services
Para transit services consist of such things as carpooling, vanpooling, subscription bus, shared-ride taxi, and route deviation services. Some paratransit services, such as de mand responsive transit, can provide door-to-door service, an important characteristic for serving suburban locales having dispersed trip origins and destinations. Public transit agencies, ridesharing organization, and private employers have all been involved in initiating ridesharing programs as part of their responsibilities. For a more detailed description of ridesharing, see the Employer-Based Transportation Management and Area-Wide Rideshare Incentives chapters of these Information Documents.
System/Service Operational Improvements
Improvements in systems and service operations have as their major objective in creasing the productivity and cost effectiveness of transit lines. These improvements can focus on the characteristics of the transit service itself, such as geographic coverage and scheduling, or on the conditions that face transit service, which if improved, would make transit a more attractive option. An example of the latter case is improving the flow of buses along an urban arterial highway by bus preemption of traffic signals. For purposes of discussion, system/service operational improvements will be defined as consisting of service-oriented, road-oriented, and management actions.
Service Improvements
Transit service planning can cover a wide range of options to improve transit operations and to make transit a more viable option for travellers.O) At the service area level, route segments can be identified for possible changes that will enhance the market potential of the service. Such changes include splitting routes (when uneven passenger ridership profiles exist), establishing zonal services, or initiating express bus services. In addition, improving transfer policies and/or facilities could provide significant benefits to a transit system. Research has suggested that transfers are considered to be one of the most negative aspects of transit passengers' perceptions of transit service. Transfers include not only transit to transit transfers, but also car/transit, pedestrian/transit and bicycle/ transit transfers. Anything that can be done to eliminate transfers or to make them less onerous would be an improvement to existing transit service. A "universal transfer" program which allowed easy transfer among different transit services was adopted in Chicago and has been very successful. Schedule coordination is also a critical element in coordinating transfers. At the individual bus route level, most transit agency service planning focuses on changing vehicle frequency or schedules to reflect levels of ridership and conditions of overcrowding.
Road Improvements
Much of the delay associated with bus services can be attributed to the congested freeways and urban arterials used by transit vehicles. Unless high occupancy vehicle bypasses or some other preferential treatment is provided, buses will be delayed as much as single occupant automobiles. It is generally acknowledged that average speeds on urban highways have declined over the past twenty years. This decline clearly affects a transit agency's ability to provide services. The concept of preferential lanes for high occupancy vehicles, of course, is designed to allow such vehicles to bypass this congestion. Other types of road improvements can improve bus operations. These include removal of parking on urban arterials, creation of transit street malls, prefer ential access to freeways (including HOV-only ramps), and improved signalization. Improving traffic signals or providing bus signal preemption can have an important impact on bus operations. A Federal Highway Administration (FHWA) study on urban and suburban highway congestion concluded that providing advanced computer-based traffic signal coordination could decrease travel time along an urban corridor by as much as 25 percent.(4) Simply optimizing traffic signal timing, with no hardware interconnection, could provide a 12 percent decrease in travel time. Another study estimated that for an urban area of one million population there would be an annual reduction of 19.5 million vehicle-hours of travel if a computerized traffic signal control system were in place.(5) Although these studies focus on the overall time savings to all vehicles, bus operations would benefit from such improvements especially if given priority treatment Buses also can receive special treatment on urban arterials. Bus traffic signal preemption systems were installed at 12 intersections along a main arterial in Concord, CA. It was estimated after six months in operation that bus travel time was reduced by 10 percent, bus delay was reduced by 36 percent, and the number of times the bus stopped in traffic decreased by 36 percent.
Operations Management Actions
Monitoring system operations is an important step in developing the most appropriate allocation of transit resources for an urban area. This monitoring should not only occur daily, in terms of route performance and response to vehicle breakdowns, but it should also be undertaken on a longer time frame so that opportunities for improved services can be identified and implemented. This more strategic monitoring activity depends on a comprehensive collection of service data that are analyzed with the specific intention of identifying opportunities for service enhancements. Technological advances in auto matic vehicle identification and real time monitoring of vehicle location can provide transit agencies with a good basis for establishing a strong operations monitoring sys tem.
Another operations area that can provide significant service improvement is in vehicle maintenance. Establishing a preventive maintenance program and using maintenance management principles can, in the long run, allow a transit agency to provide more reliable service.
Demand/Market Strategies
Many factors influence a traveler's decision to use transit. Such things as the perceived cost of making the trip (of which the fare charged is an important component), the ease and comfort with which the trip can be made, and the passenger perceptions of safety and reliability can greatly influence the choice of mode. There are three major demand/ market strategies that will be discussed in this section — fare structures/policies, mar keting programs, and passenger amenities.
Fare Structures/Policies
The impact of price on ridership levels is most often described in terms of fare elasticity. Fare elasticity is simply the percent change in transit ridership over previous levels for every one percent change in fare. The transit industry rule-of-thumb is that ridership will increase (decrease) 0.3 percent for every one percent decrease (increase) in fares. This rule-of-thumb, of course, greatly oversimplifies the impact of fare changes on the many different markets served by transit. A 1980 study for the Urban Mass Trans portation Administration (UMTA) which examined numerous ridership impact studies of fare increases concluded the following:(6)
• Transit demand is inelastic to fare changes (that is, one gets less than a one-to-one percentage reduction in ridership when fares are increased).
• Elasticities for fare increases do not differ from those for fare decreases. • Small cities have larger fare elasticities than large cities.
• Bus travel is more elastic than commuter- and rapid-rail travel.
• Off-peak fare elasticities are double the size of peak-fare elasticities. • Short-distance trips are more elastic than long-distance trips.
• Intra-suburban trips are four times more elastic than radial trips on arterials. • Fare elasticities rise with income and fall with age.
• The work trip is the most inelastic of all the trip types.
Transit agencies have experimented with fare structures and fare policies for many years in an attempt to increase ridership. Some of the measures have included monthly or weekly passes which provide easier access to the transit system at a discounted price, free fare in central business districts, "free" ridership days, establishing a peak/off peak fare differential to encourage more discretionary trips to be taken on transit during the off peak, fare simplification including multiple operators accepting one fare medium, restructuring the fare basis (e.g., going to a distance-based fare rather than a flat fare) and employer fare subsidy programs. These measures can often provide important benefits to the transit agency. For example, a downtown fare free zone in Seattle is estimated to have reduced congestion by two to four percent in the downtown area. A Denver demonstration of free fares in off-peak hours resulted in a 50 percent increase in off peak ridership during the weekday, a 50 percent increase in ridership on Saturdays, and a 100 percent increase in ridership on Sundays. A Long Beach promotion of re duced fares during holidays resulted in a 30 to 40 percent increase in ridership.
Any attempt at attracting ridership through innovative fare policies (which usually means some form of reduced fare) must consider the potential negative impact on the financial well-being of the transit agency. A reduced average fare would ideally be offset by additional revenues from the new riders that would be using the service. Over the past decade as the federal government has reduced operating assistance, almost one half of transit operators have been forced to increase fares to offset rising costs. How ever, Congress currently is considering legislation to reauthorize the national transit program and reverse the trend by providing significant additional funds for transit operations because of the importance of transit to clean air and energy conservation programs.
An important element of transit fare policy is the ability to provide employer transit fare subsidy programs, either instead of or in addition to the provision of subsidized employee parking. Since 1984, employers have been allowed to provide their em ployees with up to $15 a month with tax-free, fare subsidies. Although many transit operators had encouraged employers to subsidize transit use through pass-sale programs allowing employees to buy transit passes at the worksite sometimes at a discount, these types of programs had not gained wide acceptance among employers. In 1987, a federally-funded program in New York operated by TransitCenter, a public-private alliance, began the TransitChek program that allowed employers to buy regional transit vouchers worth $15 to give to employees as a tax-free benefit. TransitCheks are used in part payment for tickets, tokens or passes sold by transit operators in the New York-New Jersey-Connecticut region. Because the use of TransitCheks was easy to
administer by the employer and was relatively low cost, TransitChek within a short time became the largest employer subsidy program in the nation with almost 1400 employers. Currently, such cities as Philadelphia, Chicago, and Denver have instituted TransitChek type programs. San Francisco, Los Angeles, and Milwaukee among others are sched uled to start programs before the end of 1991.
Employer fare subsidy programs can have an important impact on ridership and auto use. In a survey done by TransitCenter in late 1989 of over 500 companies that had used TransitChek for six months or longer, employees who received TransitChek were found to have increased their use of transit by 15.5 percent for commuting and decreased their auto use by 15.6 percent. Each TransitChek sold was found to generate about two additional transit trips. While $15 a month subsidy was found to be too little to have a major impact on auto use, recent efforts have resulted in the IRS raising the limit to $21 a month. In addition, Congress is considering a number of bills to raise the limit to as much as $60 a month, an amount which could yield important incentives to have employees increase transit use and decrease auto commuting.
Marketing Programs
A successful marketing program can be one of the most important efforts undertaken by a transit agency. As noted in a recent book on transit marketing, "For transportation planners to design a new service and then leave marketing departments with the job of "finding" new riders for the service, is hardly a formula for success. Marketing consid erations must play a primary role in service design so that the resulting new operation is one that can successfully be promoted to new riders."(7) By marketing its services, a transit agency is simply trying to convince potential riders that transit is a viable travel option. Marketing transit includes an explicit recognition of the product that is being marketed, including the types of vehicles and operating characteristics, the fare structure, the means of communication to the market, and the marketing strategy for distributing service information. Marketing efforts are particularly important when changes in service or new services are being implemented or when fare structures are being changed.
A critical adjunct to marketing programs is the provision of information about the transit services and how to use them. Most transit operators have some type of tele phone information service; many of which have had a significant impact on ridership. For example, N] Transit surveyed users of its telephone system and discovered that each call can generate up to 9 additional rides.
Information must be available, though, in the most convenient way possible, particularly if new riders or markets are being sought. Information outlets at public facilities, inside companies, at major tourist attractions and at major transportation sites such as airports or rail terminals are all important. In major, multi-operator markets, comprehensive and easy to use information is essential to overcoming obstacles to using transit. For ex ample, in New York, TransitCenter has developed on behalf of the major transit operators a publication called "The Manhattan Traveler" that provides a comprehensive package of transit information geared to those traveling to Manhattan anywhere from a 75 mile radius. Surveys of users of this portfolio revealed a 16 percent increase in transit
use for commuting and a 10 percent decrease in auto use. Household members of those who received the publication increased their transit use by 21 percent.
An important concept in successful transit marketing is market segmentation. Market segmentation simply means separately identifying the characteristics of the population "markets" that use or do not use transit. Based on these market characteristics, transit managers can identify pricing and service strategies aimed at attracting new riders to their service. An example of how this the market segmentation approach can be used is shown in Table 2. As shown in this table, a marketing analysis includes the iden tification of target markets, consideration of specific marketing strategies for these markets, and data collection and feedback that allows transit agencies to modify and make their strategies more effective.
In recent years, employer-based marketing has become a very cost effective means of reaching one of transit's largest service markets. On-site information for employees has become a de facto requirement in areas like Southern California where employer trip reduction programs are mandatory. In addition, on-site ticket and pass sales are becoming more common at worksites and have the potential of making transit services much more user-friendly than in the past.
Passenger Amenities
Making transit service and facilities easier, safer and more pleasurable to use is an important part of a transit agency's program to attract and keep riders. Transit shelters, benches, signage, maps, transfer facilities, elderly and handicapped access, visually pleasing aesthetics, and other amenities make transit more appealing to potential riders. Most major transit agencies have policies and service criteria that guide such things as the placement of shelters and the location of bus stops. In some instances, bus shelters are maintained by employers or other organizations located at that particular stop. Strategies for passenger amenities seem particularly useful targets for innovative public/private sector cooperative arrangements. Of great importance in this category is passenger and parking security. Numerous surveys have shown that passenger percep tions of personal safety while riding the transit system is an important consideration in the decision to use transit. The security of automobile parking and bicycle storage at park-and-ride lots also is an important determinant of transit usage. Providing high quality, secure bicycle lockers at a transit station, perhaps operated and maintained by a private organization, would encourage bicycle access to transit and eliminate the automobile cold start emissions that otherwise would occur if a person accessed the transit service by private car.
Combination of Strategies
The most effective transit system is one which applies the best transit strategies in the markets that are most suited for the specific service characteristics. This combination of strategies will be even more important in the future as transit faces a very different urban structure than it did fifty years ago. It seems likely that the typical metropolitan
Table 2. Market Segmentation Analysis
Step 1: Define Objectives and Set Priorities
Example: Alleviate parking shortage in downtown area
Step 2: Identify Segments that are Key to Success
Example: Drivers who compete for limited parking
Step 3: Identify Needs, Characteristics, and Present Behavior Patterns of Key Segments
Examples: Employees who park all day
Shoppers who park for one to two hours
Step 4: Further Divide Segments (where appropriate) Into Subsegments
Example: Parking garage/lot users, on-street parkers, and illegal parkers
Step 5: Develop Marketing Strategies Targeted at Each Subsegment Examples: Target employees at work place to use transit
Joint promotion of transit with retailers Crackdown on illegal parking
Market fare subsidy programs Institute information programs
Step 6: Monitor Results and Evaluate Relative Success of Each Strategy Examples: Ridership counts on key bus lines
Revenue collection from parking tickets
Step 7: Modify Segmentation Analysis or Marketing Strategy as Needed
Example: Offer discounted monthly transit passes and information through employers
area of the 21st century will be one dominated by dispersed activity centers, with the traditional downtown being just one. Planning for high capacity, high speed, con venient cost-effective and safe transit in this urban environment will be concerned with: 1) how to connect regional commuter markets to all major metropolitan activity centers, and 2) how to interconnect the activity centers themselves. This latter issue, the inter connection of activity centers, has already received a great deal of attention in numerous studies throughout the U.S. (e.g., Atlanta, Boston, Houston and Seattle). Different transit technologies will most likely be used to provide viable service in such a travel pattern. In addition, the private sector through employers, transportation management asso ciations, and private operators is becoming and will continue to be an important source of transportation options to commuters.
Case Study Examples
The success of transit improvements depends very much on the ability of transit to attract and retain riders who otherwise would use an automobile. To a large extent, one of the key challenges facing transit officials is putting together the financial package and public support needed to implement transit improvements. The following case studies illustrate, for different magnitudes of improvement, the components of successful plan ning and implementation of transit improvements.
San Francisco Regional Transit Improvement Program
Rail transit has played an important transportation role in the San Francisco Bay area. The opening of the Bay Area Rapid Transportation (BART) system in the mid-1970s was intended to be the beginning of an ambitious region-wide rail system that inter connected the nine counties in the metropolitan area. However, the plan actually adopted by the voters in 1962 only included the three core counties. Recognizing the problems caused by this reduced regional rail system, the Metropolitan Transportation Commission, the metropolitan planning organization for the Bay area and the agency responsible for approving transit capital investments, began a process in the early 1980's which resulted in the publication in 1984 of an interim plan which showed new potential rail lines in the region. In 1988, the MTC adopted Resolution No. 1876 which outlined how these new rail lines were to be funded. Importantly, this Resolution provided the means by which another county would join the BART system.
This rail plan would extend BART to San Francisco Airport, provide for BART line ex tension in three directions, extend a commuter rail line closer to downtown, and extend a light rail line in Santa Clara County. The high level of regional consensus on this major transit investment program among the five counties which circle the Bay is unprecedented and took several years to come to fruition. The projects and cost sharing are shown in Table 3.
Table 3. Proposed Extensions to the San Francisco Bay Area
Rapid Transit (BART) System
Project
BART Extension to Airport
BART Extension to West Pittsburgh
BART Extension to Dublin
BART Extension to Warm Springs
Commuter Rail Extension
Light Rail Extension
Total Project Cost $878 M 75% Federal Share $425 M 0% Federal Share $514 M 0% Federal Share $521 M 0% Federal Share $658 M 25% Federal Share $350 M 50% Federal Share $3,346 B $1,000 B Federal Share 29.88% Federal Share
The funding formula for each of the six above projects is spelled out in Resolution 1876 which makes the funding commitment fairly firm. The local (non-state) funding share is derived from both old and new county sales taxes dedicated to transit, BART reserves, old and new bridge tolls, and Santa Clara county sales tax funds. The state will contribute $736 million out of state dedicated transit funds and rail bond funding that was approved by California voters in referendums 108, 111, and 116 of 1990. There is not expected to be substantial funding from the private sector although BART is actively pursuing joint development opportunities around some BART stations.
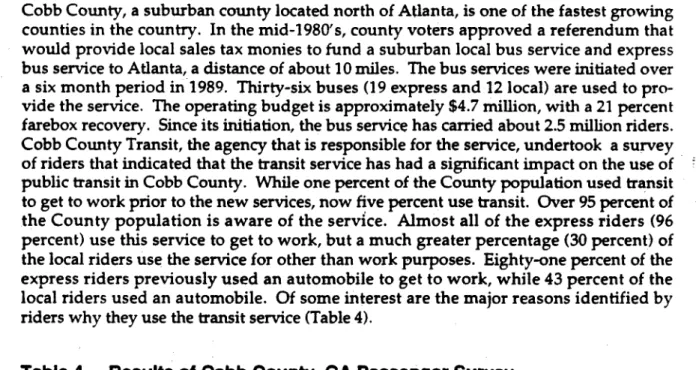
Cobb County's Express and Local Bus Service
Cobb County, a suburban county located north of Atlanta, is one of the fastest growing counties in the country. In the mid-1980's, county voters approved a referendum that would provide local sales tax monies to fund a suburban local bus service and express bus service to Atlanta, a distance of about 10 miles. The bus services were initiated over a six month period in 1989. Thirty-six buses (19 express and 12 local) are used to pro vide the service. The operating budget is approximately $4.7 million, with a 21 percent farebox recovery. Since its initiation, the bus service has carried about 2.5 million riders. Cobb County Transit, the agency that is responsible for the service, undertook a survey of riders that indicated that the transit service has had a significant impact on the use of public transit in Cobb County. While one percent of the County population used transit to get to work prior to the new services, now five percent use transit. Over 95 percent of the County population is aware of the service. Almost all of the express riders (96 percent) use this service to get to work, but a much greater percentage (30 percent) of the local riders use the service for other than work purposes. Eighty-one percent of the express riders previously used an automobile to get to work, while 43 percent of the local riders used an automobile. Of some interest are the major reasons identified by riders why they use the transit service (Table 4).
Table 4. Results of Cobb County, GA Passenger Survey
Local Express N o Car Available 63% 7% Reduce Costs 25% 71% Less Stressful 16% 78% Reduce Parking Cost 12% 59% Time to Read, etc. 10% 54% N o Driver's License 17% 4% Enjoy Bus Riding 13% 15% Hard to Find Parking 7% 14%
Also of some interest is the mode of access to these new bus services. Ninety-one per cent of express riders drove a car to their bus stop, while 82 percent of the local riders walked.
The transit operation is heavily oriented toward privatization of services. A private transit management firm manages the system. The marketing, legal services, and many other support activities are contracted to private firms. Half of the bus fleet was leased to provide maximum advantage of limited governmental funding.
Program Impacts
Transportation Impacts
The transportation impacts of transit improvements can vary widely, depending on what measure is being adopted and the circumstances in which it is being considered. In some cases, it is not at all clear and not easily quantifiable what impact certain meas ures would have on transit ridership. For example, placing bus shelters and bicycle storage lockers along bus routes could very well provide an incentive for travelers to begin using transit. However, few, if any, studies have been undertaken on such an impact. Conventional wisdom is that a variety of factors including cost, convenience, speed and comfort are considered by potential transit riders who have alternatives to transit available to them. This section provides a review of studies which have been done on measures which demonstrate a discernible impact on ridership and reduced VMT.
Rail Systems
Perhaps the most controversial aspect of rapid rail and light rail systems is determining what impact they have had on transportation behavior in a metropolitan area and on urban form. Several studies of specific rail systems have been undertaken over the past twenty years. The most extensive study, conducted between 1972 and 1978, was done on San Francisco's BART system.(8) It was shown that auto travel (as a percent of total person trips) was reduced by an average 7.6 percent in the locations where data were collected. In addition, passenger surveys showed that 37 percent of BART riders pre viously drove alone, 42.5 percent rode a bus, and 17.9 percent car pooled. Close to 57 percent of the BARTriders drove or rode in a car to a BART station.
The impact of Washington D.C.'s Metrorail system was studied between 1976 and 1979.(9) These studies showed that between 1977 and 1979, the total peak period trips to the downtown increased by 16,600 (five percent) while auto and bus trips decreased by 10,600 person-trips and 27,800 person-trips, respectively. The study also showed that a significant percentage of new Metrorail riders came from bus (ranging from 47 percent to 67 percent for different Metrorail line openings). Similarly, Metrorail users diverted from automobiles varied from 20 percent to 44 percent, again depending on which line was being examined.
Perhaps the most extensive study of light rail impacts was undertaken by Houston METRO in 1990 as part of its planning for a new light rail line connecting major activity centers in the metropolitan area. Houston METRO compared what was being predicted in Houston with several other metropolitan areas that were considered similar to Houston. These metropolitan areas were San Diego, Portland (OR), Sacramento, Buffalo, Washington D.C., Atlanta, and Miami. The information that resulted from this study provides useful comparisons of the transit systems in these cities along several dimensions. Figure 1 compares the total revenue passengers before and after the opening of a rail line (Houston's data is based on predicted volumes). In most cases, the "after rail" data was taken in 1988 and the "before rail" data was a two or three-year average prior to the opening of the rail line. As can be seen in Figure 1, Washington D.C., Atlanta, San Diego and Buffalo showed an increase in revenue passengers after rail was introduced. Miami, Portland, and Sacramento showed small changes. One must be cautious, however, about interpreting this information. It often takes time for a rail transit line to have an effect on travel patterns. Therefore, the information presented in Figure 1 should be considered from the perspective that of all the systems considered, only two, Washington D.C. and Atlanta, have been in place for more than 10 years. Table 5 shows the percentage change from 1982 to 1987 of daily vehicle miles traveled on freeways and principal arterials as compared to transit annual passenger-miles of travel for the case study cities.
Bus and Fare Systems
Expansion of bus services can be considered from a regional perspective or from the perspective of a specific travel corridor. There is a great deal of data on the ridership impact of increased bus service. Table 6 shows the impacts of transit service expansion on vehicle miles traveled in selected large and small cities. The level of service expansion is indicated by the percentage increase in bus miles. As can be seen, the percentage increase in ridership is slightly below the percentage increase in bus miles, except in Atlanta where the increase in bus miles was accompanied by a substantial reduction in fare. A1978 study estimated that a comprehensive area-wide express bus operation in a metropolitan area of one million population would reduce annual VMT by about 0.31 percent, regional work trip VMT by 0.89 percent and work trip VMT to and from the downtown by about six percent.(lO)
At the corridor level, improvements to bus service can make a more dramatic impact. For example, initiation of express bus service in Pittsburgh increased bus ridership by 17 percent. In Washington D.C. and Los Angeles, corridor bus ridership doubled and tripled, respectively when express bus service was introduced. The work trip share for transit rose from 27 percent and 12 percent to 41 percent and 24 percent, respectively. Preferential treatment for high occupancy vehicles often allows express buses to provide the time advantage that is necessary to attract riders. In Seattle and Minneapolis, bus ramps and bypass lanes provided express buses with sufficient time savings that the transit mode share in the corridor rose 11 percent and 12 percent, respectively. A Miami express bus service, established along with priority treatment and a new park-and-ride lot, attracted 800 passengers per day, 64 percent of whom previously used an auto mobile for the trip. The VMT reduction due to mis service was estimated to be about 3.4 million vehicle miles traveled over an 18 month period. This evidence reinforces the fact that travel time does make a difference in attracting riders.
Figure 1. Comparison of Revenue Passengers in Selected Cities
Washington, D.C.•
I
Houston 1980/ 2000-
1
Atlanta-Miami • •
Portland—
San Diego P "•,
Buffalo ! • • Sacramento V I 0 50 100 150 200 250 30 ThousandsH I Before Rail
I With RailTable 5. Changes in VMT and Transit Passenger Miles Traveled,
1982-1987
Urban Area Change in Freeway and Principal Arterial Daily Vehicle Miles of TravelChange in Transit Annual Passenger Miles of Travel Houston 17.8% 56.5% Atlanta 55.0% 34.5% Miami 14.6% 8.0% Washington, D.C. 44.0% 37.4% San Diego 47.8% 6.7% Sacramento 37.8% -24.0% Portland 31.7% -2.5% Buffalo 13.8% -8.5%
1
Table 6. Impacts of Bus Service Expansions
Average Daily
Ridership % Reduction (Net)
City Divided by Population1 % Increase in Bus Miles % Increase in Ridership in Total Daily Areawide VMT2 Large Urban Areas
Seattle, WA .078 9.6 8.3 0.06 Miami, FL .127 12.5 10.9 0.24 Portland, OR .068 42.5 36.4 0.13 San Diego, CA .068 20.1 13.3 0.08 Atlanta, GA3 .116 10.5 46.0 0.40 Average .091 19.0 23.0 0.18
Smaller Urban Areas
Madison, WI .143 7.6 8.9 0.13
Eugene, OR .021 166.5 271.3 0.22
Raleigh, NC .036 28.6 10.9 -0.02
Bakersfield, CA .016 50.8 49.0 0.06
Average .054 63.4 85.0 0.10
Before service expansion.
2 Net VMT reduction equals auto VMT reduction minus increased bus VMT X 2.
3
Includes the effect of a fare reduction from 40? to 15t as well as service expansion.
Operational changes, like route restructuring or consolidation, most often have minimal impact on regional VMT, but could provide positive benefits at the corridor level. Table 7 shows a hypothetical case of changes in vehicle headways and number of bus stops along a bus route for different levels of tripmaking and the impact on vehicle miles of travel in the corridor.
Fare changes, an action that affects everyone using a transit system, however, can sig nificantly influence ridership levels. As noted in the previous section on fare structures/ policies, the elasticity of ridership levels with respect to price falls somewhere in the 0.2 to 0.5 percent range (that is, one gets a 02 percent increase in ridership for a one percent decrease in fare). The off-peak fare-free demonstration in Denver which resulted in fairly large increases in off-peak travel increased transit's share of regionwide travel from 2.4 percent to 3.1 percent, and reduced regional VMT by 0.5 percent.
Other types of transit improvements, such as improved marketing and fare passes, can have an important role in increasing transit ridership, but individually have negligible impact on regional VMT. Taken in combination, however, these types of improvements have a positive influence on attracting and retaining ridership.
Air Quality Impacts and Considerations
Transit improvements will reduce emissions to the extent that they attract riders away from automobile travel. The combination of improved transit along with other trans portation control measures (TCM's) can be expected to contribute positively to emission reduction requirements needed in nonattainment areas in order to achieve the national ambient air quality standards. An indication of what air quality benefits can be attained from transit improvements comes from transportation plans which have examined air quality impacts, State Implementation Plans (SIP) or Air Quality Plans for non-attainment areas.
Atlanta
A travel corridor stretching from downtown Atlanta ten miles to the north is one of the
fastest growing areas in the country. In order to handle increasing levels of congestion in the corridor, the Metropolitan Atlanta Rapid Transit Authority (MARTA) is pro posing to extend one of the existing subway lines north to a station outside the beltway surrounding the urban core. Both microscale and regional air quality analyses were performed to analyze the air quality impact of this proposal. The draft environmental impact statement for the project concluded that "none of the projected changes can be considered as producing significant decreases in overall regional emissions." (11)
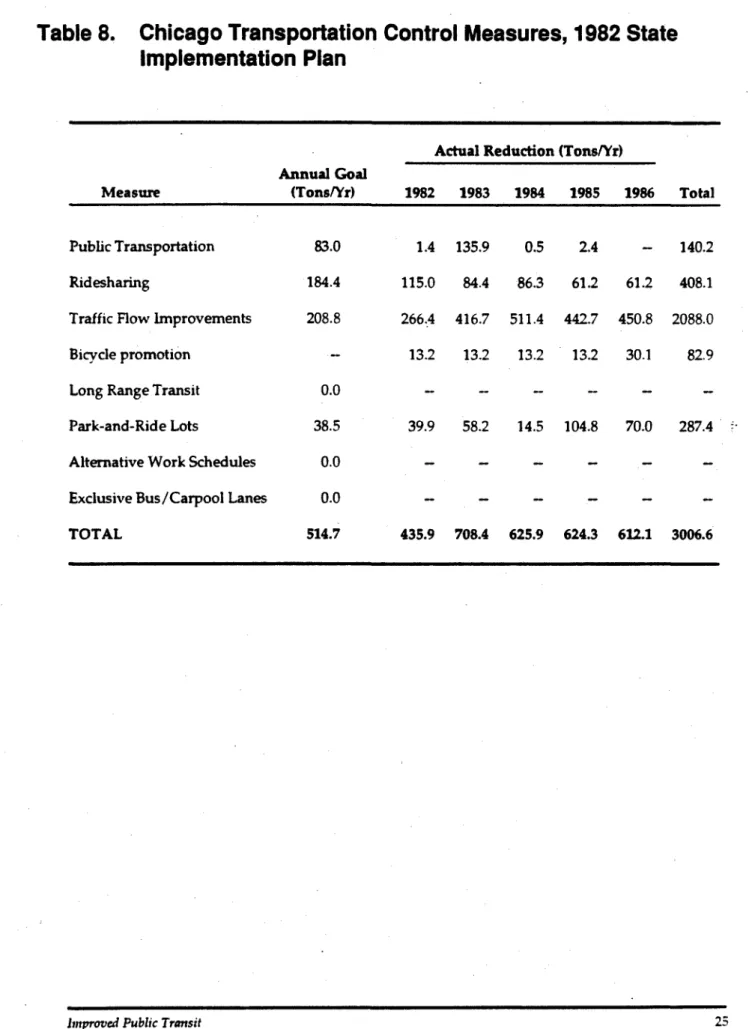
Chicago
The 1982 State Implementation Plan for Chicago included estimated air quality impacts for public transportation improvements and long range transit. Service improvements included such things as reduced bus headways, bus route expansion, and additional passenger cars for the rail service. The annual emissions reduction goals and the actual reductions achieved for the transportation control measures, including public trans portation, from 1982 to 1987 is shown in Table 8. The long-range transit plan included
Table 7. Transit Operational Changes and Impact on VMT
Automobile VMT and vehicle trips per hour for three values of total person trip volume (trips/hr) in corridor *
Transit 500trips/hr 1,000 trips/hr 1,500 trips/hr
One-way Stops
Headway Per Fleet Vehicle Vehicle Vehicle
(Min) Mile VMT Size VMT Trips VMT Trips VMT Trips
5 . 2 144 14 1,060 319 2,120 637 3,190 956 15 2 48 5 1,100 332 2,210 663 3350 1,000 30 2 24 3 1,160 349 2,360 708 3,730 1,120 5 4 144 15 1,040 311 2,070 622 3,110 933 15 4 48 5 1,080 325 2,160 649 3,350 1,000 30 4 24 3 1,140 343 2,360 708 3,730 1,120 5 8 144 16 1,040 312 2,080 624 3,120 936 15 8 48 6 1,080 325 2,170 651 3,350 1,000 30 8 24 3 1,140 343 2,360 708 3,730 1,120 a
Results have been rounded to three significant figures.
Source: loel Horowitz, Air Quality Analysis, The MIT Press, 1982.
Table 8. Chicago Transportation Control Measures, 1982 State
Implementation Plan
Actual Reduction (Tons/Yr) Annual Goal
Measure (Tons/Yr) 1982 1983 1984 1985 1986 Total
Public Transportation 83.0 1.4 135.9 0.5 2.4 140.2
Ridesharing 184.4 115.0 84.4 86.3 61.2 61.2 408.1
Traffic Flow Improvements 208.8 266,4 416.7 511.4 442.7 450.8 2088.0
Bicycle promotion ~ 13.2 13.2 13.2 13.2 30.1 82.9
Long Range Transit 0.0
Park-and-Ride Lots 38.5 39.9 58.2 14.5 104.8 70.0 287.4
Alternative Work Schedules 0.0
Exclusive Bus/Carpool Lanes 0.0
TOTAL 514.7 435.9 708.4 625.9 624.3 612.1 3006.6
expansions in five rapid rail and four commuter rail lines. A regional emission reduc tion attributable to this plan of approximately 0.29 percent was predicted for both carbon monoxide and hydrocarbons.
Houston
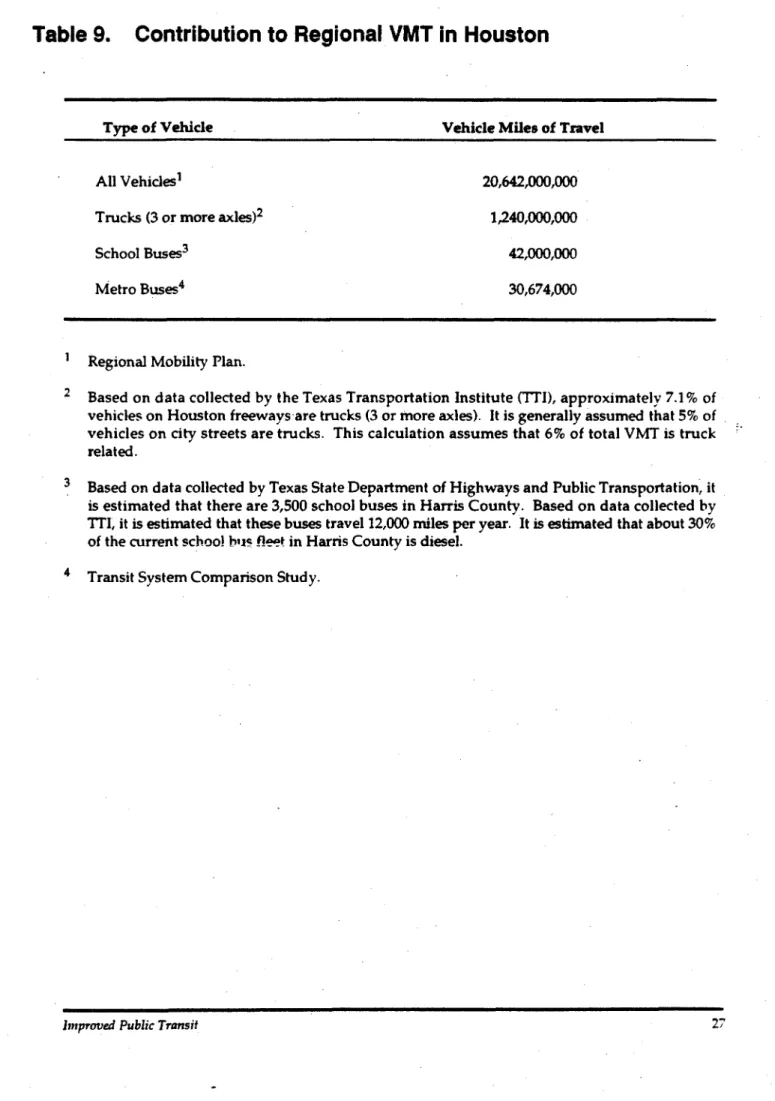
Base emissions inventory data for the period 1987-1988 indicates that 31 percent of VOC, 38 percent of NOX, and 87 percent of CO emitted in the Houston-Galveston nonattain ment area are the result of mobile sources. As part of its light rail study, Houston METRO investigated the air quality impact of the proposed light rail line.(12) It was estimated that building the light rail line would reduce regional auto trips by 0.3 percent. As noted in the analysis, this percentage defined the general magnitude of the area-wide impacts the light rail line could be expected to have on air quality. Such a small impact on automobile travel and on air quality was not surprising when con sidering the relative magnitudes that different types of vehicles contribute to regional VMT in Houston (Table 9).
Honolulu
The City of Honolulu and the State of Hawaii have been studying for many years alter native transportation options for a transportation corridor bisecting Honolulu. A 1990 draft environmental impact statement examined several alternatives including what was referred to as a "fixed guideway technology" alternative. It was estimated that this al ternative would result in a 2.3 percent and 6.5 percent decrease in auto and bus VMT, respectively. This reduction relates to an estimated one to three percent reduction in emissions over a ten-year period to the year 2005.
Most of the above studies focus on rail systems. The air quality impact of bus or oper ational improvements is less studied. Table 10 shows the air quality benefits for the hypothetical bus operational changes described in the previous section. As can be seen, reducing the transit headway can cause relatively large carbon monoxide and hydro carbon emission reductions in the example corridor when the person trip volume is relatively high. For example, reducing the headway from 30 minutes to 5 minutes for a trip level of 1,500 trips per hour reduces carbon monoxide and hydrocarbon emissions by 11-14 percent. Thus, increasing service frequency combined with traffic flow im provement could result in significant emission reductions. As is also shown in the table, headway reductions are less effective at decreasing pollutant emissions at lower trip volumes.
Program Costs and Other Considerations
Program Costs
The costs for transit improvements vary greatly by the type of measure under consid eration. A regional transit improvement program such as that described above for San Francisco can cost in the billions of dollars. A dual rail/bus tunnel in downtown Seattle that will significantly improve bus operations in the region and also allow for rail
Table 9. Contribution to Regional VMT in Houston
Type of Vehicle Vehicle Miles of Travel
All Vehicles1 20,642,000,000 Trucks (3 or more axles)2 1,240,000,000 School Buses3 42,000,000 Metro Buses4 30,674,000
1 Regional Mobility Plan.
2 Based on data collected by the Texas Transportation Institute (TTI), approximately 7.1% of vehicles on Houston freeways are trucks (3 or more axles). It is generally assumed that 5% of vehicles on city streets are trucks. This calculation assumes that 6% of total VMT is truck related.
3 Based on data collected by Texas State Department of Highways and Public Transportation, it is estimated that there are 3,500 school buses in Harris County. Based on data collected by TTI, it is estimated that these buses travel 12,000 miles per year. It is estimated that about 30% of the current school bu? fleet in Harris County is diesel.
Transit System Comparison Study.
Table 10. Hourly Motor Vehicle Emissions for Hypothetical
Corridor
Emiasic m (kg/hr) from
Transit
Trenail •tops 6uaas Auiomobilas ANvahidat*
nasoway iaf
HC NO. CO HC NO.
(nun) milt CO HC NO. CO
Parson trip votumt-500«ip/hr
5 2 739 1.11 420 863 839 236 843 • 5 0 7.19 15 2 2.46 037 140 803 8.73 3.11 82.7 9.10 4 5 1 so :2 123 0.18 0.70 84.9 9.16 326 •6.1 • 3 6 3.96 5 -1 739 1.11 420 84.7 8.19 231 82.1 830 7.12 15 '1 246 037 1.40 884 8-55 3.04 •0.9 832 4 4 4 3 0 " 41 123 0.18 0.70 933 9.02 321 945 • 2 1 3 3 1 5 ti 739 1.11 420 85.0 822 232 92.4 833 7.13 16 1I 246 037 1 4 0 88.6 857 3X5 •1.1 854 4 4 5 30 1t 123 0.18 0.70 835 8.04 322 •4.7 922 332
r V I O n Wap W9IURW : . 1.000 trips/hr
s :I 739 1.11 4 2 0 174 163 637 181 175 102 15 2 2.46 037 1 4 0 181 175 621 183 173 7.61 30 2 123 018 0.70 193 18.6 6.63 194 183 733 5 *I 739 1.11 4 2 0 170 164 633 177 175 105 15 * 246 037 140 177 17.1 6.08 179 175 748 30 iI 123 0.18 0.70 193 18.6 6.63 194 185 733 6 1 739 1.11 420 170 16.4 635 177 175 10.0 15 1 246 037 140 177 17.1 6.10 180 175 750 30 1 123 018 0.70 193 186 6.63 194 185 733
Parson trip vokim* « 1500 tnps/hr
s :2 739 1.11 4 2 0 260 252 855 268 263 132 15 2 246 037 1 4 0 274 265 • 41 276 26.8 103 30 2 123 0.18 0.70 305 295 10.5 306 29.7 112 5 ' 739 1.11 420 254 24.6 8.74 262 257 1X9 15 * 2.46 037 140 274 265 6.41 276 263 103 30 *I 123 0.18 0.70 305 29.5 105 306 29.7 112 6 1 739 1.11 4 2 0 255 24.7 8.77 262 255 13.0 15 1 246 037 1 4 0 274 265 • 41 276 265 103 30 1 123 0.18 0.70 305 29.5 105 306 29.7 112
a. May not equal sum of bus and automobile emissions due to rounding Source: Joel Horowitz, Air Quality Analysis, The MIT Press, 1982
service in the future cost approximately $400 million. Depending on the circumstances, light rail lines cost hundreds of millions of dollars, and can often reach the one billion dollar level (such as the current estimate for the Houston light rail line). Numerous other improvements such as placing bus shelters along bus routes, instituting regional fare structures, employer-based marketing, private sector provided incentives, better signage, improved service monitoring and analysis, convenient information services, or effective marketing efforts, however, cost much less.
Traditional transit investments as an exclusive strategy to reduce emissions may be very costly. In only rare circumstances can bus services be provided for less than $30 per hour for operations costs, and costs in larger urban transit systems are often much greater than this amount. One of the characteristics of transit investment that help local areas fund investments is the availability of federal funds for capital investment and for some operations costs. There are insufficient funds, however, to provide the needed federal assistance to all the transit agencies for all of the projects which have typically been desired. One of the important challenges facing transit agencies is establishing a stable and continuous funding base for their operations. Many systems are currently facing serious problems maintaining their existing transit services, thus causing great reluctance on their part to expand services. Funding sources that are dependent on market conditions, such as sales tax revenues, fluctuate in response to the regional economy. In the absence of alternative sources of funding, one of the ways transit agencies usually deal with these shortfalls is to raise fares, usually causing some loss of ridership.
Some transit agencies have turned to private sector sources for funds to be used on specific projects. There are many examples where developers and employers have provided funds, in-kind services, or land donations to support a transit project. Even with this type of support, the investment requirements for projects like light rail lines or extensive expansion of bus services will most likely come from public sources, and thus be subject to the political and institutional risks associated with obtaining such com mitments. Thus, the transit community faces a dual challenge: to evolve services to meet the mobility needs of developing communities, and to generate the political and public support required to serve a much larger share of the nation's mobility needs.
Markets Served
Transit improvements can be targeted to serve a wide variety of markets. Through flexible, paratransit-type of options and working with employers, suburban commute markets can be served. The suburb-to-center city market can be easily served in that this is the traditional strength of transit agencies. The suburb-to-suburb non-work trip is not as easily served with traditional services, however, without tremendous costs been in curred. The widely dispersed household locations combined with the widely dispersed activity centers would require a fairly costly service to handle these types of trips. Therefore, new types of transit services and linkages with traditional transit service must be developed.
As mentioned previously, an important approach to identifying appropriate markets is market segmentation. By identifying important behavioral characteristics of potential