www.realinstitutoelcano.org ISSN: 2255-5293
ELCANO GLOBAL
PRESENCE REPORT 2015
ILIANA OLIVIÉ
CAROLA GARCÍA-CALVO
MANUEL GRACIA
(Coords.)
1 112
1. Slower globalization and a
re-concentration of global presence
Iliana Olivié and Manuel Gracia3. Europe’s global economic presence
vis-à-vis the emerging markets
Miguel Otero-Iglesias
Europe down, BRICS up, and N11 square
CONTENTS
23
36
2. From global to local: the architecture of the
European Union’s external projection
Iliana Olivié and Manuel Gracia
The European Union leads the global presence ranking (for now)
How is that presence built? The relative contribution of member states to the Union’s external projection
Europe by regions. The contribution of autonomous communities to Spain’s global presence
58
49
66
4. The role of Asia in globalization: much
more than just China and economics
Mario Esteban6. Measuring soft presence through news
wire services
Ángel Badillo and Manuel Gracia
Why news agencies? News wires and the geopolitics of information Case study: world news through the agencies’ eyes
Presence by countries
5. A comparative analysis of foreign-policy
strategies and global presence: the cases
of Australia and South Africa
Carola García-Calvo
Towards a prosperous Australia: the ‘competitive liberalization’ of markets
The South African case: can regional leadership lead to a stronger global influence?
76
Methodological annex
Main elements of the Elcano Global Presence Index
The inclusion of the European Union in the Elcano Global Presence Index The contribution of each member to the European Union’s global presence The contribution of autonomous communities to Spain’s global presence
LIST OF TABLES AND GRAPHS
Page 13 Graph 1.1 2014 global presence ranking
Page 14 Table 1.1 2014 global presence ranking and variations since 2013
Page 17 Table 1.2 2014 European presence ranking and variations since 2013
Page 18 Graph 1.2 United Kingdom’s and Germany’s global presence index (2005-2014)
Page 18 Graph 1.3 2014 economic presence ranking (top 20)
Page 19 Graph 1.4 2014 military presence ranking (top 20)
Page 20 Graph 1.5 2014 soft presence ranking (top 20)
Page 21 Graph 1.6 Aggregated global, economic, military, and soft presence (1990-2014)
Page 21 Graph 1.7 Herfindahl-Hirschman Index (HHI) of concentration, by dimensions (2013-2014)
Page 22 Graph 1.8 Herfindahl-Hirschman Index (HHI) of concentration, by dimensions and sub-periods
(1990-2014)
Page 24 Graph 2.1 2014 global presence top 20 (including the EU and excluding its member states)
Page 24 Graph 2.2 Major positive global presence variations 2013-2014 (including the EU and excluding its member states)
Page 25 Graph 2.3 Negative global presence variations 2013-2014 (including the EU and excluding its member states)
Page 26 Graph 2.4 Major variations of global presence 2005-2014 (including the EU and excluding its member states)
Page 26 Graph 2.5 United States and EU 2014 global presence by dimension
Page 27 Table 2.1 EU 2014 global presence by member state (in %)
Page 28 Table 2.2 Variations in contributions to the EU’s global presence by member states (2005-2014, percentual points)
Page 28 Table 2.3 Economic contributions of member states to the EU’s 2014 global presence (in %)
Page 29 Table 2.4 Variations in economic contributions by member states to the EU’s global presence (2005-2014, percentual points)
Page 30 Table 2.5 Military contributions of member states to the EU’s 2014 global presence (in %)
Page 31 Table 2.6 Soft contributions of member states to the EU’s 2014 global presence (in %)
Page 31 Table 2.7 Variations in soft contributions by member states to the EU’s global presence (2005-2014, percentual points)
Page 32 Graph 2.6 Contributions by member states and variables to the EU’s 2014 global presence (in %)
Page 33 Table 2.8 Ranking of contributions by autonomous communities to Spain’s 2014 global presence (in %)
Page 34 Table 2.9 Variations of contributions by autonomous communities to Spain’s global presence (2005-2014)
Page 35 Graph 2.7 Contributions by autonomous communities and variables to Spain’s 2014 global presence (in %)
Page 37 Graph 3.1 Global presence shares (1990-2014)
Page 38 Graph 3.2 Economic presence shares (1990-2014)
Page 38 Graph 3.3 Contributions of economic presence (1990-2014)
Page 39 Table 3.1 Economic presence ranking (1990-2014)
Page 40 Graph 3.4 Energy presence (1990-2014, in index value)
Page 41 Graph 3.5 Primary goods presence (1990-2014, in index value)
Page 41 Graph 3.6 Manufactures presence (1990-2014, in index value)
Page 42 Graph 3.7 Services presence (1990-2014, in index value)
Page 42 Graph 3.8 Investments presence (1990-2014, in index value)
Page 43 Graph 3.9 Economic presence (1990-2014, in index value)
Page 44 Graph 3.10 Energy presence (1990-2014, in index value)
Page 44 Graph 3.11 Primary goods presence (1990-2014, in index value)
Page 45 Graph 3.12 Manufactures presence (1990-2014, in index value)
Page 45 Graph 3.13 Services presence (1990-2014, in index value)
Page 46 Graph 3.14 Investments presence (1990-2014, in index value)
Page 49 Table 4.1 Shares of global presence by region, and variations (1990-2014, in percentual points)
Page 50 Graph 4.1 Variations in share of presence, 1990 and 2014 (in percentual points)
Page 50 Graph 4.2 Weight by Asian country of global presence (in %)
Page 51 Graph 4.3 Variations in share of global presence 1990-2014 (in percentual points)
Page 52 Graph 4.4 Variations between 2011 and 2014 in Asian presence, by dimension (in percentual points)
Page 52 Graph 4.5 Major variations in shares of military presence between 1990 and 2014 (in percentual points)
Page 53 Table 4.2 Position in 2014 ranking of global presence overall, and by dimensions
Page 54 Table 4.3 Variations in ranking between 2013 and 2014
Page 55 Graph 4.6 Variations in share by dimension and by regional grouping (1990 and 2014, in percentual points)
Page 56 Graph 4.7 Major variations in shares of soft presence (1990-2014, in percentual points)
Page 56 Graph 4.8 Principal absolute variations in soft presence, 2013 and 2014
Page 60 Graph 5.1 Australia’s global presence contribution by dimension, 2014 (in %)
Page 61 Graph 5.2 Simple variation of economic and soft presence of Australia between periods (in index value)
Page 62 Graph 5.3 Leading variables contributing to Australia’s global presence, 2014 (in %)
Page 64 Table 5.1 Global presence ranking by dimensions for Sub-Saharan Africa, 2014
Page 65 Table 5.2 Sub-Saharan Africa’s global presence contribution by dimension, 2014 (in %)
Page 65 Graph 5.4 Nigeria and South Africa’s contribution to global presence by principal variables, 2014 (in %)
Page 69 Table 6.1 Main news wire services around the world (2014)
Page 70 Table 6.2 Proportion of yearly newswire items by service (2012-2014)
Page 71 Table 6.3 The 10 countries most cited by news agencies
Page 71 Table 6.4 Recent evolution of the presence of some countries in the news
Page 72 Graph 6.1 News items distributed by agencies mentioning Russia and Ukraine (2013-2014)
Page 73 Table 6.5 Information presence rankings based on infrastructure and news
Page 74 Table 6.6 Effect of information indicator changes on the overall index
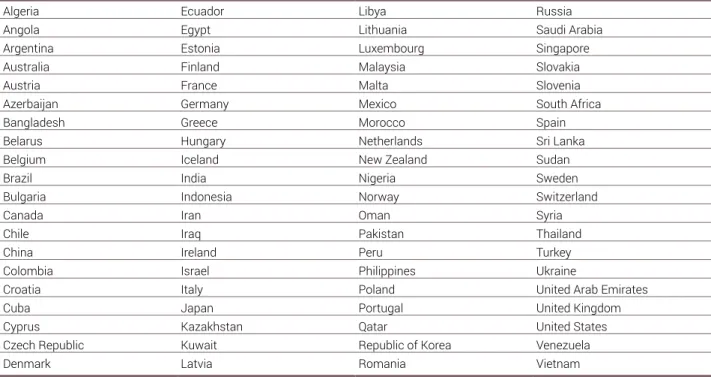
Page 78 Table A.1 Countries listed in the Elcano Global Presence Index
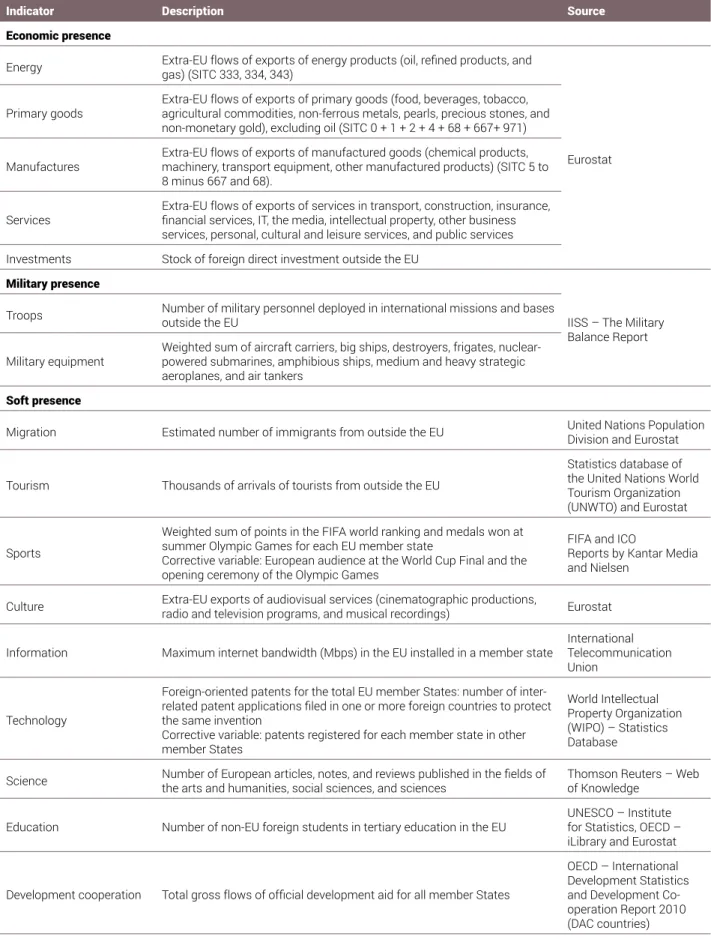
Page 79 Table A.2 Variables, indicators, and sources of the Elcano Global Presence Index
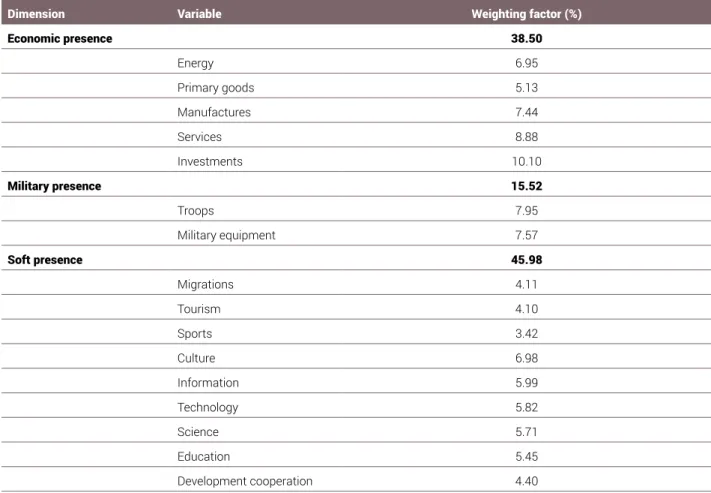
Page 80 Table A.3 Weighting factors of the different areas and indicators
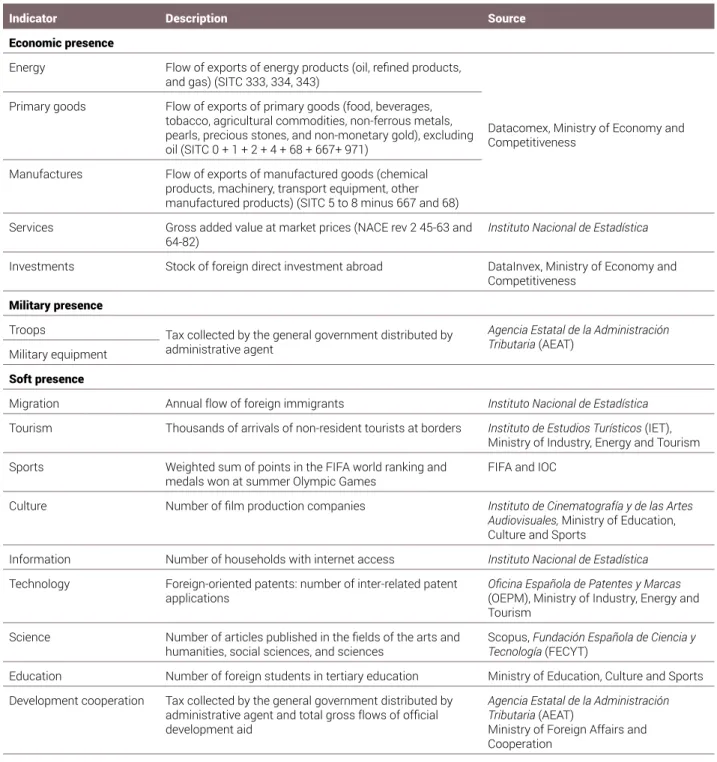
Page 82 Table A.4 Variables, indicators, and sources of the Elcano Global Presence Index calculated for the European Union
Page 87 Table A.5 Variables, indicators, and sources for calculating Spain’s global presence by autonomous communities
United Kingdom up one position, Germany down one
This year’s edition of the Elcano Global Presence Index ranks 80 countries according to the extent to which they are currently ‘out there’, participating in and shaping the process of globalization. Given that this index reflects mainly structural trends rather than short-term events, it comes as no surprise that there are virtually no changes within the top 10 positions of the 2014 ranking in relation to the previous year. The only relevant change is that the United Kingdom climbs one position to claim 2nd place, leaving Germany in 3rd. As a result, the new
top 5 starts with the United States (leading the ranking since 1990), followed by the United Kingdom, Germany, China, and France. It should be noted, however, that the up-scaling of the British position responds in large part to a massive sale of gold to Switzerland in 2013;
probably a one-time event, and one that might be insufficient for holding the country at its
current position in future editions of the index.
From global to local – domestic weaknesses and strengths and their impact on a country’s global presence
If we consider the European Union as a single global actor –adding together the global presence of its 28 members while subtracting their intra-European projection– this region
would top the global presence ranking. At 1,214.9 points, the combined figure for the entire
Union represents the result of relative contributions from all the member states to the aggregate global presence. The United Kingdom is the top contributor (at 19.8%), followed by Germany (16.9%) and France (14.7%), meaning that these three countries alone account for over half of total global presence by the European Union. These strong showings are the result of various national specializations and strengths: British investments, exports of services and primary goods, and development cooperation; German manufactures and
services; and French investments outside the Union’s boundaries. These profiles of presence
can also be disaggregated at the country level. In the case of Spain, the country’s external projection is to a great extent the result of international tourism in Catalonia, the Baleares, the Canary Islands, and Andalusia, alongside outward investments channelled through Madrid and export activities from Catalonia.
‘Chermany’, rather than Europe’s Big 5 versus the BRICS
As mentioned in previous editions, the index illustrates the upward trend toward a greater presence by emerging countries in the global arena, in parallel to a decline by Western (particularly European) powers. A closer look at these two groups (the European Big 5 and
the emerging BRICS) shows a significant level of concentration, in both groups, into a small
number of countries. In that respect, we might instead speak of the rise of ‘Chermany’, where Germany and China (leaders in their regions) may have been feeding one another’s global presence over the years. Such an analysis also reveals the differences between the global
presence profiles of these two groups of countries: Europe is still dominant in services and
investments, despite the spectacular rise of the BRICS, while the latter –mainly China– is dominant in manufactures exports.
Asia, much more than just China and the economy
The pre-eminence of China on the global scene and especially in the economic dimension doesn’t mean that this is the only emerging or Asian country with consistent participation in the globalization process, or that the internationalization of the Asian countries is limited to only the economic sphere. Data for the overall region show an upward trend in both the military and soft dimensions of presence. While increasing external presence in Asia’s military
domain responds mostly to the figures recorded by Japan and China, Asian soft presence is
scattered among various countries, with South Korea, Singapore, Thailand, and Malaysia all exhibiting increasing shares of soft presence over the 1990-2014 period.
Foreign policy and the global presence of Australia and South Africa
The Elcano Global Presence Index is also useful as a tool for assessing a county’s foreign policy. Are a country’s current foreign policies coping with weaknesses in that nation’s external projection? Are countries fully exploiting their potential? In the case of Australia, the
connection is evident: the shift toward an international economic profile with a liberal accent,
in a region that has become the epicentre of global economic activity, explains to some degree the fact that the economic dimension has become the dominant aspect of that country’s global presence. As for South Africa, its main strength and basis for exerting regional (or even
global) influence has been the relative diversification of its global presence around different
economic and soft variables; but that might be now challenged by the increasing presence of Nigeria, a country basing its global presence on exports of energy.
From an input to an output approach to the measurement of countries’ presence in terms of information
The current methodology of the index calculates the countries’ presence in the area of information using an input approach – recording the installed internet bandwidth. A new methodology could focus instead on the output: to what extent are countries present in the
international media? This figure can be calculated taking into account the relative presence
of all countries under study among items published through the main wire services, these being an important source of content for the rest of the communication sector. If we applied this criteria, selecting a small number of ‘big’ but diverse agencies –Agence France Presse, ANSA, Associated Press, Reuters, Deutsche Presse-Agentur, EFE, ITAR-TASS, and Xinhua– we would arrive at a different 2013 information ranking, with the top 5 positions held by the United States, Spain, Germany, China, and the United Kingdom.
1. Slower globalization and a re-concentration
of global presence
Iliana Olivié / Manuel Gracia1
This year’s edition of the Elcano Global Presence Index ranks 80 countries according to their external projection. Once again, the United States tops the ranking with an index value of 1,099.6 points. This is followed by the United Kingdom (404.9), Germany (400.5), China (363.5), and France (321.3). Spain ranks 11th , between Italy and Saudi Arabia, with a global presence value of 169.0 (graph 1.1).
Unlike in the previous edition, variations have emerged in the positions held by the top 10 countries. The United Kingdom has climbed one position (from 3rd place to 2nd), and Germany has dropped accordingly (from 2nd in 2013 to 3rd in 2014). While both countries
have gained global presence —the United Kingdom rising by 31.8 points, and Germany by 14.3— the United Kingdom’s increase in both relative and absolute terms has been higher than that of Germany (table 1.1).
Although there have been no major changes in the positions held by most countries, mild variations might show a change of trend as, in general terms, European countries are strengthening their positions while emerging countries are recording a certain setback. Note, for instance, that Belgium, Poland, Denmark, Ireland, Finland, Romania, Bulgaria, and Croatia gain one position each, Portugal gains two, Greece and Slovakia climb three, Luxembourg 4, and Hungary 5. On the other hand, South Korea, Turkey, Kuwait, and Chile lose one position, Nigeria two, Indonesia and Peru three, Venezuela 4, and Iran 5 (table 1.1). These results might be surprising, given that previous editions of this report highlight the emergence of the East and the decay of the West in terms of global presence – see, for instance, Olivié and Gracia (2013)2. This change of trend responds to different factors. In the first place, European countries record, in general terms, a recovery in the economic variables of external presence, particularly in the fields of manufactures and services. This
might mean that, for several cases, the external demand is gaining weight in relation to the domestic market. In parallel, oil-exporting countries are losing global presence in the energy variable; mainly due to the recent evolution of energy prices. This causes a drop of global presence in both absolute and relative terms for Indonesia, Nigeria, Kuwait, or Venezuela. As for Peru and Chile, the lower global presence of these two Latin American countries in 2014 is due to lower levels in the primary goods variable — again, partly as the result of the evolution of commodity prices (table 1.1).
1 Iliana Olivié, senior analyst and Manuel Gracia, research assistant at Elcano Royal Institute. 2 Olivié, Iliana and Manuel Gracia (2013), Elcano Global Presence Index 2012, Elcano Royal Institute.
1099.6 404.9 400.5 363.5 321.3 295.0 257.7 231.2 205.4 176.0 169.0 161.3 155.6 147.9 142.4 137.0 130.6 113.0 106.7 103.2 87.8 82.0 80.7 75.7 74.7 67.2 66.1 62.0 60.6 59.5 58.0 54.9 48.2 46.6 45.5 43.6 42.0 41.3 38.6 38.2 37.9 36.4 36.1 35.9 35.4 34.9 33.9 33.3 32.8 31.9 29.7 29.3 28.9 26.2 24.8 24.3 19.0 18.2 17.5 17.4 17.3 17.2 16.1 15.5 14.8 14.1 13.8 12.3 11.5 11.2 10.2 7.1 6.7 6.2 5.4 5.0 4.2 4.1 3.8 3.5 0 200 400 600 800 1000 1200 United States United Kingdom Germany China France Russia Japan Netherlands Canada Italy Spain Saudi Arabia Australia Belgium Republic of Korea United Arab Emirates India Singapore Brazil Switzerland Sweden Norway Mexico Malaysia Turkey Austria Thailand Poland Denmark Ireland Indonesia Qatar Luxembourg Kuwait Ukraine Nigeria Czech Republic South Africa Hungary Greece Iran Argentina Kazakhstan Venezuela Finland Portugal Iraq Chile Romania Israel Algeria Colombia Vietnam Angola New Zealand Egypt Oman Slovakia Philippines Libya Azerbaijan Peru Bulgaria Croatia Belarus Morocco Pakistan Lithuania Ecuador Cuba Slovenia Estonia Bangladesh Latvia Cyprus Iceland Sudan Malta Sri Lanka
As we will see in chapter 2, the global presence of the European Union in 2014 decreases with respect to 2013. This decrease concentrates in the economic dimension and responds to the lowered value of the euro in relation to the US dollar in December 2013 (with respect to late 2012). If European countries and member states have increased their global presence in 2013-2014 while the European Union as a whole lost global projection outside its boundaries, this may well indicate that member states have increased the intra-Union
orientation of their global presence in that same period, leading to an intensification of the
European integration process. This should result in an increase of most member states’ European presence index, which takes into account their external projection within the perimeter of the Union. And indeed, it does. Table 1.2 shows that most countries record
mild increases in European presence. In the case of Germany, this increase is significant –
almost 20 points.
Two important exceptions to this general trend are the United Kingdom and the Netherlands. The fact the Germany is increasingly Europe-oriented whereas the United Kingdom is deepening its extra- Union relations might partially explain the latter’s climb to 2nd position
in the global ranking, and Germany’s decline to 3rd. Still, Germany has recovered its 2012
level of global presence — its total external projection was 391.8 in 2012 and 400.5 in 2014.
TABLE 1.1.
2014 global presence ranking and variations since 2013 # Country global 2014 presence 2013 global presence Index value variation Position variation 1 United States 1099.6 1060.1 39.5 = 2 United Kingdom 404.9 373.1 31.8 +1 3 Germany 400.5 386.2 14.3 -1 4 China 363.5 341.4 22.1 = 5 France 321.3 315.2 6.1 = 6 Russia 295.0 290.0 4.9 = 7 Japan 257.7 256.7 1.0 = 8 Netherlands 231.2 213.1 18.0 = 9 Canada 205.4 205.2 0.2 = 10 Italy 176.0 171.8 4.3 = 11 Spain 169.0 164.2 4.8 = 12 Saudi Arabia 161.3 158.3 3.0 = 13 Australia 155.6 157.7 -2.1 = 14 Belgium 147.9 134.3 13.6 +1
# Country global 2014 presence 2013 global presence Index value variation Position variation 15 Republic of Korea 142.4 140.4 1.9 -1
16 United Arab Emirates 137.0 121.2 15.7 =
17 India 130.6 117.0 13.6 = 18 Singapore 113.0 112.5 0.5 = 19 Brazil 106.7 107.2 -0.5 = 20 Switzerland 103.2 100.4 2.9 = 21 Sweden 87.8 86.3 1.5 = 22 Norway 82.0 84.0 -2.0 = 23 Mexico 80.7 79.7 0.9 = 24 Malaysia 75.7 73.5 2.2 +1 25 Turkey 74.7 73.6 1.1 -1 26 Austria 67.2 63.4 3.8 = 27 Thailand 66.1 63.3 2.8 = 28 Poland 62.0 59.4 2.5 +1 29 Denmark 60.6 58.4 2.3 +1 30 Ireland 59.5 55.0 4.5 +1 31 Indonesia 58.0 60.3 -2.3 -3 32 Qatar 54.9 52.9 2.0 = 33 Luxembourg 48.2 44.5 3.7 +4 34 Kuwait 46.6 48.2 -1.7 -1 35 Ukraine 45.5 45.2 0.3 = 36 Nigeria 43.6 47.5 -3.9 -2 37 Czech Republic 42.0 41.3 0.7 -2 38 South Africa 41.3 42.2 -0.9 = 39 Hungary 38.6 36.7 1.9 +5 40 Greece 38.2 36.8 1.4 +3 41 Iran 37.9 44.7 -6.7 -5 42 Argentina 36.4 36.9 -0.5 = 43 Kazakhstan 36.1 38.1 -2.0 -2 44 Venezuela 35.9 39.1 -3.2 -4 45 Finland 35.4 34.1 1.3 +1 46 Portugal 34.9 33.1 1.9 +2 47 Iraq 33.9 35.6 -1.7 -2 48 Chile 33.3 33.3 0.0 -1 49 Romania 32.8 30.7 2.1 +1 50 Israel 31.9 30.3 1.6 +1 51 Algeria 29.7 31.8 -2.1 -2 52 Colombia 29.3 28.6 0.7 = 53 Vietnam 28.9 25.2 3.6 +2
The loss recorded by that country between 2012 and 2013 in economic variables —primary goods, manufactures, services— has recovered, as well as other soft elements such as
development cooperation. As for the United Kingdom, the significant 2013-2014 increase of
31.8 points comes due to the strengthening of its relations outside the European Union. The most important contribution to this increase is that of primary goods, which rises by 116%, followed by development cooperation (28.5%), tourism (12%), and investments (over 8%)
(graph 1.2). The significant increase of primary goods exports corresponds to the United
Kingdom’s exports of gold, mainly to Switzerland, in 20133. As this is probably a short-term
phenomenon, this upward trend might not continue in future editions of the global presence index.
3 ‘UK gold exports surge tenfold this year’, Financial Times, August 19th, 2013
http://www.ft.com/intl/cms/s/0/876af37c-08dd-11e3-ad07-00144feabdc0.html#axzz3RH9dCjPR # Country global 2014 presence 2013 global presence Index value variation Position variation 54 Angola 26.2 26.8 -0.6 = 55 New Zealand 24.8 24.3 0.5 +1 56 Egypt 24.3 26.9 -2.7 -3 57 Oman 19.0 18.6 0.4 +1 58 Slovakia 18.2 17.3 0.9 +3 59 Philippines 17.5 16.3 1.2 +4 60 Libya 17.4 23.8 -6.4 -3 61 Azerbaijan 17.3 17.7 -0.4 -1 62 Peru 17.2 18.1 -0.9 -3 63 Bulgaria 16.1 15.4 0.7 +1 64 Croatia 15.5 15.1 0.4 +1 65 Belarus 14.8 16.5 -1.7 -3 66 Morocco 14.1 13.7 0.4 +1 67 Pakistan 13.8 13.9 -0.1 -1 68 Lithuania 12.3 11.6 0.7 = 69 Ecuador 11.5 10.9 0.6 +1 70 Cuba 11.2 11.4 -0.2 -1 71 Slovenia 10.2 10.1 0.1 = 72 Estonia 7.1 6.9 0.1 = 73 Bangladesh 6.7 6.2 0.4 = 74 Latvia 6.2 5.9 0.3 = 75 Cyprus 5.4 5.2 0.2 = 76 Iceland 5.0 4.6 0.4 = 77 Sudan 4.2 3.0 1.2 +3 78 Malta 4.1 4.2 -0.1 -1 79 Sri Lanka 3.8 3.4 0.4 = 80 Syria 3.5 4.0 -0.5 -2
# Country 2014 european presence european2013 presence Index value variation 1 Germany 754.9 735.2 19.7 2 United Kingdom 688.5 700.1 -11.5 3 France 552.3 545.9 6.4 4 Netherlands 467.9 479.8 -11.8 5 Spain 344.9 340.6 4.4 6 Italy 309.3 311.3 -2.1 7 Belgium 302.7 295.1 7.6 8 Luxembourg 187.8 184.8 3.0 9 Sweden 160.7 161.1 -0.4 10 Austria 155.3 152.8 2.5 11 Ireland 125.2 125.0 0.2 12 Poland 120.1 115.0 5.2 13 Denmark 113.7 113.4 0.3 14 Czech Republic 91.7 91.8 -0.1 15 Hungary 86.5 86.9 -0.4 16 Greece 72.9 70.6 2.3 17 Portugal 69.6 65.7 3.9 18 Finland 68.1 64.5 3.6 19 Romania 47.6 42.9 4.7 20 Slovakia 37.0 36.2 0.8 21 Croatia 34.6 31.5 3.0 22 Slovenia 23.5 23.3 0.2 23 Bulgaria 23.0 22.5 0.5 24 Lithuania 21.7 22.1 -0.4 25 Estonia 14.1 13.8 0.3 26 Cyprus 10.9 10.7 0.2 27 Latvia 10.7 10.0 0.7 28 Malta 7.6 7.6 0.0 TABLE 1.2.
2014 European presence ranking and variations since 2013
264 330 360 392 386 401 239 296 334 375 373 405 200 250 300 350 400 2005 2010 2011 2012 2013 2014
Germany United Kingdom
165.6 173.9 209.4 217.4 218.7 228.3 228.7 237.6 280.2 287.9 300.0 314.8 323.2 373.1 438.2 464.0 470.5 591.7 603.9 1210.8 -100 100 300 500 700 900 1100 1300 Brazil Switzerland Spain Singapore Republic of Korea Australia Italy India Japan United Arab Emirates Belgium Canada Saudi Arabia France Netherlands United Kingdom Russia Germany China United States 2014 2013 GRAPH 1.2.
United Kingdom’s and Germany’s global presence index (2005-2014)
GRAPH 1.3.
2014 economic presence ranking (top 20)
By dimensions, the top 20 ranking for economic presence in 2014 shows important variations with respect to 2013. India surpasses Singapore, and Italy leaves Australia behind, as does
Belgium with Japan; China climbs one position to be ranked 2nd, leaving Germany in the 3rd
10.2 11.0 12.9 13.0 13.1 14.8 15.9 17.4 17.9 18.6 22.1 25.8 34.6 35.0 47.0 57.0 59.8 75.0 137.8 770.1 0 100 200 300 400 500 600 700 800 900 Saudi Arabia Bangladesh Singapore Turkey Australia Spain Canada Pakistan Brazil Indonesia Germany Republic of Korea India Italy Japan China France United Kingdom Russia United States 2014 2013 GRAPH 1.4.
2014 military presence ranking (top 20)
The most significant change in the top 20 ranking of military presence is the drawback of
Spain, which falls from the 9th position in 2013 to 15th in 2014. At the same time, Brazil falls
one position while South Korea and Indonesia climb by three and two, respectively — a
result that might confirm the militarization process of certain East Asian countries (graph
1.4).
Finally, in terms of the soft dimension, it should be noted that Germany, Spain, Italy, and Turkey all climb one position and Saudi Arabia two within the top 20 ranking by index value, while France, Belgium, and India lose one rank and Canada two (graph 1.5).
Last year’s edition showed a deceleration of the globalization process (Olivié et al., 2014)3.
1
Although 2014 data point to a mild recovery, the increase of the aggregated global presence
of all 80 countries remains significantly lower than the growth rates recorded in previous
periods (graph 1.6). Likewise, the stagnation of the globalization process might relate to a re-concentration of global presence (and of some of its dimensions) into a smaller number of countries. In fact, the re-concentration between 2013 and 2014 is stronger than that of the 2012-2013 period, as it affects not only economic presence but also military presence4
2and, as a result, total projection. This is shown by the Herfindahl-Hirschman Index (HHI) of concentration which increases to 7.5 for global presence in the last period. Currently, the only dimension continuing to trend toward de-concentration is soft presence, with an HHI score of -10 (graph 1.7). Despite these recent results, and given the intense degree of de-concentration seen in the early part of this decade, there appears to be, on average, a wider dispersion of both the economic and soft dimensions in the 2010-2014 period, although in the case of the economic presence this dispersion is much less intense than in previous periods (graph 1.8).
3 Olivié, Iliana; Manuel Gracia and Carola García-Calvo (2014), Elcano Global Presence Report 2014, Elcano Royal Institute.
4 It should be noted that a de-concentration of military presence occurred last year. This change of trend comes mainly due to the fact that many countries have followed the United States in the repatriation of troops, leading to a recovery of the United States’ historically high share of military presence.
73.0 75.6 80.0 80.6 88.8 97.6 100.0 119.9 137.5 145.1 181.0 181.6 189.3 204.6 271.5 312.4 369.6 374.1 470.8 1122.4 0 200 400 600 800 1000 1200 Belgium India Saudi Arabia Switzerland Brazil Sweden Turkey Republic of Korea Netherlands Australia Canada Italy Spain Russia China Japan France Germany United Kingdom United States 2014 2013 GRAPH 1.5.
7.5 17.8 55.7 -10.0 -20 -10 0 10 20 30 40 50 60
Global presence Economic presence Military presence Soft
presence 0 1000 2000 3000 4000 5000 6000 7000 8000 1990 1995 2000 2005 2010 2011 2012 2013 2014
Economic presence Military presence Soft presence
GRAPH 1.6.
Aggregated global, economic, military, and soft presence (1990-2014)
GRAPH 1.7.
Herfindahl-Hirschman Index (HHI)
of concentration, by dimensions (2013-2014)
-140.0 -120.0 -100.0 -80.0 -60.0 -40.0 -20.0 0.0 20.0 1990 -1995 1995 -2000 2000 -2005 2005 -2010 2010 -2014 Economic presence Soft presence GRAPH 1.8.
Herfindahl-Hirschman Index (HHI)
of concentration, by dimensions and sub-periods (1990-2014)
2. From global to local: the architecture of the
European Union’s external projection
Iliana Olivié / Manuel Gracia1
Previous analyses by Elcano Royal Institute (Molina (coord.) 2014)2 emphasize the link
between the domestic sphere of a country’s economic, political, and social systems and its international projection, as well as the relationship between internal and foreign policies. One way to assess the extent and shape of this complex link is by means of the Elcano Global Presence Index. This is true because synthetic indexes, such as the global presence index of the European Union overall, can be disaggregated, both from a sector approach (analysing the relative contribution of economic, military, or soft dimensions and variables) and with a geographical focus (taking into account the relative contribution of each member state to the Union’s total projection). As for each member state, both their own global and European presence and their contribution to the global presence of the European Union come as the result of the external projection of their regions and communities.
The aim of this section is to understand the global-local nexus, exemplified in the case of the
European Union; the relative contribution of member states to the Union’s global presence; and the geographical and sector composition of one particular European country, namely Spain.
The European Union leads the global presence ranking (for now)
In this edition as in previous, the European Union remains the political unit with the highest global presence. The total external projection of European Union member states outside the Union’s boundaries amounts to 1,214.9 in 2014 (graph 2.1). By this measure, the European Union has recorded a decrease (of 4.9 points) in global presence over the last year, as its global presence index amounted to 1,219.8 in 2013. This 0.4% decrease might not seem especially important, but it is in fact the 3rd sharpest drop recorded by any country or territory
during the past year. Iran tops this particular ranking with a decrease of 6.7 points, followed by Libya, which records a drop of 6.4 points (graph 2.3).
1 Iliana Olivié, senior analyst and Manuel Gracia, research assistant at Elcano Royal Institute
2 Molina, Ignacio (coord.) (2014), ‘Hacia una renovación estratégica de la política exterior española’, Informes Elcano 15, Elcano Royal Institute.
39.5 22.1 15.7 13.6 4.9 3.6 3.0 2.9 2.8 2.2 2.0 1.9 1.6 1.2 1.2 1.1 1.0 1.0 0.7 0.6 United States China United Arab Emirates India Russia Vietnam Saudi Arabia Switzerland Thailand Malaysia Qatar Republic of Korea Israel Philippines Sudan Turkey Japan Mexico Colombia Ecuador 1.214.9 1.099.6 363.5 295.0 257.7 205.4 161.3 155.6 142.4 137.0 130.6 113.0 106.7 103.2 82.0 80.7 75.7 74.7 66.1 58.0 European Union United States China Russia Japan Canada Saudi Arabia Australia Republic of Korea United Arab Emirates India Singapore Brazil Switzerland Norway Mexico Malaysia Turkey Thailand Indonesia GRAPH 2.1.
2014 global presence top 20
(including the European Union and excluding its member states)
GRAPH 2.2.
Major positive global presence variations 2013-2014
(including the European Union and excluding its member states)
-0.5 -0.5 -0.5 -0.6 -0.9 -0.9 -1.7 -1.7 -1.7 -2.0 -2.0 -2.1 -2.1 -2.3 -2.7 -3.1 -3.9 -4.9 -6.4 -6.7 Argentina Syria Brazil Angola South Africa Peru Iraq Kuwait Belarus Norway Kazakhstan Australia Algeria Indonesia Egypt Venezuela Nigeria European Union Libya Iran GRAPH 2.3.
Negative global presence variations 2013-2014 (including EU and excluding its member states)
This trend contrasts with that of other countries, including the United States (whose global presence increased by 39.5 points between 2013 and 2014), China (rising 22.1 points), and other emerging economies and middle or regional powers such as United Arab Emirates (15.7 points), India (13.6), Russia (4.9), Vietnam (3.6), or Saudi Arabia (3.0) (graph 2.2). The global presence gap between the European Union and the United States has decreased from 159.7 points in 2013 to 115.0. This is due to a large extent to dollar-euro exchange rate variations, with the euro recording a lower value in 2013 with respect to 2012. This movement has a negative impact on Eurozone countries as well as on countries with national currencies pegged to the euro. However, it should be noted that the European Union is the territory that has recorded the highest increase of total global presence since 2005,
the first year for which we calculate European external projection. During the 2005-2014
period, the European Union’s global presence has increased by 457 points, compared to 314 points in the case of the United States and 213 for China (graph 2.4).
457.3 313.9 213.3 138.7 94.3 85.4 82.2 73.6 70.2 68.8 68.0 64.0 62.9 51.7 43.2 39.2 38.9 38.2 32.5 31.4 European Union United States China Russia United Arab Emirates India Saudi Arabia Australia Canada Republic of Korea Brazil Singapore Japan Switzerland Qatar Turkey Malaysia Thailand Indonesia Norway European Union Economic presence Military presence Soft presence 45.1% 2.7% 52.2% 42.4% 10.8% 46.8% United States Economic presence Military presence Soft presence GRAPH 2.4.
Major variations of global presence 2005-2014
(including the European Union and excluding its member states)
GRAPH 2.5.
United States and European Union 2014 global presence by dimension
As for the features of the European Union’s global presence, as pointed out previously (Olivié et al., 2014)3, it is mostly based on the soft dimension (which account for 52% of
total global presence) and economic variables (45%). Military presence accounts for less
than 3% of European external projection. These figures contrast with the United States’
global presence composition; despite the decrease in military variables in the 2012-2013 period, this dimension still represents over 10% of the country’s total presence. As with
the European Union, the most significant dimension for the United States is soft presence,
followed by economic (graph 2.5).
How is that presence built? The relative contribution of member states to the Union’s external projection
Besides its sector composition, the European Union’s global presence can be analysed geographically. It is possible to calculate to what extent each of the 28 member states contribute to total external projection of the whole territory. Data for 2014 show that the United Kingdom is the main contributor to European global projection, followed by Germany, France, Italy, the Netherlands, and Spain. The three top countries account for over 51% of European global presence (table 2.1). This ranking has not recorded major changes over the last decade. Actually, the top 9 spots in 2014 continue to be held by the same countries –in the same positions– as in 2005.
Although the United Kingdom has been strengthening its position since 2005, with an increase of 0.7 points in its contribution to the European Union’s global presence, other major member states record the opposite trend. Noteworthy are the two countries whose contribution decreased most in the 2005-2014 period: Germany (by 1.9 points) and France (1.2) (table 2.2).41
The ranking of economic contributions of member states to the European Union’s global presence shows a similar picture. Five big economies top the ranking: the United Kingdom (9.3% of global presence), Germany (7.8%), France (5.4%), the Netherlands (4.2%), and Italy
(3.2%) (table 2.3). Moreover, the first three contributors account for approximately half of the
aggregated economic contribution to global presence. This might also reflect their capacity
to reorient their exports outside the European Union in a period of financial and economic
crisis.
4 It should be noted that the significant increases recorded by Romania, Bulgaria, and Croatia are due to the fact that these countries
were not part of the European Union in 2005. Therefore, starting from 0 in 2005, the increase equals the index value in 2014.
# Country Contribution Country Contribution
1 United Kingdom 19.8% 15 Finland 1.4%
2 Germany 16.9% 16 Portugal 1.2%
3 France 14.7% 17 Romania 1.2%
4 Italy 7.5% 18 Czech Republic 1.1%
5 Netherlands 6.9% 19 Luxembourg 0.7% 6 Spain 6.6% 20 Croatia 0.6% 7 Belgium 3.5% 21 Bulgaria 0.6% 8 Sweden 3.5% 22 Slovakia 0.5% 9 Denmark 2.5% 23 Lithuania 0.5% 10 Poland 2.2% 24 Slovenia 0.4% 11 Ireland 2.2% 25 Latvia 0.4% 12 Austria 1.8% 26 Estonia 0.3% 13 Greece 1.4% 27 Cyprus 0.2% 14 Hungary 1.4% 28 Malta 0.2% TABLE 2.1.
# Country Contribution Country Contribution
1 Romania 1.2% 15 Netherlands 0.0%
2 United Kingdom 0.7% 16 Estonia 0.0%
3 Croatia 0.6% 17 Malta 0.0% 4 Bulgaria 0.6% 18 Sweden 0.0% 5 Ireland 0.6% 19 Slovakia 0.0% 6 Poland 0.4% 20 Belgium -0.1% 7 Spain 0.4% 21 Finland -0.2% 8 Luxembourg 0.3% 22 Latvia -0.2% 9 Portugal 0.2% 23 Italy -0.2% 10 Lithuania 0.1% 24 Hungary -0.2%
11 Czech Republic 0.1% 25 Austria -0.3%
12 Cyprus 0.0% 26 Greece -0.5%
13 Denmark 0.0% 27 France -1.2%
14 Slovenia 0.0% 28 Germany -1.9%
# Country Contribution Country Contribution
1 United Kingdom 9.3% 15 Luxembourg 0.4%
2 Germany 7.8% 16 Portugal 0.4%
3 France 5.4% 17 Hungary 0.3%
4 Netherlands 4.2% 18 Romania 0.3%
5 Italy 3.2% 19 Czech Republic 0.3%
6 Spain 2.9% 20 Bulgaria 0.2% 7 Belgium 2.3% 21 Lithuania 0.2% 8 Sweden 1.5% 22 Croatia 0.1% 9 Ireland 1.5% 23 Slovenia 0.1% 10 Denmark 1.2% 24 Slovakia 0.1% 11 Austria 0.8% 25 Latvia 0.1% 12 Greece 0.7% 26 Estonia 0.1% 13 Poland 0.6% 27 Cyprus 0.1% 14 Finland 0.6% 28 Malta 0.0% TABLE 2.2.
Variations in contributions to the European Union’s global presence by member states (2005-2014, percentual points)
TABLE 2.3.
Economic contributions of member states to the European Union’s 2014 global presence (in %)
# Country Contribution Country Contribution
1 United Kingdom 1.4 15 Greece 0.1
2 Spain 1.0 16 Lithuania 0.1
3 Germany 0.9 17 Austria 0.1
4 Netherlands 0.9 18 Sweden 0.1
5 Ireland 0.6 19 Latvia 0.0
6 France 0.5 20 Czech Republic 0.0
7 Italy 0.4 21 Hungary 0.0 8 Romania 0.3 22 Estonia 0.0 9 Bulgaria 0.2 23 Slovakia 0.0 10 Poland 0.2 24 Malta 0.0 11 Denmark 0.2 25 Cyprus 0.0 12 Portugal 0.1 26 Belgium 0.0 13 Luxembourg 0.1 27 Slovenia 0.0 14 Croatia 0.1 28 Finland -0.1 TABLE 2.4.
Variations in economic contributions by member states to the European Union’s global presence (2005-2014, percentual points)
However, the evolution of economic contributions to global presence has been different from that of global contributions. Firstly, most countries have increased their economic contribution to global presence –meaning an increased importance of the economic dimension in the external projection of the European Union. In fact, all member states but Finland have increased their contribution in the 2005-2014 period (table 2.4). Secondly, the most important variations are those of bigger –economically, demographically– member states. The United Kingdom, Spain, Germany, the Netherlands, and Ireland top that ranking (table 2.4).
Military contributions reflect a similar picture. France (with a military contribution of 0.7% of the European Union’s global presence), the United Kingdom (0.6%), Italy (0.4%), Germany (0.3%), and Spain (0.2%) top the ranking. As usual, the military dimension shows a higher degree of concentration in a few member states. France, the United Kingdom, and Italy account for 1.7% of the aggregated 2.7% military contribution by all 28 member states to the European Union’s total external projection (table 2.5).
Again, the soft dimension ranking holds a strong parallelism with both global and economic contributions to the European Union’s global presence. The top 4 countries are the same. The United Kingdom’s soft dimension accounts for 9.9% of total European Union external projection. Germany is in 2nd place (8.8%), followed by France (8.5%), and Italy (3.9%). Spain holds the 5th position. It should be noted that Spain is the 8th global contributor to the
European Union’s global presence index (table 2.1), reflecting the soft profile of the country
– a feature that has been highlighted in previous reports (Olivié et al., 2013 and 2014). Again, the top three countries account for over half the contributions of all member states (table 2.6).
As a result, 49.7% of European Union global presence can be ascribed to British, German, and French economic and soft projection outside the European boundaries. Therefore, those three countries are key to the European Union’s role as a global actor. The importance of these three countries is also evident in graph 2.6, which plots major contributions to the European Union’s global presence by variables and by country.
# Country Contribution Country Contribution
1 France 0.7% 15 Austria 0.0%
2 United Kingdom 0.6% 16 Ireland 0.0%
3 Italy 0.4% 17 Sweden 0.0% 4 Germany 0.3% 18 Slovenia 0.0% 5 Spain 0.2% 19 Slovakia 0.0% 6 Netherlands 0.1% 20 Finland 0.0% 7 Latvia 0.1% 21 Hungary 0.0% 8 Greece 0.1% 22 Lithuania 0.0% 9 Rumania 0.1% 23 Luxembourg 0.0% 10 Poland 0.0% 24 Croatia 0.0% 11 Denmark 0.0% 25 Estonia 0.0%
12 Portugal 0.0% 26 Czech Republic 0.0%
13 Bulgaria 0.0% 27 Malta 0.0%
14 Belgium 0.0% 28 Cyprus 0.0%
TABLE 2.5.
Military contributions of member states to the European Union’s 2014 global presence (in %)
# Country Contribution Country Contribution
1 United Kingdom 9.9% 15 Finland 0.8%
2 Germany 8.8% 16 Portugal 0.7% 3 France 8.5% 17 Greece 0.7% 4 Italy 3.9% 18 Ireland 0.6% 5 Spain 3.5% 19 Croatia 0.5% 6 Netherlands 2.6% 20 Slovakia 0.4% 7 Sweden 1.9% 21 Bulgaria 0.3% 8 Poland 1.5% 22 Luxembourg 0.3% 9 Denmark 1.2% 23 Slovenia 0.3% 10 Belgium 1.2% 24 Lithuania 0.3% 11 Hungary 1.1% 25 Estonia 0.2% 12 Austria 1.0% 26 Latvia 0.2%
13 Czech Republic 0.8% 27 Malta 0.2%
14 Romania 0.8% 28 Cyprus 0.2%
# Country Contribution Country Contribution
1 Romania 0.8% 15 Malta -0.1%
2 United Kingdom 0.5% 16 Slovakia -0.1%
3 Croatia 0.5% 17 Finland -0.1%
4 Bulgaria 0.3% 18 Sweden -0.1%
5 Poland 0.2% 19 Latvia -0.1%
6 Luxembourg 0.1% 20 Denmark -0.2%
7 Czech Republic 0.1% 21 Hungary -0.2%
8 Portugal 0.1% 22 Spain -0.4% 9 Ireland 0.0% 23 Austria -0.4% 10 Lithuania 0.0% 24 Greece -0.5% 11 Cyprus 0.0% 25 Italy -0.6% 12 Slovenia 0.0% 26 Netherlands -0.8% 13 Belgium 0.0% 27 France -0.9% 14 Estonia -0.1% 28 Germany -2.6% TABLE 2.6.
Soft contributions of member states to the European Union’s 2014 global presence (in %)
TABLE 2.7.
Variations in soft contributions by member states to the European Union’s global presence (2005-2014, percentual points)
Europe by regions. The contribution of autonomous communities to Spain’s global presence
For countries with regionally disaggregated statistical information –such as Germany, the United States, the United Kingdom, or Spain– it is possible to calculate the contribution of sub-national regions (autonomous communities in the case of Spain) to the aggregate global presence of the country in question.
As shown in previous analyses (Olivié and Gracia, 2014)4
1, since 1990, Spain’s global presence has recorded a rapid increase in relative terms, well above that of other countries such as the United States or Portugal. However, a detailed analysis shows weaknesses and disequilibria in the features of this projection – concentration in tourism or sports, and lower contributions of technology or education to aggregated presence. In analysing Spain’s
global presence with a geographical approach, we may arrive at a regional profile of these
strengths and weaknesses.
The autonomous community that contributes most to Spain’s global presence is Catalonia, with a share of almost 22% of Spanish global presence. This is followed by Madrid, Andalusia, Valencia, and the Basque country. Those 5 communities account for almost 70% of Spain’s total presence. At the other extreme, the 5 communities that contribute the least are the non-contiguous cities of Melilla and Ceuta as well as la Rioja, Extremadura, and Navarre (table 2.8).
4 Olivié, Iliana and Manuel Gracia (2014), ‘La inserción exterior de España requiere una redefinición estratégica’ Estrategia Exterior
3.1%2.8% 2.6% 2.4% 2.2% 2.0% 2.0% 2.0% 1.8% 1.6% 1.5% 1.5% 1.4% 1.4% 1.4% 70.2% UK - investments Germany - manufactures UK - Services UK - Primary goods UK - Development Cooperation Germany - Services France - Investments
Germany - Development Cooperation Germany - Investments
France - Development Cooperation UK - Education Germany - Science UK - Culture France - Education UK - Science Rest GRAPH 2.6.
Contributions by member states and variables to the European Union’s 2014 global presence (in %)
As with the global presence of countries, there seems to be a strong correlation between the size of a territory (autonomous community, country, group of countries) in geographic, demographic, and/or economic terms and its capacity to project itself outside its boundaries. In general terms, the contribution of each autonomous community to Spain’s global presence is aligned with its contribution to total GDP (table 2.8).
However, some communities are more outward-oriented, as their contribution to national global presence is higher than their share of national GDP. This is the case for Catalonia, Madrid, the Canary islands, the Balearic islands, Murcia, and Cantabria. In some cases, like the Basque country, the share of global presence is only slightly higher than the share of GDP. In others, the participation in the country’s global presence almost doubles its contribution to the size of the economy. This is the case for the Canaries and Baleares – two important destinations for international tourism.
Moreover, there is a strong concentration of Spain’s global presence into just two autonomous communities, Catalonia and Madrid. These two account for over 41% of Spanish global presence – slightly over their participation in national GDP, which amounts to just under 38%.
Autonomous community % Spain's global presence % GDP
Catalonia 21.59% 18.9% Madrid 19.50% 18.0% Andalusia 12.87% 13.5% Valencia 8.95% 9.5% Basque Country 5.95% 6.2% Canaries 5.70% 3.8% Galicia 4.92% 5.4% Baleares 4.70% 2.6%
Castille and Leon 2.99% 5.2%
Murcia 2.86% 2.6% Aragon 1.95% 3.2% Cantabria 1.85% 1.2% Castille-La Mancha 1.79% 3.5% Asturias 1.65% 2.1% Navarre 1.35% 1.7% Extremadura 0.86% 1.6% Rioja 0.43% 0.8% Melilla 0.04% 0.1% Ceuta 0.04% 0.1% TABLE 2.8.
Ranking of contributions by autonomous communities to Spain’s 2014 global presence (in %)
As pointed out in previous studies, the global presence index aims at reflecting structural trends. In this sense, short-term elements scarcely have an impact on global presence
values. This is probably why there have been no significant variations in the contributions of
each autonomous community to Spain’s global presence over the 2005-2013 period (table 2.9). Catalonia records a small decrease (of 0.85 points) in its contribution, and Madrid a
mild increase (0.63 points). Some communities have recorded more significant variations,
like Baleares (whose contribution decreases by 1.22 points) or Murcia and the Basque country (recording an opposite trend, up by 1.03 and 1.19 points, respectively).
The strengths of Spanish global presence are the country’s exports of primary goods and its capacity to attract international tourists. This being the case, we should expect that the autonomous communities that contribute most to the country’s external projection are agricultural producers and tourist destinations. Apart from very important contributions by Catalonia and Madrid, other poles of international tourism such as Andalusia or the Balearic and Canary islands boast important participation in the country’s global presence. Similarly, Murcia contributes a higher proportion to global presence than to Spain’s GDP as a result of
its significant production and export of primary goods (table 2.8).
The distribution of Spain’s global presence in terms of both variables and autonomous communities gives evidence to the low added value of the country’s external projection. Outward direct investment channelled through Madrid explains just over 5% of aggregated presence, and the fact that the capital is located here, along with a large share of corporate
TABLE 2.9.
Variations of contributions by autonomous communities to Spain’s global presence (2005-2014)
Autonomous community 2014 2005 2005-2014 var.
Andalusia 12.87% 12.83% 0.03 Aragon 1.95% 2.19% -0.24 Asturias 1.65% 1.48% 0.17 Baleares 4.70% 6.17% -1.47 Canaries 5.70% 6.46% -0.76 Cantabria 1.85% 1.60% 0.25
Castile and Leon 2.99% 3.24% -0.25
Castile-La Mancha 1.79% 1.48% 0.32 Catalonia 21.59% 22.44% -0.85 Ceuta 0.04% 0.02% 0.02 Valencia 8.95% 9.29% -0.33 Extremadura 0.86% 0.82% 0.04 Galicia 4.92% 4.42% 0.50 Madrid 19.50% 18.87% 0.63 Melilla 0.04% 0.02% 0.02 Murcia 2.86% 1.98% 0.89 Navarre 1.35% 1.19% 0.16 Basque country 5.95% 5.05% 0.90 Rioja 0.43% 0.47% -0.04
5.01% 4.93% 3.51% 3.36% 3.35% 2.97% 2.49% 2.42% 2.34% 2.25% 67.38% Madrid - Investments Catalonia - Tourism Baleares - Tourism Canaries - Tourism Madrid - Services Catalonia - Services Andalusia - Tourism Andalusia - Primary goods Catalonia - Manufactures Catalonia - Primary goods Rest
GRAPH 2.7.
Contributions by autonomous communities and variables to Spain’s 2014 global presence (in %)
headquarters, helps to explain this phenomenon. As for Catalonia, its exports of manufactures account for 2.2% of Spanish global presence. However, the bulk of major contributions by variable and community –those that represent at least 2% of aggregate global presence– are of lower added value. Tourism to Catalonia, the Baleares, the Canaries, and Andalusia account for 14% of global presence. Exports of primary goods from Andalusia and Catalonia represent 4.6% of Spain’s external projection. As for exports of services (including different levels of technological complexity) from Madrid and Catalonia, these contribute to 6.1% of total global presence (graph 2.7).
3. Europe’s global economic presence
vis-à-vis
the emerging markets
Miguel Otero-Iglesias1
In the aftermath of the global financial and economic crisis (2007-09), and the subsequent
European debt crisis (2009-ongoing), many scholars and pundits have claimed that Europe is inexorably in decline, and that economic and, consequently, political power is shifting from the West, especially from Europe, to the East, primarily to China.2 Others, however,
have contested this analysis, pointing to the fact that Europe is still one of the most wealthy trading and investment blocs, and hence arguing that its apparent decline is overstated.3 In
this chapter I will try to provide some empirical evidence to that debate.
By using the Big 5 European economies (Germany, United Kingdom, France, Italy, and Spain, henceforth EB5) as a proxy for European global economic presence, I have employed the empirical data from the Elcano Global Presence Index from 1990 until 2014 to compare their performance with what are generally the groupings most cited when describing the increased global presence of emerging markets: the BRICS (Brazil, Russia, India, China, and South Africa) and the Next 11 (Bangladesh, Egypt, Indonesia, Iran, South Korea, Mexico, Nigeria, Pakistan, Philippines, Turkey, and Vietnam, henceforth N11).4
The data show that the Big 5 European economies have lost considerable ground in their share of world economic presence. Nonetheless, when we desegregate the data, we discover a number of peculiarities. The BRICS have closed the gap with the EB5 much more than the N11 have done, making the BRICS more interesting to analyse. Furthermore, within the BRICS, the out-performer (and hence outlier) is China; thus it could be argued that the rise of the rest might be better described as the rise of China. Interestingly, in recent years India has also performed well, and it could potentially become the new star of the BRICS. Russia, by contrast, has reached a plateau and might even reverse its gains.
1 Senior analyst at the Elcano Royal Institute. I would like to express my gratitude to Manuel Gracia for helping me with the graphs in this chapter.
2 Mahbubani, Kishore (2008), The New Asian Hemisphere: The Irresistible Power Shift to the East, New York, Public Affairs. Quah, Danny (2011), ‘The Global Economy´s Shifting Centre of Gravity’, Global Policy 2(3), 3-9. For a review of the literature see Cox, Michael (2012) ‘Power Shifts, Economic Change and the Decline of the West’, International Relations 26(4), 369-388.
3 Moravcsik, Andrew (2013), ‘Why Europe is the other Superpower in the 21st Century (and China is Not)’, paper presented at Johns
Hopkins School of Advanced International Studies, Baltimore, September 6.
4 Both concepts, the BRIC and the N11, were coined by Jim O’Neill, the chief economist of Goldman Sachs, in 2001 and 2005, respecti
Differences also exist within the EB5. Here the out-performer is without a doubt Germany. In this regard, the analysis presented here shows that over the past 25 years, the two champions of global economic presence within the EB5 and the BRICS are Germany and China, respectively. The complementarities of their economies have certainly helped to enhance their performance, which explains why their political leaders have recently invested so much political capital in strengthening their bilateral relationship.5 China and Germany
feed each other in economic presence.
Within the EB5, the United Kingdom has also shown considerable dynamism over recent years, and it is (after Germany) the 2nd best performer in the group. Despite being generally
described as stagnant, France has not done too badly — certainly better than Italy and Spain, which have recently been overtaken by India. Within the BRICS, the laggards are Brazil and South Africa, and especially the latter, which has barely increased its global economic presence over the past quarter of a century.
Europe down, BRICS up, and N11 square
When observing graphs 3.1 and 3.2, one can see that the EB5 have lost ground both in
general global presence and, specifically, in global economic presence. Not surprisingly, this loss of share has been more pronounced in the economic field, where both the BRICS and
the N11 are strongest, since roughly 60% of their global presence relies on this indicator (see graph 3.3 on the contribution of economic presence in overall presence). While in 1990 the share of general global presence of the EB5 was 24.2%, by 2014 it had decreased to 20.8%. This drop was even starker in economic presence, with the share falling 9 points from 26.9 to 17.9%.
5 Kundnani, Hans and Jonas Parello-Plesner (2012), ‘China and Germany: Why the Emerging Special Relationship Matters for Europe’,
Policy Brief ECFR 55, ECFR, May.
24.2% 24.0% 23.0% 20.8% 15.1% 8.4% 11.2% 13.2% 5.0% 6.4% 7.1% 7.5% 0.0% 5.0% 10.0% 15.0% 20.0% 25.0% 30.0% 1990 1995 2000 2005 2010 2011 2012 2013 2014
European Big 5 BRICS N 11
GRAPH 3.1.
Graph 3.2 also shows that the BRICS have over the past few years caught up much more forcefully with the EB5 than has the N11. While the BRICS went from a share of 6.1% in 1990 to 14.7% in 2014, the N11 increased only from 6.6% (a higher share than the BRICS at that time) to 8%. This may explain why since the term was coined, the concept of the N11 has drawn much less attention than that of the BRICS. Table 3.1, which shows changes in position within the economic presence ranking, helps us to understand this circumstance. Here one can see how, of the N11 countries, only South Korea and Turkey have moved up the ranks, with the former doing considerably better than anyone else in the grouping. This comes as no surprise. Over the past 25 years, South Korea has moved from a low-middle income to a high income country, with a highly competitive and globalized economy.6 By
contrast, countries such as Iran, Egypt, Pakistan, and even the Philippines have disappointed
in this field. Finally, countries with large populations and therefore with enormous potential,
such as Nigeria and Mexico, have merely maintained their positions (despite the former being a big energy exporter and the latter a manufacturing powerhouse).
6 Hyun, Oh-Seok (2012), ‘South Korea miracle sets shining example’, The National, June 14. 26.9% 23.8% 20.9% 17.9% 6.1% 7.2% 12.4% 14.7% 6.6% 7.8% 8.0% 8.0% 0.0% 5.0% 10.0% 15.0% 20.0% 25.0% 30.0% 1990 1995 2000 2005 2010 2011 2012 2013 2014
Big European 5 BRICS N 11
40.6% 45.5% 48.4% 33.1% 39.3% 56.4% 60.7% 42.0% 50.3% 55.8% 59.3% 0.0% 10.0% 20.0% 30.0% 40.0% 50.0% 60.0% 70.0% 1990 1995 2000 2005 2010 2011 2012 2013 2014
Big European 5 BRICS N 11
GRAPH 3.2.
Economic presence shares (1990-2014)
GRAPH 3.3.
Contributions of economic presence (1990-2014)
The EB5 economies have all lost positions, although some more than others. Germany and the United Kingdom have only lost one position each, showing that their economies are still resilient to the competition coming from the global south and east. Still, it must be highlighted that Germany is doing better than the United Kingdom; in 2000 the United Kingdom was the 2nd global economic actor, and now it is the 5th, while Germany has maintained its 3rd
position7. France, for its part, has not lost as much ground as one might expect (it has lost
three positions), demonstrating that it remains economically powerful. Certainly more so than Italy or Spain, which have lost 6 and 5 positions, respectively.
The data therefore show that the EB5 are in decline, but that the United Kingdom and Germany are holding their ground vis-à-vis the BRICS. More worrisome is the performance of Italy and Spain, which need to undertake considerable reforms (reindustrialization, further internationalization, and more investment in education and high tech sectors) if they want to retain both their relatively high living standards and their global economic presence. To achieve this, they will need to resist the increasing competition coming from the best performers within the BRICS group, above all from China, which has climbed 15 positions since 1990 and is now the 2nd performer in terms of global economic presence after the
7 Despite the fact that the United Kingdom has surpassed Germany in global presence, as shown in chapter 1. TABLE 3.1.
Economic presence ranking (1990-2014)
1990 2000 2014 1990 -2014 Variation European Big 5 United Kingdom 4 2 5 -1 Germany 2 3 3 -1 France 3 4 7 -3 Italy 8 9 14 -6 Spain 13 13 18 -5 BRICS China 17 10 2 +15 Russia 12 11 4 +8 India 39 31 13 +26 Brazil 23 25 20 +3 South Africa 29 35 43 -14 N 11 Bangladesh 68 75 73 -5 Republic of Korea 21 14 16 +5 Egypt 51 55 62 -11 Philippines 52 48 59 -7 Indonesia 24 23 25 -1 Iran 28 30 41 -13 Mexico 22 15 22 = Nigeria 30 34 30 = Pakistan 61 67 70 -9 Turkey 38 40 47 +1
United States. Interestingly, despite its outstanding performance, China has climbed fewer
positions than India, which has moved all the way from rank 39 to 13. This is significant
because by focusing on China, we often forget India’s tremendous achievements.
EB5 still dominant in services and investments
Since our data divide the global economic presence of the different countries and groupings into 5 sectors (energy, primary goods, manufactures, services, and investments), the next step is to undertake analysis in those sectors in which the BRICS and the N11 gain more ground (see graphs 3.4 to 3.8). Here the empirical evidence reinforces the general trend explained above. The N11 grouping has under-performed compared to the BRICS in all 5 economic indicators. So for now, the real competitors for the EB5 remain the countries that comprise the BRICS.
Concretely, where the BRICS (and also the N11) do outperform the EB5 is in the field of energy. This is a structural factor that will be difficult to change in the short term, although
the focus on renewable energy and shale gas might bring some changes in the long term.
Energy is also a field that is highly volatile and dependent on the price of oil and gas. In this
regard, the recent fall in the price of oil might reduce the global economic presence of the BRICS, especially considering that energy represents the highest single contribution (19%) to their total global presence.
0 500 1000 1500 2000 2500 3000 1990 1995 2000 2005 2010 2011 2012 2013 2014
European Big 5 BRICS N 11
GRAPH 3.4.
0 500 1000 1500 2000 2500 3000 1990 1995 2000 2005 2010 2011 2012 2013 2014
European Big 5 BRICS N 11
0 500 1000 1500 2000 2500 1990 1995 2000 2005 2010 2011 2012 2013 2014
European Big 5 BRICS N 11
GRAPH 3.5.
Primary goods presence (1990-2014, in index value)
GRAPH 3.6.
0 500 1000 1500 2000 2500 1990 1995 2000 2005 2010 2011 2012 2013 2014
European Big 5 BRICS N 11
0 200 400 600 800 1000 1200 1400 1600 1990 1995 2000 2005 2010 2011 2012 2013 2014
European Big 5 BRICS N 11
GRAPH 3.7.
Services presence (1990-2014, in index value)
GRAPH 3.8.
When it comes to primary goods and manufactures, the EB5 remains on top of the three groupings, holding its ground in primary goods while gradually losing the race in manufactures. If the trend continues, it is very likely that in future years the BRICS will surpass the EB5 in manufacturing presence, despite all the rhetoric in Europe about reindustrializing the economy. Leaders in the United Kingdom, France, Italy, and Spain have lately argued that one of their priorities is to revamp their manufacturing sectors, following the German example, but so far the effects have been minor.
Where the EB5 countries remain strong is in services and foreign investment. In these fields,
not only have they not lost ground against the BRICS and the N11, they have expanded it, especially in the area of investments. Given that these sectors are larger in monetary volume and more attractive as regards added-value, and therefore offer higher margins, the decline of the EB5 vis-à-vis the BRICS might be less than commonly assumed. Europe remains a giant in services and investment. Of course, this does mean that a lot of European investment flows out of the continent, which explains why investment levels in Europe have dropped so much in recent times.
‘Chermany’ on the rise
However, looking just at the EB5 and the BRICS as groupings can be deceiving, because there might be considerable differences among the countries forming one or both of the groups, or even between countries across the two groups. To understand the trends in greater detail
it is therefore necessary to analyse the performance of every single country – first overall in
the global economic presence index, and then in each of the 5 economic sectors presented above. This is shown in graphs 3.9 to 3.14 for the 5 countries that form the EB5 and the BRICS. The same could also be done for the N11, but due to space constraints such analysis will not be done in the present report.
0 100 200 300 400 500 600 1990 1995 2000 2005 2010 2011 2012 2013 2014 Germany Spain France Italy United Kingdom Brazil China India Russia South Africa GRAPH 3.9.
Graph 3.9 is perhaps the most illustrative because it shows how the two biggest world exporters are Germany and China; in other words, ‘Chermany’8 have out-performed everyone
else. This is a joint success because they have each fed the other’s economies over the years. Germany is the European country that has invested most in China, thus helping it to develop rapidly. This has made China a manufacturing powerhouse (see graph 3.12) on the basis of
German engineering. Especially during the global and European financial crises, Germany has benefited greatly from the growth of China. German machines are used not only for
manufacturing, but are also essential to China’s real estate and infrastructure sectors.
0 500 1000 1500 2000 2500 1990 1995 2000 2005 2010 2011 2012 2013 2014 Germany Brazil China Spain France India Italy United Kingdom Russia South Africa 0 100 200 300 400 500 600 700 800 900 1990 1995 2000 2005 2010 2011 2012 2013 2014 Germany Brazil China Spain France India Italy United Kingdom Russia South Africa GRAPH 3.10.
Energy presence (1990-2014, in index value)
GRAPH 3.11.
0 200 400 600 800 1000 1200 1400 1600 1800 2000 1990 1995 2000 2005 2010 2011 2012 2013 2014 Germany Brazil China Spain France India Italy United Kingdom Russia South Africa 0 100 200 300 400 500 600 700 1990 1995 2000 2005 2010 2011 2012 2013 2014 Germany Brazil China Spain France India Italy United Kingdom Russia South Africa GRAPH 3.12.
Manufactures presence (1990-2014, in index value)
GRAPH 3.13.