Author(s)
Yang, B; Peng, Y; Leung, HCM; Yiu, SM; Chen, JC; Chin, FYL
Citation
The 3rd International Workshop on Data and Text Mining in
Bioinformatics (DTMBIO 2009), Hong Kong, 6 November 2009. In
BMC Bioinformatics, 2010, v. 11 suppl 2, article S5
Issued Date
2010
URL
http://hdl.handle.net/10722/152434
P R O C E E D I N G S
Open Access
Unsupervised binning of environmental
genomic fragments based on an error
robust selection of
l
-mers
Bin Yang
1,2*, Yu Peng
2, Henry Chi-Ming Leung
2, Siu-Ming Yiu
2, Jing-Chi Chen
2, Francis Yuk-Lun Chin
2*From
Third International Workshop on Data and Text Mining in Bioinformatics (DTMBio) 2009
Hong Kong. 6 November 2009
Abstract
Background:With the rapid development of genome sequencing techniques, traditional research methods based
on the isolation and cultivation of microorganisms are being gradually replaced by metagenomics, which is also known as environmental genomics. The first step, which is still a major bottleneck, of metagenomics is the taxonomic characterization of DNA fragments (reads) resulting from sequencing a sample of mixed species. This step is usually referred as“binning”. Existing binning methods are based on supervised or semi-supervised approaches which rely heavily on reference genomes of known microorganisms and phylogenetic marker genes. Due to the limited availability of reference genomes and the bias and instability of marker genes, existing binning methods may not be applicable in many cases.
Results:In this paper, we present an unsupervised binning method based on the distribution of a carefully selected set ofl-mers (substrings of lengthlin DNA fragments). From our experiments, we show that our method can accurately bin DNA fragments with various lengths and relative species abundance ratios without using any reference and training datasets.
Another feature of our method is its error robustness. The binning accuracy decreases by less than 1% when the sequencing error rate increases from 0% to 5%. Note that the typical sequencing error rate of existing commercial sequencing platforms is less than 2%.
Conclusions:We provide a new and effective tool to solve the metagenome binning problem without using any
reference datasets or markers information of any known reference genomes (species). The source code of our software tool, the reference genomes of the species for generating the test datasets and the corresponding test datasets are available at http://i.cs.hku.hk/~alse/MetaCluster/.
Background
Microbes are essential for almost every process in the biosphere and for every part of human life in both the positive and negative sense, for example, the production of yoghurt withLactobacillus and alcohol brewing with
yeastas well as the fatal pathogen of pulmonary tuber-culosis and cholera. The impact of microbes on humans
is not limited to several kinds of species. The complex environment of human life is maintained by microbial communities which are composed of dozens to thou-sands kinds of individual microbes. The unbalance or abnormal diversity of these microbial communities is proved to be associated with common diseases like peri-cementitis [1] and gastrointestinal [2] disturbance. Understanding how microbial community diversity affects health and disease may contribute to better diag-nosis, prevention, and treatment of diseases. During the last centuries, researches on microbes have been based on the isolation, cultivation and purification of
* Correspondence: [email protected]; [email protected]
1State Key Laboratory of Bioelectronics, School of Biological Science &
Medical Engineering, Southeast University, Nanjing, Jiangsu, 210096 PR China
2Department of Computer Science, The University of Hong Kong, Pok Fu
Lam Road, Hong Kong
© 2010 Yang and Chin; licensee BioMed Central Ltd. This is an open access article distributed under the terms of the Creative Commons Attribution License (http://creativecommons.org/licenses/by/2.0), which permits unrestricted use, distribution, and reproduction in any medium, provided the original work is properly cited.
individual microorganism from complex communities. But 99% of all microbial diversity in the biosphere, as yet, is uncultivable [3], because of the highly artificial and limited number of conditions used currently for cul-tivation. For the uncultivable majority of the microbial communities, rapidly developing genome sequencing techniques can help.Metagenomics, which is also known as the environmental genomics, applies the shotgun sequencing technique to mixed genome samples, obtained directly from an environmental sample or ser-ies of related samples, producing high-throughput ran-domly sampled DNA fragments of these genome samples [4]. Since 2004, several metagenomics sequen-cing projects have been successfully implemented, such as Acid Mine Drainage Biofilm (AMD) for dozens of species [5] and the recent Human Gut Microbiome (HGM) for more than thousands of species [6].
Different from traditional single genome sequencing researches where all DNA fragments are coming from one single species, the metagenomics sequencing dataset contains DNA fragments from different species where most of their genomes are unknown. The data analysis process of metagenomic sequencing (MS) dataset requires an additional analyzing step, called “binning” [7]. The binning step assigns the DNA fragments to the taxonomy tree which provides a general map of the microbe distribution of the mixed sample, basically answering the essential question of metagenomic research: what’s in the mix? Various phylogenetic reso-lution or taxonomical rank of binning from high level such as kingdom to low level such as genus depends on the research requirements and the quality of the MS dataset.
A number of currently available binning methods fall into two broad categories: sequence similarity-based and sequence composition-based. The first, for example based on BLAST [8], classifies fragments based on the distribution of BLAST hits of phylogenetic specific mar-ker genes to taxonomic classes [9]. The application of this kind of method is limited due to the limited avail-ability of reference genomes of known microorganisms. As mentioned above, less than 1% of all microorganisms can be cultured and sequenced today.
So more generic features such as structure and com-position form the basis of methods developed to dis-tinguish components from mixed sequencing dataset in a supervised or semi-supervised manner. In general, these methods extract the composition features of reference genomes or marker regions (e.g. the widely applied fingerprint gene 16S rRNA [10], recA and
rpoB). Then, a classifier is generated based on different machine learning methods like SVM or SOM with the selected training dataset. For semi-supervised methods, the marker information of the testing datasets is
translated to additional constraints during the cluster-ing or classification process. Compared to the sequence similarity-based methods, sequence composi-tion-based methods achieve better performance. But there are still limitations on these approaches; For example, not all species inside the sample carry the known phylogenetic markers. According to several metagenomic projects, such as the enhanced biological phosphorus removing (EBPR) sludge [11], Sargasso Sea [4] and the Minnesota soil samples [12], only 0.17%, 0.06% and 0.017% of the contigs (fragments) respec-tively are known to carry 16S rRNA markers. Even if we consider other markers such asrecA andrpoB, less than 1% of the fragments could be identified. Also, some species may share multiple markers with other species, which leads to incorrect classifications. For example, according to recent reports, multiple kinds of
16S rRNA molecules can exist in a single bacterium [13]. Moreover, the marker gene information is pro-vided by the existing cultivation and isolation techni-ques with limitation and bias in the selection of specific microorganisms. The training datasets with the bias caused by technical limitation will also introduce bias into the classification and clustering results.
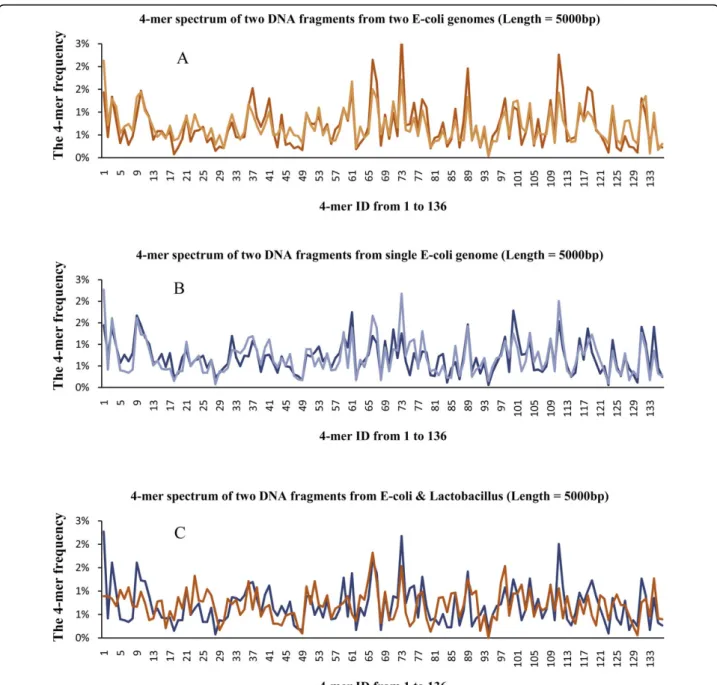
These two categories of methods suffer from the lim-itation or instability of different kinds of reference infor-mation and not much research has been done for the clustering DNA fragments from species without gen-omes information [14]. To address this issue, we pro-pose an unsupervised method for clustering DNA fragments based on l-mer (short DNA substrings of lengthlin the fragments) distribution [15-19]. Previous research of this compositional signature has shown that species belonging to different categories, even down to genus, tend to be quite distinct in terms of thel-mer frequency of their whole genomes or genome fragments [15,20]. So by comparing thel-mer distribution of frag-ments, we may be able to bin the DNA fragments into the correct taxonomical groups. Figure 1(A) shows the
l-mer distributions of two species in the same genus while Figure 1(C) shows thel-mer distributions of two species in different genuses. The distributions are similar in 1(A) and are quite different in 1(C).
However, the difficulty of applying l-mer distribution lies in the resulting high-dimensional data. The l-mer frequency of each input DNA fragment is usually repre-sented by a feature vector with 4lcomponents. Consider the palindrome reverse and complement DNA string in the sequencing datasets, the dimension of thel-mer vec-tor could be decreased to about 4l/2. Details of the gen-eration of thel-mer vectors will be described late in the Methods Section. Whenl≥ 4, the dimension of the fea-ture vector is very large (i.e. whenl= 4, the dimension of the feature vector is 136) and the clustering problem
based on the high dimensional feature vectors becomes difficult. Some researchers suggested using methods like PCA (Principal Components Analysis) etc. to come up with a combination of selected significantl-mers [21] to lower the dimension. However, we show that some see-mingly significantl-mers may be due to noise, and sim-ply apsim-plying PCA cannot filter out this noise. Moreover, PCA involves a complicated process and it is not easy to understand the resulting combination of l-mers (in terms of eigenvectors) and to find the biological mean-ing of the eigenvectors. Thus, selectmean-ing an appropriate
set ofl-mers to decrease the dimension of the datasets poses a difficult problem.
To tackle this problem, we introduce a simple but error-robust method, based on a modified Chebychev Distance, to decrease the dimension of the dataset by remove some l-mers. Our selection ofl-mers combined with a simplek-mean clustering algorithm is shown to be effective in the binning process.
Note that our method does not rely on any reference sequence or training dataset, but is only based on the similarity of thel-mer frequencies. Our method could
Figure 1The 4-mer frequency spectrum(Figure. 1A) gives the 4-mer spectrums of two DNA fragments from two different E-coli genomes. (Figure. 1B) gives the 4-mer spectrums of two DNA fragments from single E-coli genome. (Figure. 1C) gives the 4-mer spectrums of two DNA fragments from the genomes of E-coli and Lactobacillus which belong to the same Kingdom but different Phylums.
bin the raw DNA fragments to several taxonomy speci-fic clusters with high accuracy and resolution. The other advantage of our method is its robustness with respect to sequencing errors. The binning performance decreases by less than 1% while the sequencing error rate increases from 0% to 5% which is much higher than the typical sequencing error rate of less than 2% for the existing commercial sequencing platforms. We believe that our approach is promising to solve the meta-genomics binning problem for short fragments gener-ated by the high-throughput sequencing machines. Methods
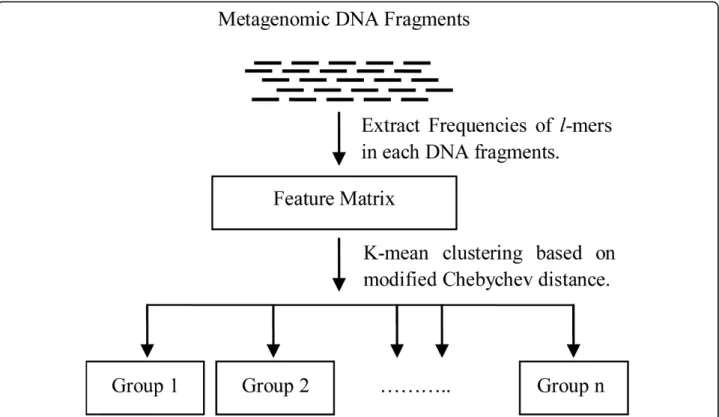
The approach of our binning method is outlined in Figure 2. First, the l-mer occurrence frequencies of each DNA fragment in the sample are counted. Not all
l-mers will be used in the classification process. We have a simple, but effective method, based on our novel modified Chebychev distance, to select a subset of
l-mers for a feature vector, which is 20% of the raw dimension. After that, a k-mean algorithm is applied to classify the fragments into different taxonomical groups.
l-mer frequency calculation
TheDNA composition featuresof each DNA fragment are extracted by calculating itsl-mer frequencies. There
are 4 different nucleotides in a DNA sequence, so there are in total 4ll-mers. A scan window of lengthl is slid along each DNA fragment and the frequency of every
l-mer, say Ni, i Î[1, 4l], is recorded. For practice, DNA fragments are of different lengths and they contain dif-ferent numbers ofl-mers, for example, a DNA fragment of length 500bp contains 497 4-mers and a DNA frag-ment of length 2000bp contains 1997 4-mers. So we cannot compare directly the l-mer frequencies of two DNA fragments of different lengths. We need to apply an extra step to normalize the l-mer frequencies based on the lengths of the DNA fragments. Set the total
number of l-mers in a DNA fragment be: Nj
j l
1 4 ,the normalized frequency of each l-mer is
fi Ni Nj j l
1 4. Then thefeature vectoris defined as
f f1, 2f4 1l ,f4l
with 4l components. After getting
thel-mer frequencies, we need to do some modification to make them applicable for reverse complement strings. As each DNA fragment can be sequenced from either strand of the DNA genome, they should give the same
l-mer frequencies. Hence, we can combine the fre-quency of one l-mer and its reverse complement
Figure 2The pipeline of our binning algorithmFirst, thel-mer frequencies of each input sequence are counted. Then based on a novel modified Chebychev distance, a subset ofl-mers is selected to create a feature vector. After that,k-mean clustering algorithm is applied to classify the fragments into taxonomic specific groups.
palindromel-mer into a single frequency for counting. This process will reduce the size of vector by half, i.e. the size of the vector forl-mer N l( )4 2l , ifl is odd;
4l4l2 2
, iflis even.Based on some previous studies [22,23], in order to be effective and to have a reasonable vector size,lis set to 4. So each DNA fragment will be transformed to a vec-tor with 136 components and the input sequencing dataset of FASTA will be transformed to a n × 136 matrix withnrows representingnDNA fragments.
Modified Chebychev Distance
Clustering high-dimensional vectors (representing the DNA fragments) of 136 values is not easy. Because of noise, not all thel-mers (components in the feature vec-tors) are useful. Based on our experiments and analysis, two kinds of major noises l-mers are identified, the
intraspecies noise l-mers (about 20% of the totall-mers) and interspecies noise l-mers (about 60% of the total
l-mers). In the following parts of this section, we will introduce how to identify and remove these two kinds of noises.
Even though the high-throughput sequencing technol-ogy and the assembly process could provide DNA frag-ments covering the whole genome, because of the noise in data, even for the same genome of the same species, thel-mer distribution of a general region of the genome may be quite different from the l-mer distribution of a special functional region (such as promoters and exo-genous transferred regions). This is called intraspecies noise. Figure 1(B) shows an example of two regions from the same genome. These two regions have quite differentl-mer distributions (compared to Figure 1(A)). However, this does not occur very often. Usually randomly picked regions from the same genome should have quite similar l-mer distributions, as shown in Figure 1(A). The following procedure can be used to remove these outliners.
We first define a Modified Chebychev Distancewhich combines the idea of Chebychev and Manhattan dis-tance to represent the similarity between a pair of fea-ture vectors. Leta andb be two feature vectors where
ai and bi are their i thcomponents. The traditional Chebychev Distance calculates the maximum absolute difference of each component in these two vectors, i.e.
DistanceCHE( , )a b Max aibi
Chebychev Distance examines the differences across all components of the vectors and uses only the maxi-mum difference as the measure. However the extreme values are most likely caused by intraspecies noise. To
avoid using these noisyl-mers as measure, we construct the sorted value list ofa and b where the values of
aibi are sorted in increasing order, i.e. if 4-mers are taken as an example, a1b1 is the minimum and
a136b136 is the maximum. Then the last 20% of the top values are removed as intraspecies noise. The 20% cut off value is determined based on extensive experi-ments and how to determine this value should be further investigated, but in general, the results are simi-lar for choosing the cut off values between 15% and 25%.
The other type of noise calledinterspecies noiseis due to similar and statistical unstablel-mers among inter-species. Within the entire 136 4-mers, only a few of them are essential and effective for representing the dis-tance (similarity) between the feature vectors of two DNA fragments. Hence, any distance definitions which consider all thel-mers will introduce noises caused by these “unessential” l-mers, which lead to unsatisfactory results.
A group of experiments were conducted to identify those unessential l-mers to be removed for calculating the distance between the feature vectors of two DNA fragments. Let Di be its corresponding aibi value. Without loss of generality, assume thatD1 is the mini-mum value andD136the maximum (if 4-mers are taken as an example). The experiments were conducted based on the reference genomes of some known species or microorganisms in NCBI genome database. Three DNA fragments, say , and , were picked randomly where and are from the same species and from a different species within a particular taxonomical differentia level. Let
D X Yi( , ) xiyi , thei thelement of the sorted value list ofXandY. The interspecies distanceDi(A,C)
and the intraspecies distanceDi(A,B) were then com-pared. This process was repeated many times with dif-ferent sets of three DNA fragments. Basically we want to determine whether the ithl-mer is essential in calcu-lating distance between fragments from same/different species. Pi (Probability) is used to indicate the ratio of the total number of experiments that interspecies dis-tanceDi (A,C) is larger than the intraspecies distance
Di(A,B). Figure 3 give the corresponding Pi for each
Di in the sorted value list of 1 million experiments on data from NCBI genomes database.
Three sets of experiments were conducted to generate the three curves in Figure 3. Each curve represents a particular taxonomical differentia level among DNA fragment and . We tested the differentia level at
“Genus” ( and are from the same family but different genuses), “Family” ( and are from the same order but
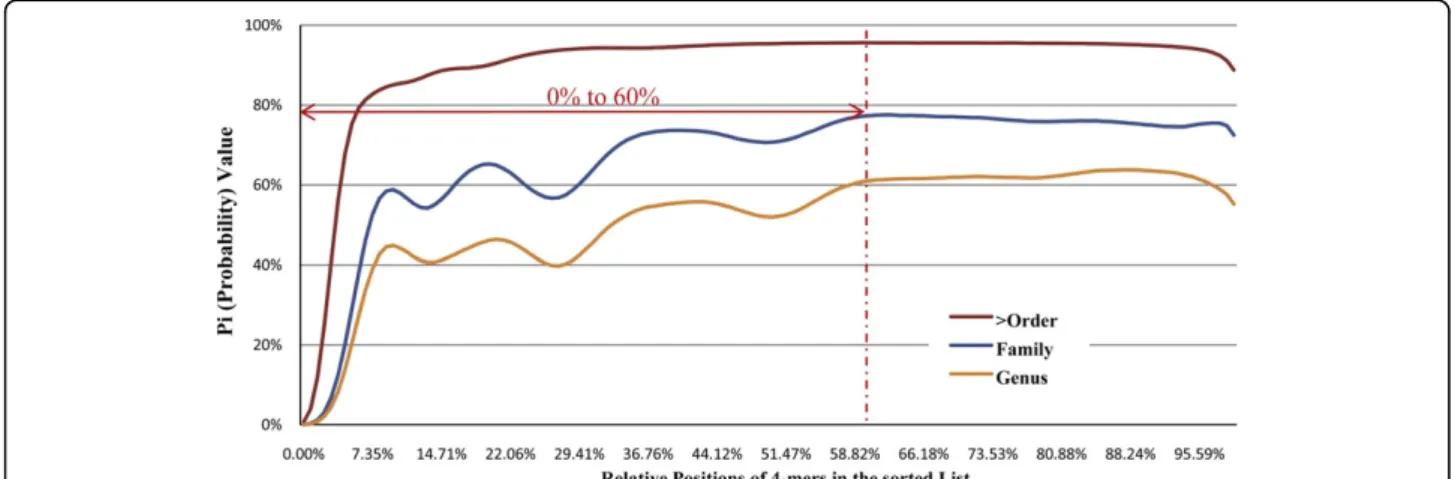
different families) and “> Order” ( and are from same class or higher taxonomical levels but different orders). The y-axis represents the value of Pi, which could also be considered as the confidence level for selecting the correspondingDi value as distance for species discrimi-nation. Strictly speaking, the range ofDi with the corre-spondingPi≤ 50% (the performance of random choice) should be filtered out. In order to avoid the unstable part of the curves with undulation, we filter out the range from 0% to 60% to achieve more solid and better performance, even though we consider the validity for the datasets with closer taxonomic similarity.
As a result, for removing the two major kinds ofl-mer noises (the interspecies and intraspecies noise), only the
Di values with relative positions in the sorted value list from 60% to 80% are used in calculating distance between DNA fragments. Based on traditional Manhat-tan disManhat-tance DistanceMan( , )a b
ai bi , we defineModified Chebychev Distance by restricting these Di value, where relative positions range from 60% to 80% (the indexes ofai andbi are reassigned according to the increasing order of theDi values):
Distance( , ) % ( ) % ( ) a b ai bi N l i N l
60 80N(l) is the number of l-mers described in Methods Section (subsection ofl-mer frequency calculation).
k-mean clustering and optimization
A clustering algorithm is then applied to classify the vectors into suitable taxonomical groups based on the
modified Chebychev distance. As mentioned before, the
l-mer frequencies feature vectors of DNA fragments from the same species tend to have similar distributions. The l-mers distribution within one species is quite stable. Our observation is that, thel-mer feature vectors from the same taxonomic sub tree tend to be located around the same clustering center. We use thek-mean algorithm to cluster the fragments.
Suppose that we want to cluster the l-mers feature vectors of fragments into kgroups. Based on our dis-tance definition, the objective function ofk-mean is:
Min x uj i x s i k j i Distance
,
1The vectorui represents the center of the group Si . We use the traditional method to do the clustering. The processes are described as below:
1. Compute the l-mers feature vector for each fragment.
2. Randomly selectkvectors, each as the center of a group.
3. Cluster all the vectors to the nearest center. 4. For each group, calculate the mean of all the vec-tors to generate a new clustering center.
5. Repeat step 3 and step 4 many times, sayM times until the clustering groups are stable.
Because of the unstable feature of k-mean caused by the random selection of the initial clustering centers, we will run the algorithm several times with different initial clustering centers and choose the best clustering result with minimum objective value.
Figure 3The filter out range of unessential 4-mer selectionNot all thel-mers are essential for defining the similarity between two DNA fragments. In figure 3, the x-axis represents the relative position of theDi values in the sorted value list and the y-axis represents the value ofPi
, which could be considered as the confidence level or the validity of the selection of correspondingDi value as distance for species
Results
Testing datasets
For binning methods based on the DNA composition features [15] related, there are four major factors which usually affect binning performance: (1) taxo-nomic complexity (the number of species in the meta-genome dataset), (2) length of the input DNA fragments, (3) sequencing error rate and (4) relative abundance ratio (the ratio of DNA fragments among different species in the metagenome dataset). In our experiment, we used simulated datasets with two to eight species, DNA fragments of length from 500bp to 5,000bp, the sequencing error rate from 1% to 5% and the species relative abundance ratio from the simplest 1:1 to 1:8.
The complete reference genomes of 23 species were downloaded from NCBI genomes database ftp server (http://ftp.ncbi.nih.gov/genomes/). The detailed taxo-nomic level information of these 23 species was obtained from the NCBI taxonomic database (http:// www.ncbi.nlm.nih.gov/taxonomy). They are from three major kingdoms (6 from Archaea, 15 from Bacteria and 2 from Eukaryota).
We implemented our method using C++ (See addi-tional file 1 for the source code and addiaddi-tional file 2 for the user manual.) with two sample testing datasets (additional file 3 and additional file 4) for demonstration under Linux OS environment (Ubuntu 8.10 AMD64 and Debian 5.0 AMD64).
Clustering accuracy
Since our approach is unsupervised, we assume that we do not know any information about the species that exist in the sample. For each dataset, we compute the accuracy as the percentage of fragments from the same species that are classified in the same group. The exact estimated number of species inside the sample is not necessary in our approach. If the selected k value is less than the actual number of
species inside the sample, the most similar species will be clustered together into some taxonomic specific groups. If thekvalue is larger than the actual number of species inside the sample, then some special func-tional genome regions (such as promoters and exogen-ous transferred regions) will be binned into some taxonomic homologous specific groups. We tested dif-ferent kvalues for some datasets. And the result was robust. In order to give a fair evaluation of our approach, the following experiments and performances are based on the assumption that the number of spe-cies is known for each sample.
In the following, we give a general description and some detailed discussion on the performance of our approach by varying the DNA fragment lengths, the relative abundance ratios of the species, and sequencing error rates.
General clustering performance
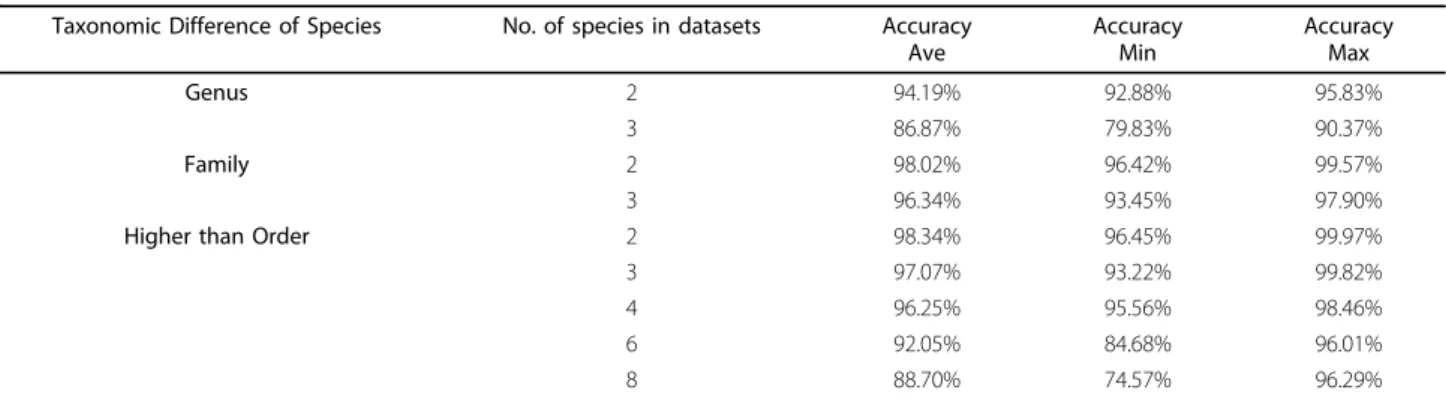
Over 550 datasets were generated. We divided these datasets of microorganisms into three major taxonomic ranges: (1) the same Family but different Genuses (2) the same order but different Families (3) the same Class or higher taxonomical levels but different Orders. The average performances of these datasets with different species complexities (from 2 to 8 microorganisms in one sample) are listed in Table 1. where the same ratio for each species inside the sample and all fragments were assumed to be error-free and of equal length of 2000bp. Table 1 shows that our approach could bin the unknown species with high accuracy and resolution (the capacity to distinguish species with taxonomic difference in classification, i.e. Genus or Family). For example,
“Genus”means that these two microbes belong to the same Family but different Genuses;“Family”means that they belong to the same Order but different Families. For each taxonomical group, we show its average, maxi-mum and minimaxi-mum accuracy among the test datasets. For the taxonomical group of “Genus”, the binning
Table 1 General performance based on different sample complexity and taxonomic similarities
Taxonomic Difference of Species No. of species in datasets Accuracy Ave Accuracy Min Accuracy Max Genus 2 94.19% 92.88% 95.83% 3 86.87% 79.83% 90.37% Family 2 98.02% 96.42% 99.57% 3 96.34% 93.45% 97.90%
Higher than Order 2 98.34% 96.45% 99.97%
3 97.07% 93.22% 99.82% 4 96.25% 95.56% 98.46% 6 92.05% 84.68% 96.01% 8 88.70% 74.57% 96.29%
All the datasets in this table are generated with DNA fragments length equal to 2000bp and 0% sequencing error. The amount of each microbial component in these datasets is equal.
accuracy is higher than 90%. For higher taxonomical dif-ferentia, the accuracy increases. When the resolution is Order or higher, the binning accuracy is higher than 99%, this accuracy is comparable with most widely used supervised or semi-supervised binning tools [21,24,25]. The number of microbes inside the samples could also affects the binning performance. When the number of microbes increases, the binning accuracy decreases as the complexity of the sample increases.
Different DNA fragment lengths
For metagenomic binning methods based on the DNA composition feature (i.e. feature vector), the DNA frag-ment length also affects the performance significantly. According to previous research, the performance of bin-ning is improved with longer DNA fragments [24,25] because longer DNA fragments provide more l-mers which provide statistically more stablel-mer occurrence frequencies. Take 4-mer as an example, the 4-mer fre-quency vector has 136 components. With DNA frag-ments of length 500bp, total number of 4-mers is 497 and the average frequency for each vector component is less than 4. Compared to another DNA fragment of length 5000bp, total number of 4-mers is 4997, and the average frequency for each vector component is ten times larger than the previous case. With sufficiently large l-mer frequency, the variation of the l-mer frequency distribution can be significantly decreased, and the binning accuracy be increased. As shown in Figure 4, there is an obvious improvement in accuracy for our experiment from 500bp to 1000bp. However,
once the fragment is long enough, the accuracy improvement will taper off with the increase of fragment length. The recommended length of the DNA fragment is related to the length ofl-mers i.e. value ofl. In our case, 2000bp seems to be a reasonable choice.
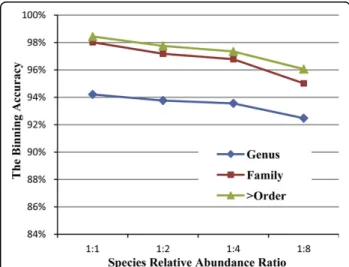
Relative abundance ratio of species
Species relative abundance ratio can be considered as another factor that affects sample complexity. It is expected that accuracy will decrease if we increase the relative abundance ratio of the species inside the sample. The performance based on the three taxonomical differ-entials will decrease if we increase the abundance ratio (Figure 5).
We also vary the length of the DNA fragment to ana-lyze whether it helps if the relative abundance ratio is increased in the species. The genomes of two species (Archaeoglobus fulgidusandMethanoculleus marisnigri), which belong to the same Phylum but different Class, are selected to generate 4 groups of datasets with the relative species abundance ratios 1:1, 1:2, 1:4 and 1:8. Each group contains 5 datasets with different DNA frag-ments lengths, namely 500bp, 1000bp, 2000bp, 3000bp and 5000bp. Twenty datasets were tested and the 5 curves in Figure 6 represent the performance for the 5 different lengths of DNA fragments and the correspond-ing 4 abundance ratios. With the increascorrespond-ing of abun-dance ratio complexity, the binning accuracy is decreased by about 2% to 8% depending on different fragment lengths. Although increasing the fragment length cannot help in maintaining the same accuracy
Figure 4The binning accuracy based on different length of DNA fragmentsFor each group of selected genomes, 5 datasets are generated with different fragment lengths (500bp, 1000bp, 2000bp, 3000bp and 5000bp). With the increasing DNA fragment length, the average clustering accuracies based on three major taxonomic ranks tend to increase until a reasonable length is attained.
Figure 5 The binning accuracy based on different species relative abundance ratioWith the increasing of the relative abundance ratio of each group, the average clustering performances based on three major taxonomic ranges tend to decrease.
when the ratio increases, we still found that the datasets with longer fragments are more robust for higher abun-dance ratios. The performance of the dataset with frag-ment length 500bp decreases by more than 8% when the abundance ratio changes from 1:1 to 1:8. Accord-ingly, the performance decreases by about 5% for the dataset with fragment length 1000bp, and 2 to 3% for the dataset with fragment length 2000bp.
This result also indicates that the accuracy improve-ment by increasing the fragimprove-ment length will taper off from 2000bp to 5000bp.
Robustness with respect to sequencing error
Sequencing error is inevitable for metagenomics sequen-cing projects. Hence, error robustness is another impor-tant contribution for a successful binning approach. Thus sequencing error is introduced in the simulated metagenomics sequencing datasets. Although the typical sequencing error rate of the existing commercial sequencing platforms is less than 2%, we generated test datasets with error rates ranging from 0% to 5%. The average binning performance for different datasets is illustrated in Figure 7.
The result shows that our method is robust to sequencing errors. Even for the datasets with 5% error, compared with the error free datasets, the accu-racy decreases by less than 1%. The error robustness property could be due to the chosen DNA composi-tion features. Take 4-mer as an example: if there is one nucleotide sequencing error, only 4 of the total 4-mers will be affected by this nucleotide sequencing error. So if the sequencing error rate is 1%, for DNA fragments of length 2000bp, the worst case is when the erroneous nucleotides are apart from each other
with at least 6 correct nucleotides; hence, no more than 80 erroneous mers are introduced into the 4-mer occurrence frequency calculation. The modified Chebychev distance with sorting and range-picking strategy could effectively remove the effect of these erroneous 4-mers.
Conclusion and discussion
In this paper, we have introduced an unsupervised DNA composition feature based metagenomic sequencing data binning algorithm focused on the high accuracy taxonomic clustering of unknown spe-cies without any reference or markers. Our approach can filter out the interspecies and intraspecies noise to achieve better binning performance and the results are robust even when there are 5% sequencing errors in the DNA fragments. We will improve our method as follows.
Thel-value selection of thel-mer
The DNA composition features [15] of the occurrence frequency of short oligonucleotides have been reported in previous research from 2-mers to 8-mers. The selec-tion of suitable substring lengthldepends on many fac-tors and it is not sure that largelwill give better results. When l is large, say l = 8, there are many (32,768) l -mers and the accumulated background noise is so large that we cannot cluster the DNA fragments well. Whenl
is small, say l = 2, the signal in effective l-mers, l> 2, will be mixed with the noise in backgroundl-mers (l -mers with similar frequency in different genomes) so that we cannot cluster the DNA fragments well. For practice, the performance of our approach performs well
Figure 6 The binning accuracy based on different species relative abundance ratio and length of DNA fragments.Within the same dataset, the clustering performance based on longer input DNA fragments is more stable when the relative abundance ratio increases.
Figure 7The robustness of binning accuracy.The three curves in the figure describe the binning average performance when the sequencing error increases from 0% to 5%. The error bars demonstrate the stability of the binning accuracy.
whenl= 4 to 6 for most datasets. In the future, we will study how to select a suitable l for different datasets according to the error rate, DNA fragment length and the expected similarity of the genomes.
Clustering algorithm
The traditional k-mean clustering algorithm is selected based on the assumption that the distribution of thel -mer feature vectors in the hyper-dimensional space is a sphere. When the abundance ratio of different species is extremely different, density-based clustering methods may perform better. Besides, tree structure taxonomic classification among these groups is also important for metagenomic research. Thus, hierarchal clustering methods should be more suitable. In the future, we will study the performance of different clustering algorithms on the binning problem.
Clustering functional fragments
Another important direction of metagenomic research is that we do not try to identify different species in the sample. Instead we can treat the sample as a single spe-cies with very complex genome structure and study which functions can be provided by this genome struc-ture. Thel-mer frequency may also be suitable for clus-tering DNA fragments according to their functions.
Additional file 1: MetaCluster C++ Source CodeThis rar package contains the C++ source code of our software. Decompress the package under Ubuntu or Debian environment, then run“Makefile”to install the software.
Additional file 2: MetaCluster user manualThe pdf file introduces the runtime environment, input & output and the command format of our software.
Additional file 3: MetaCluster Testing Dataset 1This rar package contains 4000 DNA fragments from two microorganisms which belong to the same class but different orders. The first 2000 DNA fragments of this dataset are from“Ignicoccus hospitalis KIN4/I”and the last 2000 DNA fragments from“Caldivirga maquilingensis IC-167”. The length of each DNA fragment is 2000bp and the sequencing error rate is 2%.
Additional file 4: MetaCluster Testing Dataset 2This rar package contains 6000 DNA fragments from three microorganisms which belongs to the same phylum but different orders and classes. The first 2000 DNA fragments of this dataset are from“Bordetella avium 197N”, the middle 2000 DNA fragments from“Bordetella parapertussis 12822”and the last 2000 DNA fragments from“Escherichia coli O157:H7 str. Sakai”. The length of each DNA fragment is 2000bp and the sequencing error rate is 2%.
Acknowledgements
We thank Ruiqiang Li, Junjie Qin from BGI Shenzhen for their suggestions and comments. This research is supported by Project 30871393 of National Natural Science Foundation of China, Hong Kong GRF grant HKU 7117/09E and the HKU Genomics Strategic Research Theme Matching Fund. This article has been published as part ofBMC BioinformaticsVolume 11 Supplement 2, 2010: Third International Workshop on Data and Text Mining in Bioinformatics (DTMBio) 2009. The full contents of the supplement are available online at http://www.biomedcentral.com/1471-2105/11?issue=S2.
Author details
1State Key Laboratory of Bioelectronics, School of Biological Science &
Medical Engineering, Southeast University, Nanjing, Jiangsu, 210096 PR China.2Department of Computer Science, The University of Hong Kong, Pok
Fu Lam Road, Hong Kong.
Authors’contributions
B.Y. developed the algorithm and performed the testing and experiments. Y. P., H.L. and S.Y. consummated the testing cases and helped to improve the performance. J.C. implemented the online availability of this tool. F.C. conceived this study. All authors contributed to writing the article.
Competing interests
The authors declare that they have no competing interests.
Published: 16 April 2010
References
1. Cobb CM:Microbes, inflammation, scaling and root planing, and the periodontal condition.J Dent Hyg2008,82(Suppl 3):4-9.
2. Khachatryan ZA, Ktsoyan ZA, Manukyan GP, Kelly D, Ghazaryan KA, Aminov RI:Predominant role of host genetics in controlling the composition of gut microbiota.PLoS One2008,3(8):e3064. 3. Amann RI, Binder BJ, Olson RJ, Chisholm SW, Devereux R, Stahl DA:
Combination of 16S rRNA-targeted oligonucleotide probes with flow cytometry for analyzing mixed microbial populations.Appl Environ Microbiol1990,56(6):1919-1925.
4. Venter JC, Remington K, Heidelberg JF, Halpern AL, Rusch D, Eisen JA, Wu D, Paulsen I, Nelson KE, Nelson W,et al:Environmental genome shotgun sequencing of the Sargasso Sea.Science2004,304(5667):66-74. 5. Tyson GW, Chapman J, Hugenholtz P, Allen EE, Ram RJ, Richardson PM,
Solovyev VV, Rubin EM, Rokhsar DS, Banfield JF:Community structure and metabolism through reconstruction of microbial genomes from the environment.Nature2004,428(6978):37-43.
6. Jones BV, Begley M, Hill C, Gahan CG, Marchesi JR:Functional and comparative metagenomic analysis of bile salt hydrolase activity in the human gut microbiome.Proc Natl Acad Sci U S A2008,
105(36):13580-13585.
7. Mavromatis K, Ivanova N, Barry K, Shapiro H, Goltsman E, McHardy AC, Rigoutsos I, Salamov A, Korzeniewski F, Land M,et al:Use of simulated data sets to evaluate the fidelity of metagenomic processing methods.
Nat Methods2007,4(6):495-500.
8. Altschul SF, Madden TL, Schaffer AA, Zhang J, Zhang Z, Miller W, Lipman DJ:Gapped BLAST and PSI-BLAST: a new generation of protein database search programs.Nucleic Acids Res1997,25(17):3389-3402. 9. Huson DH, Auch AF, Qi J, Schuster SC:MEGAN analysis of metagenomic
data.Genome Res2007,17(3):377-386.
10. Cole JR, Chai B, Farris RJ, Wang Q, Kulam SA, McGarrell DM, Garrity GM, Tiedje JM:The Ribosomal Database Project (RDP-II): sequences and tools for high-throughput rRNA analysis.Nucleic Acids Res2005,33(Database issue):D294-296.
11. Garcia Martin H, Ivanova N, Kunin V, Warnecke F, Barry KW, McHardy AC, Yeates C, He S, Salamov AA, Szeto E,et al:Metagenomic analysis of two enhanced biological phosphorus removal (EBPR) sludge communities.
Nat Biotechnol2006,24(10):1263-1269.
12. Tringe SG, von Mering C, Kobayashi A, Salamov AA, Chen K, Chang HW, Podar M, Short JM, Mathur EJ, Detter JC,et al:Comparative metagenomics of microbial communities.Science2005,308(5721):554-557.
13. Case RJ, Boucher Y, Dahllof I, Holmstrom C, Doolittle WF, Kjelleberg S:Use of 16S rRNA and rpoB genes as molecular markers for microbial ecology studies.Appl Environ Microbiol2007,73(1):278-288.
14. Desnues C, Rodriguez-Brito B, Rayhawk S, Kelley S, Tran T, Haynes M, Liu H, Furlan M, Wegley L, Chau B,et al:Biodiversity and biogeography of phages in modern stromatolites and thrombolites.Nature2008,
452(7185):340-343.
15. Karlin S, Burge C:Dinucleotide relative abundance extremes: a genomic signature.Trends Genet1995,11(7):283-290.
16. Karlin S, Burge C, Campbell AM:Statistical analyses of counts and distributions of restriction sites in DNA sequences.Nucleic Acids Res1992,
17. Karlin S, Ladunga I:Comparisons of eukaryotic genomic sequences.Proc Natl Acad Sci U S A1994,91(26):12832-12836.
18. Rubin GM, Yandell MD, Wortman JR, Gabor Miklos GL, Nelson CR, Hariharan IK, Fortini ME, Li PW, Apweiler R, Fleischmann W,et al:
Comparative genomics of the eukaryotes.Science2000,
287(5461):2204-2215.
19. Sandberg R, Winberg G, Branden CI, Kaske A, Ernberg I, Coster J:Capturing whole-genome characteristics in short sequences using a naive Bayesian classifier.Genome Res2001,11(8):1404-1409.
20. Karlin S, Mrazek J, Campbell AM:Compositional biases of bacterial genomes and evolutionary implications.J Bacteriol1997,
179(12):3899-3913.
21. Chatterji S, Yamazaki I, Bai ZJ, Eisen JA:CompostBin: A DNA composition-based algorithm for binning environmental shotgun reads.Research in Computational Molecular Biology, Proceedings2008,4955:17-28. 22. Teeling H, Meyerdierks A, Bauer M, Amann R, Glockner FO:Application of
tetranucleotide frequencies for the assignment of genomic fragments.
Environ Microbiol2004,6(9):938-947.
23. Teeling H, Waldmann J, Lombardot T, Bauer M, Glockner FO:TETRA: a web-service and a stand-alone program for the analysis and comparison of tetranucleotide usage patterns in DNA sequences.BMC Bioinformatics
2004,5:163.
24. McHardy AC, Martin HG, Tsirigos A, Hugenholtz P, Rigoutsos I:Accurate phylogenetic classification of variable-length DNA fragments.Nat Methods2007,4(1):63-72.
25. Diaz NN, Krause L, Goesmann A, Niehaus K, Nattkemper TW:TACOA: taxonomic classification of environmental genomic fragments using a kernelized nearest neighbor approach.BMC Bioinformatics2009,10:56.
doi:10.1186/1471-2105-11-S2-S5
Cite this article as:Yanget al.:Unsupervised binning of environmental genomic fragments based on an error robust selection ofl-mers.BMC Bioinformatics201011(Suppl 2):S5.
Submit your next manuscript to BioMed Central and take full advantage of:
• Convenient online submission
• Thorough peer review
• No space constraints or color figure charges
• Immediate publication on acceptance
• Inclusion in PubMed, CAS, Scopus and Google Scholar
• Research which is freely available for redistribution
Submit your manuscript at www.biomedcentral.com/submit