February 14, 2011
Morgan Stanley does and seeks to do business with companies covered in Morgan Stanley Research. As a result, investors should be aware that the firm may have a conflict of interest that could affect the objectivity of Morgan Stanley Research. Investors should consider Morgan Stanley Research as only a single factor M O R G A N S T A N L E Y B L U E P A P E R
Tablet Demand and Disruption
Mobile Users Come of Age
Tablet demand is still underappreciated: shipments could reach 100 million by
2012, in our bull case scenario. A series of proprietary surveys covering more than 8,000
consumers and 50 chief information officers suggest that tablets are accelerating the adoption of the mobile internet. Our data yielded several surprises: 1) two-thirds of companies expect to allow tablets on their networks within a year; 2) consumer interest in tablets is even greater outside of the US, and 3) users are moving beyond web surfing, email, games, video, and applications to content creation. Tablets are additive to the broader computing market, and we see more beneficiaries than challenged companies.
Tablet disruption is not yet discounted by the market in many industries.Tablets
should reduce PC market growth by 3 percentage points in 2011—maybe more over the long term. Like smartphones, tablet growth is likely to benefit the established leaders while challenging legacy technology. The impact on printing companies may be the most underappreciated cannibalization story, and we highlight AMD, Dell, Lexmark, and Ricoh as potentially challenged from tablets.
Market share leaders and “arms dealers” are the best way to play the bull case.
Apple and Samsung Electronics are the most probable tablet beneficiaries, with tablets core to the investment thesis. ARM Holdings, Broadcom, and SanDisk help provide users with fast, touch-enabled, and power-efficient mobile devices and should enjoy greater scale if tablet growth surprises to the upside. Medium term, there are opportunities for software companies in applications, management, and security. Tablets’ impact on Wintel players Hewlett-Packard, Intel, and Microsoft has largely been discounted, and earnings risk appears limited, partially due to diversification.
MORGAN STANLEY RESEARCH Global
Kathryn Huberty, CFA Mark Lipacis
Adam Holt
Ehud Gelblum, PhD Scott Devitt
Benjamin Swinburne, CFA Francois Meunier Keon Han Frank A.Y. Wang Jasmine Lu Grace Chen Bill Lu Masahiro Ono Mia Nagasaka
Kazuo Yoshikawa, CFA Mathew Schneider, CFA
Global Technology, Media and Telecommunications Equipment Team
See page 2 for all contributors to this report
Morgan Stanley Blue Papers focus on critical investment themes that require coordinated perspectives across industry sectors, regions, or asset classes.
M O R G A N S T A N L E Y B L U E P A P E R
Global Technology, Media and Telecommunications Equipment Team
Contributors to this Report
US Hardware
Kathryn Huberty, CFA1 +1 (212) 761-6249 [email protected]
Scott Schmitz1 +1 (212) 761-0227 [email protected]
Mathew Schneider, CFA1 +1 (212) 761-3483 [email protected]
Jerry Liu1 +1 (212) 761-3735 [email protected]
US Semiconductors
Mark Lipacis1 +1 (415) 576-2190 [email protected]
Sanjay Devgan1 +1 (415) 576 2382 [email protected]
Sundeep Bajikar1 +1 (415) 576-2388 [email protected]
Atif Malik1 +1 (415) 576-2607 [email protected]
US Software
Adam Holt1 +1 (415) 576-2320 [email protected]
Jennifer Swanson, CFA1 +1 (212) 761-3665 [email protected]
Keith Weiss, CFA1 +1 (212) 761-4149 [email protected]
Melissa Gorham1 +1 (212) 761-3607 [email protected]
US Communications Equipment
Ehud Gelblum, PhD1 +1 (212) 761-8564 [email protected]
Kimberly Watkins, CFA1 +1 (415) 576 2060 [email protected]
Michael Kim1 +1 (212) 761 3247 [email protected]
US Internet
Scott Devitt1 +1 (212) 761 3365 [email protected]
Collis H.G. Boyce1 +1 (212) 761 6578 [email protected]
Joseph N. Okleberry1 +1 (212) 761 8094 [email protected]
US Cable/Media
Benjamin Swinburne, CFA1 +1 (212) 761-7527 [email protected]
David Gober1 +1 (212) 761-6616 [email protected]
Europe Semiconductors
Francois Meunier2 +44 20 7425-6603 [email protected]
Sunil George2 +44 20 7425-3436 [email protected]
Asia Technology
Jasmine Lu5 +852 2239-1348 [email protected]
Grace Chen4 +886 2 2730-2890 [email protected]
Keon Han4 +82 2 399-4933 [email protected]
Young Suk Shin4 +82 2 399-9907 [email protected]
Bill Lu5 +852 2848-5214 [email protected]
Frank A.Y. Wang4 +886 2 2730-2869 [email protected]
Jerry Su4 +886 2 2730-2860 [email protected]
Richard W. Ji5 +852 2848-6926 [email protected]
Timothy Chan5 +852 2239-7107 [email protected]
Masahiro Ono6 +81 3 5424-5362 [email protected]
Kazuo Yoshikawa, CFA6 +81 3 5424-5389 [email protected]
Mia Nagasaka6 +81 3 5424-5309 [email protected]
Shoji Sato6 +81 3 5424-5303 [email protected]
Yusuke Yoshida6 +81 3 6422-8652 [email protected]
1Morgan Stanley & Co. Incorporated
2
Morgan Stanley & Co. International plc
3Morgan Stanley & C. International plc, Seoul Branch
4Morgan Stanley Taiwan Limited
5Morgan Stanley Asia Limited
6Morgan Stanley MUFG Securities Co., Ltd.
M O R G A N S T A N L E Y B L U E P A P E R
Table of Contents
Executive Summary... 4
Key Investment Conclusions... 5
Summary of Key Takeaways by Industry... 6
The New Computing Landscape... 7
Why We’re Bullish... ... 7
Key Tablet Assumptions: Shipments and Cannibalization... 12
State of the Tablet Market ... ... 14
Hardware: Cannibalization Challenges PC Vendors ... 19
Semiconductors: ARM Wins Round One in Tablet CPUs ... 29
Hard Disk Drives: Tablets Not Too Disruptive, Other Threats Linger ... 39
Memory Semiconductors: NAND Is Best Bull Case Play ... 43
TFT-LCD and Touch Panels: Some Positives for Display Technology ... 47
Imaging and Printing: Tablets to Reduce Printing Demand... 51
Software: Opportunities in Management, Applications and Security... 55
Interactive Entertainment: Tablets Poised to Cannibalize Hardware ... 65
Cable/Satellite: Tablets Unlikely to Drive Incremental Cord-Cutting ... 73
Media: A Game Changer for Content Owners ... 77
Appendix I: Key Survey Takeaways ... 82
Appendix II: US Tablet Survey Demographics... 84
Appendix III: Models ... 85
M O R G A N S T A N L E Y B L U E P A P E R
Executive Summary
The mobile internet user first appeared only a few years ago, but already this new user’s behavior is changing the technology landscape. We believe that we are in the early innings of the mobile computing cycle – the largest in the history of computing. By the end of 2020, we predict that 10 billion mobile internet devices will be in use, up from 2 billion today. Within this larger trend, we are seeing a fragmentation of computing devices, and 2011 may be the year of the tablet – a computing product whose adoption, we expect, will ramp faster than any previous mobile device (exhibit 1).
Through the aggregating of data from more than 8,000 global consumers and 50 US CIOs, we have garnered unique insights into the tablet market and usage patterns of tablet users. Our data include AlphaWise consumer surveys performed in the US, UK, France, Germany, Japan, and China in October 2010. Based on these surveys, we believe that the tablet market could be bigger and more disruptive than investors appreciate. In particular, three potential upside surprises highlighted by our research could boost 2012 tablet shipments to our 100-million bull-case scenario:
First, enterprise adoption could be more widespread than expected. Two-thirds of the 50 CIOs in our January 2011 survey expect either to purchase tablets for some of their employees or allow employee-owned tablets onto their networks within one year – up from 29% currently (exhibit 2). While it is difficult to know how large the deployments will be, what the use cases are for the tablet deployments, and how they might affect corporate PC expenditure, this is some of the first-hand evidence we have of enterpise tablet adoption. Any meaningful uptake of tablets in the enterprise opens up opportunities for application, security, virtualization, and management software vendors.
Second, international demand could be materially higher than some expect. While consensus views the tablet market as
largely a US consumer phenomenon, the international consumer survey data surprised us. Demand came in higher than in the US in every large developed international market – the UK, Germany, France, Japan – and significantly higher in China (exhibit 3). While we base our current tablet shipment forecast on data from US consumers, there appears to be a clear upward demand bias in international markets.
Third, increasingly, tablets may be viewed as content-creation devices. Today, the primary use of tablets is to consume content through activities like web browsing, social networking, and watching video. However, 20% of tablet owners also use the device to create or edit files regularly. While this figure is below the 34% of netbook owners and 56% of notebook owners that regularly use these devices to create or edit files, we believe the rate of introduction of new mobile applications and faster processors could increase these figures over time.
Exhibit 1
Tablets: The Fastest Ramping Mobile Device…
Total Cumulative Shipments in First Five Years of Product History (milllions)441 373 300 -100 200 300 400 500
Year 1 Year 2 Year 3 Year 4 Year 5
Tablets - Bull Case (25%)
Tablets - Base Case (21%)
Tablets - Bear Case (16%)
Smartphone (26%) Cell Phone (66%) Netbook (10%) Gaming Devices (46%) MP3 (50%) Notebook (61%) E-Reader (5%)
Note: Percentages represent current penetration rates for each device. Figures for bull, base, and bear case forecasts represent penetration rate in year five. For notebook, cell phones, and gaming devices, shipments are in early years of product history.
Source: Morgan Stanley Research, Gartner, IDC, company reports Exhibit 2
…Being Adopted in 2/3 of Companies in 2011…
Tablet Usage in the Enterprise21% 51% 8% 16% 71% 33% 0% 20% 40% 60% 80% 100% Currently In One Year
Purchase for Employees Allow Employee Owned Tablets on Network Do Not Allow
Source: AlphaWiseSM CIO survey
Exhibit 3
…With Demand Even Stronger Outside the US
11% 15% 16% 18% 20% 21% 41% 0% 15% 30% 45% U.S. France Japan Germany UK International Demand China
Extreme Interest in Purchasing a Tablet over the Next 12 Months
M O R G A N S T A N L E Y B L U E P A P E R
Key Investment Conclusions
As a global technology, media and telecommunications equipment team, we investigated the investment debates for tablets across 10 industries, both within the tablet supply chain and adjacent industries, and now present our conclusions in this Blue Paper. In some cases our
conclusions are clear and conviction is high. In other cases, admittedly, our team members themselves hold differing opinions. Because we are only in year two of what we think will be a 10-year technology shift, we expect that it will take time to build consensus. Below we highlight our key investment conclusions (exhibit 4).
Like smartphones over the past two years, tablet growth
is likely to surprise to the upside, in our view, pulling with it
market leaders and challenging legacy technology.
Importantly, while some tablets will eat into other markets, like PCs, e-readers, and gaming handhelds, more than half of prospective tablet buyers in the US and more than one-third globally view a tablet as an additive device—a bullish signal for the broader technology market. We view Apple and Samsung Electronics as the most likely near-term tablet market leaders in both our base- and bull-case scenarios.
Memory-based storage is the best way to play the bull
case. We view component vendors as the “arms dealers”
that support tablet growth, and memory-based storage (NAND) is the most likely beneficiary if our bull case scenario plays out. SanDisk is best positioned here, with 60% earnings exposure to memory in mobile devices. We also see upside to ARM Holdings, in light of its leadership position in low-power-usage processors, and Broadcom, a provider of connectivity and touch controller semiconductors.
The impact of tablets on pages printed is the most
underappreciated cannibalization story. CIOs in the
enterprise space already expect to cut spending on printer supplies in 2011. As the installed base of tablets—a digital document viewer that reduces the need to print both standard black and white documents and expensive color
presentations—grows, we expect printed page volumes to
shrink. What’s more, 90% of iPad users already believe they would print less with access to work documents on their tablets. Given high earnings exposure to sales of printers and related supplies, we highlight Lexmark and Ricoh as
potentially challenged due to rising tablet adoption.
Large-cap technology stocks face limited earnings risk.
Large-cap tech stocks bore the brunt of tablet-related valuation compression over the last year. Even so, they face relatively small earnings risk because of their more diversified business models. In our base case, we see less than $0.05 of EPS downside for large-cap technology stocks like Hewlett-Packard, Intel, and Microsoft. While these companies need to more effectively communicate their strategy and execute on tablets, they are somewhat protected by the greater diversity of their businesses. We see more downside for companies with higher earnings exposure to PCs and printers.
Please see page 6 for a summary of key takeaways by industry.
Exhibit 4
Best Ways to Play Tablet Adoption
Best Positione d - Ove rw e ights
Company Ticker P/E Comme nts
Apple AAPL.O 15.9 Tablet leader
ARM Holdings ARM.L 50.5 Processor leader
Broadcom BRCM.O 13.8 Connectivity leader
Samsung 005930.KS 8.9 Tablet leader / supplier
SanDisk SNDK.O 10.3 Memory leader
Cha llenge d - Unde rw eights
Company Ticker P/E Comme nts
Advanced Micro Devices AMD.N 17.5 PC exposure
Dell DELL.O 10.1 PC exposure
Lexmark LXK.N 10.3 Printer exposure
Ricoh 7752.T 17.8 Printer exposure
Note: P/E as of February 10, 2011. Samsung refers to Samsung Electronics. Source: Morgan Stanley Research
M O R G A N S T A N L E Y B L U E P A P E R
Summary of Key Takeaways by Industry
Hardware Tablets are disruptive to the PC market, reducing units by 5%, on average, through 2013.
Tablets increase the TAM, but traditional PC vendors will likely struggle to capture incremental demand.
Smartphone vendors better positioned, particularly those that own a platform.
Best positioned: Apple, Samsung Electronics, Motorola Mobility, HTC, Research in Motion, Hon Hai Precision. Potentially challenged: Hewlett-Packard, Dell, Acer, Asustek Computer, Lenovo, Toshiba, Sony.
Semiconductors Tablets are the latest x86 versus ARM battleground – ARM wins round one.
Near term, ARM should continue to dominate as OEMs prioritize low power consumption over performance.
Longer term, success depends on: 1) usage model 2) manufacturing muscle and 3) Windows 8 success.
Tablets are accretive to most semi companies; EPS risk for Intel and AMD is 1% and 4%, respectively.
Best positioned: ARM Holdings, Broadcom, Qualcomm, Nvidia, Texas Instruments, Marvell Technology Group. Potentially challenged: Advanced Micro Devices, Intel.
HDD Surprisingly, tablets are not too disruptive to the hard disk drive market but other important threats linger.
Tablets reduce HDD shipments by 2-3%, on average, through 2013 in our base case.
Shift to centralized storage only provides a modest offset to tablet cannibalization.
Other threats include desktop virtualization, PC solid-state drives and cloud streaming services.
Potentially challenged: Western Digital, Seagate, TDK, Nidec.
Memory NAND is the best way to play the tablet bull case.
NAND market remains tight due to rising adoption of tablets and smartphones.
Tablet bull case could disrupt the NAND supply demand balance, leading to supply constraints.
DRAM impact is only a slight negative in the near term but neutral to additive by 2012.
Best positioned: Samsung Electronics, Toshiba, SanDisk.
TFT-LCD High-end displays and touch panels are strategic components and clear tablet beneficiaries.
Tablets are driving a meaningful expansion in the touch panel market.
While the overall TFT-LCD industry impact is modest, providers of high-end displays will benefit.
Best positioned: Young Fast, Chimei Innolux.
Printing Tablet impact on pages printed is the most underappreciated cannibalization story.
Printing behavior is structurally changing; we expect a reduction in enterprise and commercial printing.
The majority of iPad owners are printing less in the office and many are cancelling print subscriptions.
We expect a 2-5% reduction in printer supplies revenue in developed markets by 2012.
Potentially challenged: Lexmark, Hewlett-Packard, Ricoh.
Software Opportunities in management, applications and security; near-term Microsoft impact limited.
We only see a $0.02-0.03 EPS impact while Microsoft calibrates tablet strategy with Windows 8 in 2012.
Tablets offer opportunities for systems management, applications and security software vendors.
Best positioned: VMware, Citrix Systems, Intuit, SuccessFactors, Salesforce.com. Potentially challenged: Microsoft, Adobe.
Gaming Tablets poised to cannibalize gaming hardware.
Tablets could reduce gaming hardware shipments by 6-8% over the next two years.
While cannibalization will focus on the handheld market, product cycles could reduce near term pressure.
Tablets provide a new gaming software platform but is offset by cannibalization and lower pricing.
Potentially challenged: Nintendo, Sony.
Cable/Satellite Enhanced video experience and rising broadband consumption.
Tablets offer a platform to improve video search and navigation, benefitting cable and satellite.
Rising broadband consumption in the home driven by tablets will benefit cable.
Media A game changer for content owners.
Larger audience creates additional advertising opportunities for TV networks.
Potential to drive incremental rental activity for movie studios.
M O R G A N S T A N L E Y B L U E P A P E R
The New Computing Landscape
Why We’re Bullish
Our bullish view on tablet adoption is primarily based on three factors: 1) tablet usage and demand data from our AlphaWise consumer survey, 2) our broader view on the computing cycle, and 3) the enterprise opportunity. In this section, we will discuss each of these factors in turn.
Consumers show strong intentions to purchase a tablet.
Fundamentally, we see a strong level of tablet purchase intentions from our AlphaWise consumer survey. By the numbers, 11% of consumers are extremely interested in purchasing a tablet computer over the next year and 30% are somewhat interested (exhibit 5).
Exhibit 5
AlphaWise Survey Points to Strong Tablet Purchase
Intentions…
Somewhat Not Interested 19% Somewhat Interested 30% Not Interested At All 40% Extremely Interested 11% Tablet Purchase Intentions over the next 12 months, U.S.Source: AlphaWiseSM, Morgan Stanley Research
Of all our surveys, interest in tablets is the highest. To put
these numbers into context, extreme interest in purchasing a tablet computer is higher than in any survey we have
completed over the last three years and 2.5 times higher than tablet purchase intentions in March 2010. What’s more, extreme interest in purchasing a tablet is 1.5 times higher than iPhone purchase intentions indicated by our March 2010 survey (exhibit 6), and Apple is on track to sell 47 million units in the 12 months following the survey.
Key Tablet and PC Assumptions
2009 2010 2011 2012 2013 Shipments (millions) Desktops 136 146 152 157 159 Notebooks 135 164 189 210 232 Netbooks 34 36 29 26 27 Tablets - 16 55 85 102 Total 305 362 425 478 519 PCs, gross 305 351 386 416 439 Tablet Cannibalization - (5) (16) (23) (21) PCs, net 305 346 370 393 417 Tablets - 16 55 85 102 Total 305 362 425 478 519 YoY Growth Desktops -10% 7% 5% 3% 1% Notebooks 6% 22% 15% 11% 10% Netbooks 118% 8% -20% -11% 5% Tablets - - 245% 54% 20% Total 4% 19% 17% 12% 9% PCs, gross 4% 15% 10% 8% 6% PCs, net 4% 14% 7% 6% 6% Cannibalization Rate - 30% 29% 27% 21%
Source: Morgan Stanley Research, IDC
Exhibit 6
…Especially Relative to Past AlphaWise Surveys
Comparison of Extreme Interest Purchase Intentions
11% 8% 7% 5% 5% 0% 2% 4% 6% 8% 10% 12% Tablet, Oct '10 iPhone, Mar '10 iPhone, Feb '07 iPhone, Nov '08 Tablet, Mar '10
M O R G A N S T A N L E Y B L U E P A P E R Tablets do not necessarily replace other technology purchases. Many consumers view tablets as an incremental
device—a bullish indicator for the broader technology landscape. Fifty-five percent of potential tablet users do not expect a tablet to replace the purchase of another technology product, indicating an expansion in the market size of mobile devices that should benefit tablet vendors, component suppliers, and content providers alike.
Tablets signal a change in PC usage. Our analysis of
personal computing usage suggests thatcomputing will increasingly migrate towards mobile devices, including tablets and smarpthones, over time. Approximately 75% of total personal computer usage is spent consuming and sharing content, as opposed to creating content (exhibit 7).
Consuming content includes activites like browsing the web, social networking, listening to music, viewing pictures, and watching video. Content creation includes activities such as word processing, creating spreadsheets, and photo editing. Given this typical usage pattern, we think consumers will increasingly migrate towards computing devices such as tablets that are optimized for content consumption.
Exhibit 7
PCs Usage Is 75% Content Consumption/Sharing
Communication (consumption) - Email, IM, social,
etc 14% General web browsing, search 26% Playing games 13% Watching videos 6% Viewing/editing photos 6% Listening to music 9% Work 9% Productivity 12% Communication (creating) - Email, IM, social,
etc 5%
Consumer Personal Computer Usage 2010 Content Consumption: 75% Content Creation: 25%
Source: AlphaWiseSM, Morgan Stanley Research
Tablets are optimized for content consumption. Mobility
and ubiquitous connectivity mean that you can take a tablet virtually anywhere and have access to personal content and the web. High-resolution displays are ideal for web browsing, email, watching video, and reading books, magazines, and newspapers. Long battery life, thanks to operating system and processor innovation, means that one can consume content all day on a single charge (on the iPad, for instance). Content is robust, offering a considerable selection of music, movies, TV shows, books, and magazines that can be accessed with the click of a button. Application marketplaces offer a wide array of options that significantly enhance the tablet
computing experience beyond tradtional desktop computing.
Considerable usage overlap between PCs and tablets.
Data from our AlphaWise survey point to considerable usage overlap, particularly for content-consumption activities (exhibit 8). This suggests that tablets will likely take computing share from traditional PCs.In fact,in several key content-consumption categories, like listening to music, watching videos, playing games, and reading, tablets actually are used more than traditional PCs.
Exhibit 8
Tablets Geared Towards Content Consumption
29 44 54 81 48 41 46 27 55 81
Specific Work Use General Work Use Create / Edit Files
Email Watching Video Listening to Music Playing Games Reading eBooks, News, Magazines Social Networking Web Browsing 17 14 21 62 51 52 52 54 54 68 Traditional PC Tablets C o n s u m p t i o n C r e a t i o n
Note: Traditional PC is average of deskotp and notebook. Represents percentage of users who use the device regularly for each activity.
Source: AlphaWiseSM, Morgan Stanley Research
Tablet users are spending less time on existing PCs.
Particularly for content-consumption and content-sharing activities such as browsing, email, and social networking, 30% of tablet owners are reporting reductions in time spent on existing PCs. Indeed, our analysis of total time spent on PCs (tablet owners and non-tablet owners) suggests that
consumers are spending 20% less time on traditional PCs in 2010 as compared to 2008, likely due to the rising adoption of mobile computing devices such as tablets and smartphones (exhibit 9).
Exhibit 9
Consumer PC Usage Is Down 20% Since 2008
Weekly Time Spent on Home PC, Hours
-5 10 15 20 25 30 35 40 2006 2008 2010 Work Internet Communication Productivity Education Games Video Photos Music 30 33 26 +10% -20%
M O R G A N S T A N L E Y B L U E P A P E R What about the rest of the time? cannibalization section below, our research suggests that As we discuss in the
most tablet purchases will not replace PCs in the near term, and this is partially due to the content-creation requirements of many consumers. Not surprisingly, content-creation usage is much lower on tablets than on traditional PCs, as our analysis of AlphaWise usage data suggests. In fact, tablet usage appears to be driving reductions in time spent on PCs for several key content-consumption activities, but not for content-creation tasks (exhibit 10).
Exhibit 10
Tablet Usage Overlap Driving PC Usage Declines
in Content Consumption, Not Content Creation
Net Increase (Decrease) in Time Spent on Existing Notebook/Netbook Following Tablet Purchase
-22% -14% -11% -11% -9% -5% -3% 3% 8% 12% -30% -20% -10% 0% 10% 20% Playing games Social networking Web browsing Reading Email Listening to music Watching video Creating files Work - General Work - Specific
Source: AlphaWiseSM, Morgan Stanley Research
The lack of support for the Microsoft Office suite on both iOS and Android, combined with the lack of a physical keyboard on many tablets, will lead many consumers to require a traditional PC irrespective of a tablet purchase, particularly those who require productivity software for out-of-the-office work. Windows 7-based tablets, especially tablet hybrids with a keyboard, solve this problem but introduce a variety of other problems that we discuss in the software section of the report. Additionally, Windows 7 is not optimized for tablets, so touch is still not elegant—nor are most Windows-based applications optimized for tablets.
While we do not think that tablets can match the content-creation experience of traditional PCs, we believe that mobile-productivity or web-based-mobile-productivity applications, combined with a keyboard, enable basic content-creation functionality that is sufficient for many users. While tablet usage is still well below traditional PC usage for content-creation, our survey does suggest that some tablet users are using their tablets to create content, and we expect this figure to rise over time. Overall, we view tablets as being additive to the total computing market and expect to see more beneficiaries than challenged companies from tablet growth.
Evidence
Evidence
Core Questions for Evidence Research
What are consumer’s tablet purchase intentions?
How will tablet purchases impact PC, eReader and gaming hardware spending?
How are consumers using PCs, smartphones and tablets?
How will tablets impact PC usage?What Gives Us Confidence
We surveyed 8,203 consumers across the US, UK, France, Germany, China, and Japan in October 2010.
The U.S. sample is representative of the online adult population in terms of age, gender, and income.
Conclusions based on the total sample have a maximummargin of error of 3.2% at 90.0% confidence level. Morgan Stanley AlphaWiseSM conducts proprietary
evidence-based investment research. Morgan Stanley Research analysts leverage AlphaWise’s Intelligence Team to validate their investment theses.
Enterprise Tablet Adoption Has Been a Big Surprise
While most expected the addressable tablet market to be limited to consumers, at leaset initially, enterprise adoption of Apple’s iPad has been one of the biggest surprises in the early days of the tablet market. Nine months after Apple launched the iPad, 80% of Fortune 100 companies had either deployed or were piloting the device, according to Apple. We recently completed a survey of 50 enterprise CIOs and came to a similar conclusion, but the number of companies actually purchasing tablets for employees, versus those allowing employee-owned tablets on the network, was the most interesting takeaway. As our survey shows, 21% of companies currently purchase tablets for employees, but a staggering 51% of companies expect to purchase tablets for employees over the coming year (exhibit 11). In total, 67% of companies surveyed expect either to purchase tablets or provide support for employee-owned tablets over the coming year.
Companies are finding a broad set of uses for tablets, including general productivity, sales, field service/support, management, heathcare, and others. The iPad’s operating system, iOS, has several important enterprise security and management features that have enabled the strong adoption in corporate environments. What’s more, a growing set of powerful third-party business applications and the ability to create customized applications for business is creating new, powerful use cases.
M O R G A N S T A N L E Y B L U E P A P E R Exhibit 11
More Than 50% of Large Enterprises Expect to
Purchase Tablets for Employees Over the Next Year
Tablet Usage in the Enterprise
21% 51% 8% 16% 71% 33% 0% 20% 40% 60% 80% 100% Currently In One Year
Purchase for Employees Allow Employee Owned Tablets on Network Do Not Allow
Source: Morgan Stanley Research, AlphaWiseSM
While our survey data is some of the first hard evidence that we have on enterprise adoption, the size and scope of these deployments remains to be seen. Additionally, corporations must deal with securing access, securing devices, application compatibility, and managing multiple operating systems. Over time, these areas represent some of the biggest opportunities for software vendors. Near term, a number of the software-as-a-service vendors are solving these problems for customers by effectively making applications consumable content. In another sign of rising enterprise tablet adoption, iPads accounted for 29% of new enterprise activations of Good Technology software in December 2010 (up from 25% in November 2010). Good Technology software enables secure access to corporate networks and messaging applications from a variety of devices (exhibit 12).
Exhibit 12
iPads Represented 29% of Good Technology
Enterprise Activations in December 2010
Good Technology Enterprise Device Activations by Platform
29% 0% 10% 20% 30% 40% iPhone 3G iPhone 3GS iPhone 4 iPad Motorola Droid X Motorola Droid 2 Motorola Droid 2 Global Samsung Fascinate Samsung Captivate HTC Droid Incredible HTC Evo 4G HTC Cedar
Samsung i637 Sept. 10 Oct. 10 Nov. 10 Dec. 10
iOS
Source: Good Technology, Morgan Stanley Research
Tablets and the Broader Computing Cycle
From a broader computing cycle perspective, we think we are in the middle of the mobile consumer/internet computing cycle characterized by a fragmentation of computing devices, where computing occurs anytime, anywhere, on a range of internet-connected devices (exhibit 13). Tablets represent a
continuation of the computing fragmentation that we have seen over the last few years and follow netbooks,
smartphones, eReaders, etc. (exhibit 14). All of these devices highlight the broader shift of computing towards mobile devices and away from the desktop and traditional notebooks. Relative to its closest cousin, the netbook, we think tablets (as measured by the iPad) offer a more attractive form factor, which we think represents a potential bridge for traditional PC players to adapt to the new wave of mobile computing. (Please see the Mobile Internet Report, published December
15, 2009, for additional perspective).
We highlight five key trends that are converging to drive the mobile internet/consumer computing cycle, device
fragmentation, and tablet adoption: 1) mobility, 2) connectivity, 3) operating system innovation, 4) applications/services, and 5) power-efficient processors.
Exhibit 13
Tablets: Part of Mobile Internet Computing Cycle
Computing Growth Drivers Over Time, 1960 - 2020E
Minicomputer PC Desktop Internet Mobile Internet Mainframe 1960 1970 1980 1990 2000 2010 2020 1MM+ Units 10MM+ Units 100MM+ Units 1B+ Units / Users 10B+ Units??? 1 100 10,000 1,000,00 0 Multiple Devices: -Tablets - Smartphones - eReaders - MP3 - Cell Phone - Car Electronics - Games - Wireless Home Appliances
Devices / Users (MM in Log Scale)
Source: ITU, Mark Lipacis, Morgan Stanley Research
Mobility. Smaller and lighter form factors enable consumers
to access computing resources and the internet anywhere, anytime. Consumers have shown a preference for smaller, lighter, and more portable devices – desktops have been declining as a percentage of PC shipments for several years, and netbook adoption increased quickly, with mobility as the main attraction. The volume and weight of a tablet computer is approximately 80% below traditional notebooks and 60%
M O R G A N S T A N L E Y B L U E P A P E R below netbooks, and we believe this enhanced mobility will emerge as a key driver of tablet computing adoption.
Connectivity. Ubiquitous connectivity is becoming a
necessity for many consumers. Desktops and notebooks connect to the internet via traditional ethernet connections and WiFi. Tablets take connectivity to the next level, combining WiFi with celluar connectivity and GPS. Cellular connectivity allows access to the internet anywhere, and GPS enables access to a growing list of powerful location-based applications and services. We believe the “always-connected” profile of tablets and contract-free data plans will emerge as important drivers of tablet computing adoption.
OS/platform innovation. New operating systems with touch
screens rather than point-and-click graphical user interfaces have enabled the introduction of a new breed of mobile devices, including smartphones and tablets. We view this user interface progression – from text to graphical to touch – as a natural evolution and one that many consumers will embrace over time. These new operating systems are also optimized for low-power consumption, reducing hardware requirements and the physical size of the devices while increasing battery life.
Applications/services. Tablets bridge the gap between
traditional PCs and smartphones. They combine a more PC-like computing and display experience with the mobility, connectivity, and touch optimization of smartphones.
Importantly, in addition to many cloud-based services, tablets gain access to application stores that already contain hundreds of thousands of smartphone applications and a growing list of tablet-optimized applications. Apple already
has more than 60,000 iPad-optimized applications in the App Store.
Power-efficient processors. A new breed of processors built
on ARM architecture have enabled the proliferation of mobile computing devices, including smartphones and tablets, where battery life is crucial. ARM-based processors have also driven innovation on traditional PC processors, as Intel and AMD have raced to improve power consumption. The iPad has set a high bar, with up to 10 hours of battery life. The new breed of Oak Trail processors from Intel reduce power consumption, and we expect x86 chips to continue to better balance power and performance over time. Further, for many applications and functions that require more processing or graphics, x86 chips could remain the more functionally rich solution for tablets.
Exhibit 14
Computing Device Fragmentation Underway
Device Shipments by Form Factor, Millions, 1995-2010-100 200 300 400 500 600 700 199 5 1996 1997 1998 1999 200 0 200 1 2002 2003 2004 200 5 200 6 2007 2008 2009 201 0 Smartphones Tablets Netbooks Notebooks Desktops
M O R G A N S T A N L E Y B L U E P A P E R
Key Tablet Assumptions: Shipments and
Cannibalization
There are clearly several potential outcomes for the nascent tablet market, and we are introducing base, bull, and bear case tablet forecasts, based on demand data from our AlphaWise consumer survey, to compensate for the range of possible outcomes. We use demand data from our survey to derive forecasted penetration rates by region.
Shipments more than triple this year. In our base case, we
expect 55 million tablet shipments in 2011 (up from 16 million in 2010), 85 million in 2012, and 102 million by 2013. This forecast is based on a global penetration rate (among the adult internet population) of 5.1% in 2011, 10.8% in 2012, and 16% in 2013 (exhibit 15).
We think it is useful to look at the tablet opportunity by comparing the tablet penetration rate today to that of other computing devices. Based on our survey, tablet penetration is approximately 3% today, compared with 75% for desktops, 63% for notebooks, 30% for smartphones, and 9% for netbooks (exhibit 16).
We think there is an upward bias to tablet shipments over
the next two years. Our bull case tablet forecast of 65 million
shipments in 2011 and 101 million in 2012 is based on a global penetration rate of 5.8% in 2011 and 12.6% in 2012 (exhibit 17). If tablets were to reach global penetration rates similar to those of notebooks or smartphones, the tablet installed base would approach 425-475 million users, versus the 285 million users we currently predict for 2014.
Exhibit 15
Base Case: 55 Million Tablet Shipments in 2011,
85 Million in 2012
Tablet Shipments by Geography, millions
9 22 29 34 37 20 28 32 35 12 25 33 38 3 4 5 -20 40 60 80 100 120 2010 2011 2012 2013 2014 RoW Asia Europe North America 16M 55M 85M 102M 114M Penetration Rate 1.2% 5.1% 10.8% 16% 20.7%
Source: Morgan Stanley Research
Exhibit 16
Putting Tablet Adoption into Perspective
Consumer Electronics Device Penetration, U.S.
75% 63% 30% 9% 6% 3% 0% 10% 20% 30% 40% 50% 60% 70% 80% Desktop Notebook Smartphone Netbook eReader Tablet
Source: AlphaWiseSM, Morgan Stanley Research
Exhibit 17
Bull Case Upside Potential: 65 Million Tablet
Shipments in 2011 and 101 Million in 2012
Global Tablet Unit Shipments Scenario Analysis (millions)
55 114 102 85 65 139 120 101 90 80 67 47 0 40 80 120 160 2010 2011 2012 2013 2014 Bull Bear Base
Source: Morgan Stanley Research
We believe that tablets will follow the adoption path of smartphones, not of netbooks, with a more significant available market opportunity. Just under half of potential US tablet users view a tablet as a notebook, netbook, desktop, eReader, and/or gaming device replacement. These five technology markets represent consumer shipment volume of 200 million units globally in 2010, a market size that is much larger than the 85 million tablets we forecast in 2012, which does not include meaningful enterprise demand.
We view netbooks as an evolutionary step in the traditional notebook form factor, one that comes with a lower price tag, while we view tablets as a revolutionary step in computing. Fundamentally, tablet computing represents the natural evolution of computing from a graphical, keyboard, and mouse user interface to a touch user interface. A tablet is ultra-mobile and “always connected,” and the significant amount of applications and content designed for these devices increases functionality well beyond netbooks and traditional PCs. As a result, we expect the tablet adoption
M O R G A N S T A N L E Y B L U E P A P E R curve to ramp faster than any other mobile device in history (exhibit 18). Exhibit 18
Tablets: The Fastest Ramping Mobile Device
Total Cumulative Shipments in First Five Years of Product History (milllions)441 373 300 -100 200 300 400 500
Year 1 Year 2 Year 3 Year 4 Year 5
Tablets - Bull Case (25%) Tablets - Base Case (21%) Tablets - Bear Case (16%) Smartphone (26%) Cell Phone (66%) Netbook (10%) Gaming Devices (46%) MP3 (50%) Notebook (61%) E-Reader (5%)
Note: Percentages represent current penetration rates for each device. Figures for bull, base, and bear case forecasts represent penetration rate in year five. For notebook, cell phones, and gaming devices, shipments are in early years of product history.
Source: Morgan Stanley Research, Gartner, IDC, company reports
Higher-than-Expected PC Cannibalization,
Driven by Purchase Deferrals
We think that 29% of tablet purchases will cannibalize PC sales in 2011, leading to a 3 percentage point reduction in PC market growth in 2011, or a 5% reduction in PC units over the next three years. Our survey suggests that 33% of iPad owners and those somewhat or extremely interested in purchasing a tablet will not need to purchase a PC after a tablet purchase (exhibit 19). We intentionally structured our AlphaWise survey questions concerning tablets and PC purchase plans to capture PC purchase deferrals along with outright cannibalization.
Exhibit 19
Survey Suggests About 33% of Tablet Purchases
Will Affect PC Market
% of Tablet Purchases that Impact PC Purchase Plans
40% 35% 33% 33% 0% 10% 20% 30% 40% 50% Extreme Interest Tablet owner Extreme + Somewhat Interest iPad owner n = 55 n = 1,203 n = 77 n = 335
We begin with a base cannibalization rate of of 33% and assume that only new consumer tablet purchases lead to cannibalization. Essentially, we exclude commercial tablet purchases and replacement tablet purchases over time. These additional assumptions reduce our effective cannibalization assumption from 33% over the forecast horizon to 29% in 2011, falling to 21% in 2013 (exhibit 20).
Exhibit 20
Base Case PC Cannibalization Assumptions
Tablet Cannibalization of PCs - Base Case
30% 29% 27% 21% 0% 5% 10% 15% 20% 25% 30% 35% 2010 2011 2012 2013
Source: Morgan Stanley Research
Our view is that in the near term the majority of consumer tablet purchases will not indefinitely “cannibalize” a PC purchase but will defer the purchase of replacement PCs. Most tablet owners still need a PC for content-creation activities, to transfer content to a tablet, and to update the tablet operating system. We believe that replacement PC deferrals are the most likely outcome.
In 2010, we think tablet cannibalization reduced PC market growth by approximately 2 percentage points, or 5 million units (exhibit 21).In the US market, netbook units have been down approximately 25% year over year on average since the iPad launched in April 2010, after rising 50% year over year on average in the three months leading up to the iPad launch (exhibit 22).
For more detail on tablet cannibalization and how it will affect the PC industry and vendors, please refer to the Hardware section of this Blue Paper on page 19.
M O R G A N S T A N L E Y B L U E P A P E R Exhibit 21
Tablet Cannibalization Reduced PC Market Growth
by 2 Percentage Points in 2010
Global PC Growth and Impact of Tablet Cannibalization, 4Q09-4Q10
26% 5% 11% 22% 18% 26% 3% 10% 20% 18% 0% 5% 10% 15% 20% 25% 30% 4Q09 1Q10 2Q10 3Q10 4Q10
PC Growth, Gross PC Growth, Net Source: IDC, Morgan Stanley Research
Exhibit 22
Netbook Units Down 25% YoY Since iPad Launch
76% 54% 27% -10% -10% -25% 15% -15% -24% -26% -35% -41% -60% -40% -20% 0% 20% 40% 60% 80% 100% Jan -10 Feb -10
Mar-10 Apr-10 May
-10 Jun -10 Jul -10 Au g-10 Se p-10 Oc t-10 Nov-10 Dec-10
U.S. Retail Netbook YoY Growth, Jan - Dec 2010
iPad Launch
Source: NPD, Morgan Stanley Research
State of the Tablet Market
Rapid Specification Increase and LTE
We have seen a rapid increase in hardware specifications for tablets since the iPad launched in April 2010; these new specifications make these devices considerably more powerful.
For instance, Apple launched the iPad in April 2010 with a single-core ARM system-on-a-chip clocked at 1 gigahertz (GHz) and 256 megabytes (MB) of memory. Many of the upcoming tablets will ship with dual-core 1GHz+ ARM chips and 512MB to 1GB of RAM. Also, the display pixel density (pixels per inch) on many of the upcoming 10-inch tablets will meet or exceed the iPad’s 132-pixel density. Finally, several
vendors announced 4G, next-generation, wireless-network-capable tablets at the Consumer Electronics show in January 2011, and we expect 4G to be a key marketing message as these tablets launch later in the year.
Supply Constraints
Tablets share several common components with smartphones, and both markets are ramping up quickly, creating supply constraints in several areas. Apple recently announced a $3.9 billion two-year supply agreement with three vendors, and we think that it is likely an agreement for display components.
Competition Heating Up
Apple was the tablet market in 2010, shipping close to 15
million out of a total 16 million units. Our view is that Apple will remain the dominant player in 2011, with close to 65% share, driven by its first-mover advantage, large installed base of iPad optimized applications (more than 60,000) and content, and overall user experience driven by vertical integration. That being said, competition is poised to heat up
significantly in 2011 with the launch of an onslaught of Android 3.0 tablets from tier-1 vendors (and many more from tier-2+ vendors), the Blackberry Playbook, and, to a lesser extent, Windows 7 tablets and Hewlett-Packard webOS tablets later in the year.
Honeycomb Is Coming
Since Apple redefined the tablet market with the iPad in 2010, several platforms have been hard at work calibrating their tablet strategy.
Apple made the transition into tablets by leveraging the iOS platform initially built for the iPhone and iPod Touch. Similarly, to enter the tablet market, Google will leverage the Android platform built for smartphones. Early Android tablets, such as the Samsung Galaxy Tab, shipped with a version of Android optimized for smartphones —Android 2.2 (Froyo) — but Google has been working on a version of the OS optimized for tablets called Android 3.0 (Honeycomb) that will launch in the coming weeks. Google recently demonstrated
Honeycomb, and the new operating system is built from the ground up for tablets, with a new user interface, newly designed native applications, and an updated web browser. Android tablets could benefit from a large installed base of developers and applications and several key OEM partners that have experience building on the platform. Several leading OEMs have announced plans to launch Honeycomb tablets
M O R G A N S T A N L E Y B L U E P A P E R by mid-2011, including Google’s lead Honeycomb partner, Motorola Mobility (exhibit 23). Similar to the smartphone
market, we think Android has the best shot at competing with Apple in the tablet market; we also think that Motorola Mobility and Samsung Electronics are the best-positioned Android tablet vendors in the near term.
Exhibit 23
Several Tier 1 Vendors Launching Honeycomb
Tablets by Mid 2011
Brand Name Launch OS Display Processor
Acer Iconia Apr-11 Android 3.0 10" Tegra 2 Dual Core 1GHz Asus Slider May-11 Android 3.0 10" Tegra 2 Dual Core 1GHz Asus Transformer Apr-11 Android 3.0 10" Tegra 2 Dual Core 1GHz Asus MeMo 6/1/2011 Android 3.0 7" Snapdragon Dual Core 1GHz
HTC NA - - -
-LG G-Slate Mar-11 Android 3.0 9" Tegra 2 Dual Core 1GHz Motorola Xoom Feb-11 Android 3.0 10" Tegra 2 Dual Core 1GHz
Samsung Galaxy Tab 2 - - -
-Toshiba NA - - -
-Note Motorola refers to Motorola Mobility; Samsung refers to Samsung Electronics. Source: Morgan Stanley Research
Playbook, Windows 7, and WebOS
Outside of Honeycomb tablets, the Blackberry Playbook is scheduled to launch in late first quarter 2011. The Playbook is a seven-inch tablet with impressive specifications, running the recently acquired QNX operating system. But there are several important factors that will likely determine the success of the device, including: 1) performance of the QNX OS, 2) developers’ interest in the platform, 3) price, and 4) battery life.
While Microsoft should have a substantially better tablet story when Windows 8 is released in 2012, there will be several new Windows 7 tablets released in the coming months, including several hybrid tablets with keyboards and/or pens to improve input with an OS that was designed for desktop computing.
Last, Hewlett-Packard will release its recently announced TouchPad webOS tablet during the summer of 2011. While the tablet specifications and webOS tablet user interface look impressive, Hewlett-Packard will launch the tablet into a sea of competition, and developer interest, pricing, and battery life remain unclear. (See exhibit 32 on page 25 for an analysis of OEM tablet market share scenarios.)
Next Gen iPad Coming in April
We expect that in April 2011 Apple will launch a second-generation iPad with upgraded hardware specifications, including processor, memory, display, front and rear cameras, and a lighter metal casing. Importantly, because of limited design/form factor changes and scale benefits, we believe Apple could lower the price of the iPad by around $50. The iPad’s lack of Adobe Flash support and USB connectivity remain the largest points of differentiation with competitors.
M O R G A N S T A N L E Y B L U E P A P E R
Upcoming Catalysts for 2011 and 2012
iPad 2: thinner, lighter, faster; may be cheaper. Expected launch: April
Motorola Xoom Launch: February
Samsung Galaxy Tab Expected launch: second quarter
1Q 2Q 3Q 4Q
2012
Windows 8 Launch: first half
Acer Iconia Tab Launch: April
2011
Tablet Adoption Datapoints
LG G-Slate Launch: March
HP TouchPad Expected launch: third quarter
Blackberry Playbook Launch: March
Toshiba Tablet Launch: second quarter
AlphaWise consumer surveys
Apple quarterly results PC and tablet market data from IDC, Gartner Morgan Stanley
CIO surveys
AlphaWise consumer surveys
Apple quarterly results PC and tablet market data from IDC, Gartner Morgan Stanley
M O R G A N S T A N L E Y B L U E P A P E R Exhibit 24
Detailed Comparison of Tablets
Apple Acer Asus Asus Asus Blackberry DELL DELL DELL HP HP Motorola Samsung Samsung
iPa d Iconia Tab Slider Transformer Ee e Sla te Playbook Streak 5 Streak 7 Inspiron Duo Slate TouchPad Xoom Galax y Tab PC 7
Dimensions Length (in.) 9.6 NA 10.7 10.7 12.3 5.1 6.0 7.9 11.2 9.2 9.4 9.8 7.5 10.5 W idth (in.) 7.5 NA 7.1 6.9 8.2 7.6 3.1 4.7 7.7 5.9 7.5 6.6 4.7 6.9 Depth (in.) 0.5 0.5 0.7 0.5 0.7 0.4 0.4 0.5 1.0 0.6 0.5 0.5 0.5 0.8 W eight (lbs) 1.5 NA 2.0 1.5 2.5 0.9 0.5 1.0 3.4 1.5 1.6 1.6 0.8 2.2 Display Size (in.) 9.7 10.1 10.1 10.1 12.1 7.0 5.0 7.0 10.1 8.9 9.7 10.1 7.0 10.1 Resolution 1024x768 1280x800 1280x800 1280x800 1280x800 1024x600 800x480 800x480 1366x768 1024x600 1024x768 1280x800 1024x600 1366x768 PPI 132 149 149 149 125 170 187 133 155 133 132 149 170 155
OS iOS Android 3.0 Android 3.0 Android 3.0 W indows 7 Blackberry Tablet OS Android 1.6 Android 2.2 W indows 7 Windows 7 W ebOS Android 3.0 Android 2.2 W indows 7
Proce ssor Apple A4 Nividia Tegra 2 Nvidia Nvidia Intel TI OMAP Snapdragon 8250 Nividia Tegra 2 Intel Intel Qualcomm Nividia Tegra 2 Hummingbird Intel
ARM Cortex A8 ARM Cortex A9 Tegra 2 Tegra 2 Core i5 470UM ARM Cortex A9 ARM Cortex A8 ARM Cortex A9 Atom N550 Atom Z540 Snapdragon ARM Cortex A9 ARM Cortex A8 Oak Trail Z670
1GHz 1GHz Dual Core 1GHz Dual Core 1GHz Dual Core 1.3GHz Dual Core 1GHz Dual Core 1GHz 1GHz Dual Core 1.5GHz Dual Core 1.86 GHz 1.2GHz Dual Core 1GHz Dual Core 1GHz 1.66GHz
Memory 256 MB 1 GB 512 MB or 1GB 512 MB or 1GB 2 GB 1 GB 512 MB 512 MB 2 GB 2 GB 512 MB 1 GB 512 MB 2 GB
Connectivity
W i-Fi Y Y Y Y Y Y Y Y Y Y Y Y Y Y
Cellular Option Y NA NA N Option Y Y N N Y Y Y Y
4G Verizon LTE Sprint T-Mobile HSPA+ Verizon LTE Verizon LTE
USB N Y Y Y Y Y Y N Y Y Y Y N Y Came ra / Vide o Front facing N Y Y Y Y Y Y Y Y Y Y Y Y Y MP N 5.0 1.2 1.2 2 3.0 0.3 1.3 1.3 0.3 1.3 2.0 1.3 1.3 Rear N Y Y Y N Y Y Y N Y NA Y Y NA MP N 2.0 5 5 - 5.0 5.0 5.0 N 3.0 NA 5.0 3.0 NA Stora ge 16 / 32 / 64 GB 16 GB 16 / 32 GB 16/32/64 32GB 16GB 16 GB 16 / 32 GB 320 GB 32 / 64 GB 16/32/64 32 GB 16 GB 32 / 64 GB
Expandable N NA Micro SD NA Y NA Micro SD SD N SD NA SD Micro SD (16 GB) NA
Flash support N Y Y Y Y Y Y Y Y Y Y Y Y Y
Note: Some tablet specifications are estimated when official data is not available Source: Company press releases, company websites, Morgan Stanley Research
Tablet Demand and Disruption
Hardware
Technology Hardware: Cannibalization Challenges PC Vendors
Kathryn Huberty, CFA Mathew Schneider, CFA Ehud Gelblum, PhD Jasmine Lu Grace Chen Keon Han
Kazuo Yoshikawa, CFA
Technology Hardware Industry Key Debates
Debate: What impact will tablet adoption have on the PC market and traditional PC vendors?
Our view: Based on our AlphaWise survey, we believe that 29% of tablet
sales will cannibalize PC sales in 2011. At this rate, tablets will reduce PC market growth by 3 percentage points in 2011, or units by 5% over the next three years. While tablets will increase the total addressable market, many traditional PC vendors will face a net negative unit and revenue position in tablets in the near term (although EPS impact appears limited for most vendors). Longer term, the tablet impact on traditional PC vendors is more encouraging.
Debate: Will traditional PC vendors be competitive with smartphone vendors in the tablet market?
Our view: We believe that smartphone vendors are better positioned to
capture share in the tablet market than are traditional PC vendors. The one weapon traditional PC vendors have in the tablet market is price, but we do not think they will be able to capitalize until they gain scale.
Best-positioned: Apple, Samsung Electronics, Motorola Mobility, HTC,
Research in Motion, Hon Hai Precision
Potentially challenged: Hewlett-Packard, Dell, Acer, Asustek Computer,
Lenovo, Toshiba, Sony
What impact will tablet adoption have on the PC market and traditional PC vendors?
One of the key debates for traditional PC vendors is how tablet purchases will affect the PC market. Our view is that consumer tablet purchases will affect the PC market either through the deferral of a PC replacement purchase or through the outright cannibalization of a PC purchase. In the majority of cases, we think consumer tablet purchases will result in the deferral of a replacement PC purchase, effectively extending the life cycle of existing computers. We do believe that some consumer tablet purchases will result in the indefinite loss of a PC sale, but we think “pure” cannibalization will be limited in the near term. Our definition of cannibalization includes both
of these scenarios because the near-term result of each is the same—the loss of a PC sale.
Bottom line, we think that 29% of tablet purchases will
cannibalize PC sales in 2011. According to our survey, 33%
of iPad owners and those somewhat or extremely interested in purchasing a tablet said they do not need to purchase a PC after a tablet purchase (exhibit 25).
Exhibit 25
Survey Suggests ~33% of Tablet Purchases Will
Affect PC Market
% of Tablet Purchases that Impact PC Purchase Plans
40% 35% 33% 33% 0% 10% 20% 30% 40% 50% Extreme Interest Tablet owner Extreme + Somewhat Interest iPad owner n = 55 n = 1,203 n = 77 n = 335
Source: AlphaWiseSM, Morgan Stanley Research
We begin with a base cannibalization rate of 33% and then assume that only new consumer tablet purchases lead to cannibalization (exhibit 26). Essentially, we exclude commercial tablet purchases and replacement tablet purchases over time. These additional assumptions reduce our effective cannibalization assumption from 33% over the forecast horizon to 29% in 2011, falling to 21% in 2013.
Exhibit 26
Base Case PC Cannibalization Assumptions
Tablet Cannibalization of PCs - Base Case
30% 29% 21% 27% 0% 5% 10% 15% 20% 25% 30% 35% 2010 2011 2012 2013
Our view is that, in the near term, the majority of consumer tablet purchases will not result in “pure” PC cannibalization but will defer the purchase of replacement PCs. Most tablet owners still need a PC for content-creation activities, to transfer content to a tablet, and to update the tablet OS. We believe that replacement PC deferrals are the most likely outcome. Although most tablet owners still need a PC for content and OS management, we think most will extend the life of their existing PC, as they are using their old PC less, funds are limited, and PC innovation is limited to the high end of the market.
Not surprisingly, tablet owners are using their existing PCs less (exhibit 27). According to our survey, time spent on existing PCs for common content-consumption activities drops materially following a tablet purchase: Thirty-four percent of survey respondents reported a reduction in time spent on their existing PC for web browsing following a tablet purchase. Anecdotal evidence and our own tablet experience suggest that time spent on tablets tends to increase over time following the initial purchase as users discover new use cases and functionality.
Exhibit 27
Tablet Owners Not Using Old PCs as Much
for Content-Consumption Activities
% Who Reported Reduction in Time Spent on Existing PC Following Tablet Purchase
34% 31% 31% 32% 23% 25% 0% 10% 20% 30% 40% Web Browsing Email Social networking Playing games Listening to Music Watching Video
Source: AlphaWiseSM, Morgan Stanley Research
If a tablet purchase results in the deferral of a replacement PC purchase, it will have the same near-term impact as outright cannibalization—a PC sale will not occur. Even small changes to the lifecycle of consumer notebooks can have a material impact on PC sales. Our analysis suggests that a half-year extension in the consumer notebook replacement cycle reduces total PC units by 15 million, or 3%, over the next two years. We would note that this is equivalent to a tablet cannibalization rate of approximately 30% (exhibit 28).
Exhibit 28
Delaying a Notebook Replacement by Six Months Is
Equivalent to a Tablet Cannibalization Rate of ~30%
Impact on PC units from Half Year Increase In Consumer Notebook Replacement Rate
-5% -1% -3% -5% -2% -3% -3% -3% -7% -6% -5% -4% -3% -2% -1% 0% 2011 2012 2.0 > 2.5 2.5 > 3.0 3.0 > 3.5 Median
Source: IDC, Morgan Stanley Research
As we mention above, we do not think there is a high prevalence of “pure” PC cannibalization (i.e., buying a tablet instead of a new PC) at this time since most tablet users still need a PC for content-creation activities, to transfer content to a tablet, and to update the tablet OS. We would note that this dynamic could change over time and lead to higher pure cannibalization driven by the following factors: 1) more powerful tablet systems (processor and memory); 2) more robust productivity applications; and 3) over-the-air (i.e., WiFi or cellular) content-synching and OS updates. Our view is that some of these items are likely to occur, leading to upside risk to pure PC cannibalization over the medium to long term. Last, we would point out that we expect most of the tablet impact on the PC market, both replacement deferral and outright cannibalization, to occur in developed markets, since this is where we expect most of the tablet sales to occur. (However, we would note that our survey points to strong tablet demand in China.) We believe that most tablet sales are supplemental computing devices and this purchase is not feasible for many in emerging markets. According to our estimates, approximately 75% of tablet sales will occur in developed markets in 2011.
What is the impact of cannibalization on the PC market?
According to our analysis, a cannibalization rate of 21-29% is disruptive to the PC market and will reduce units by 5% over the next three years. The revenue impact is slightly less— 4%—due to higher ASPs after cannibalization. We expect that notebook/netbook shipments will take the biggest hit, falling by 8% over the same period due to cannibalization (notebook units are still up each year due to core growth, but we assume a decline in netbook sales). We do expect tablets to increase
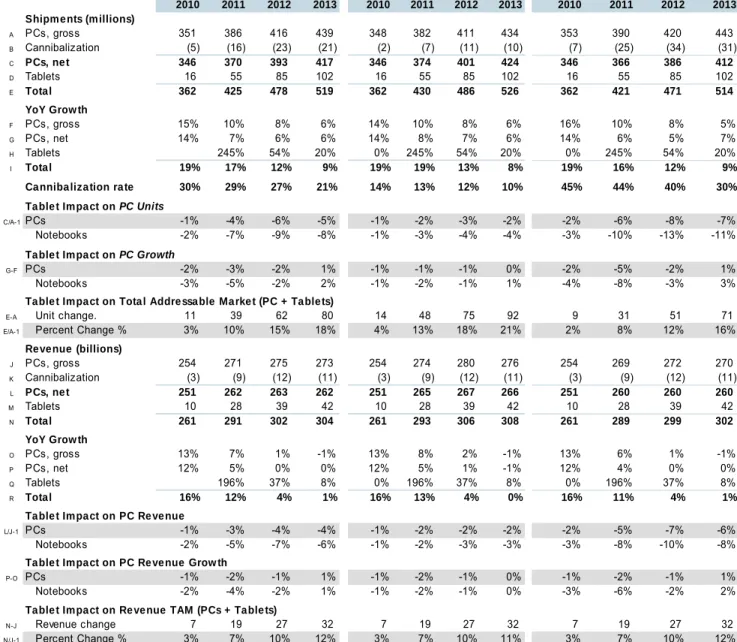
disruption in the PC market. Given the range of possible outcomes, we use scenario analysis below to illustrate the impact on the PC market at various levels of cannibalization. Assuming a tablet cannibalization rate of 10-13% in scenario B, the impact to the PC market is about half of our base case
assumption above – and what we would characterize as only a minor disruption (exhibit 29). Tablet cannibalization of 10-13% would reduce PC units by 3% and revenue by 2% over the next three years. To stress test the model, scenario C assumes a cannibalization rate of 30-44%, which reduces PC units by 6% and revenue by 5% over the same period.
Exhibit 29
Tablet Impact on PC Market Scenario Analysis
Scena rio A (Base Ca se ) Scena rio B Scenario C Canniba lization = 21-29% Cannibalization = 10-13% Cannibalization = 30-44% 2010 2011 2012 2013 2010 2011 2012 2013 2010 2011 2012 2013 Shipments (millions) A PCs, gross 351 386 416 439 348 382 411 434 353 390 420 443 B Cannibalization (5) (16) (23) (21) (2) (7) (11) (10) (7) (25) (34) (31) C PCs, ne t 346 370 393 417 346 374 401 424 346 366 386 412 D Tablets 16 55 85 102 16 55 85 102 16 55 85 102 E Total 362 425 478 519 362 430 486 526 362 421 471 514 YoY Grow th F PCs, gross 15% 10% 8% 6% 14% 10% 8% 6% 16% 10% 8% 5% G PCs, net 14% 7% 6% 6% 14% 8% 7% 6% 14% 6% 5% 7% H Tablets 245% 54% 20% 0% 245% 54% 20% 0% 245% 54% 20% I Total 19% 17% 12% 9% 19%0 19%0 13%0 8%0 19%0 16%0 12%0 9%0 Canniba lization rate 30% 29% 27% 21% 14% 13% 12% 10% 45% 44% 40% 30% Table t Impact on PC Units
C/A-1PCs -1% -4% -6% -5% -1% -2% -3% -2% -2% -6% -8% -7%
Notebooks -2% -7% -9% -8% -1% -3% -4% -4% -3% -10% -13% -11%
Table t Impact on PC Growth
G-F PCs -2% -3% -2% 1% -1% -1% -1% 0% -2% -5% -2% 1%
Notebooks -3% -5% -2% 2% -1% -2% -1% 1% -4% -8% -3% 3%
Table t Impact on Total Addressa ble Marke t (PC + Tablets)
E-A Unit change. 11 39 62 80 14 48 75 92 9 31 51 71
E/A-1 Percent Change % 3% 10% 15% 18% 4% 13% 18% 21% 2% 8% 12% 16%
Revenue (billions) J PCs, gross 254 271 275 273 254 274 280 276 254 269 272 270 K Cannibalization (3) (9) (12) (11) (3) (9) (12) (11) (3) (9) (12) (11) L PCs, ne t 251 262 263 262 251 265 267 266 251 260 260 260 M Tablets 10 28 39 42 10 28 39 42 10 28 39 42 N Total 261 291 302 304 261 293 306 308 261 289 299 302 YoY Grow th O PCs, gross 13% 7% 1% -1% 13% 8% 2% -1% 13% 6% 1% -1% P PCs, net 12% 5% 0% 0% 12% 5% 1% -1% 12% 4% 0% 0% Q Tablets 196% 37% 8% 0% 196% 37% 8% 0% 196% 37% 8% R Total 16% 12% 4% 1% 16% 13% 4% 0% 16% 11% 4% 1%
Table t Impact on PC Re venue
L/J-1 PCs -1% -3% -4% -4% -1% -2% -2% -2% -2% -5% -7% -6%
Notebooks -2% -5% -7% -6% -1% -2% -3% -3% -3% -8% -10% -8%
Table t Impact on PC Re venue Grow th
P-O PCs -1% -2% -1% 1% -1% -2% -1% 0% -1% -2% -1% 1%
Notebooks -2% -4% -2% 1% -1% -2% -1% 0% -3% -6% -2% 2%
Table t Impact on Re venue TAM (PCs + Table ts)
N-J Revenue change 7 19 27 32 7 19 27 32 7 19 27 32
N/J-1 Percent Change % 3% 7% 10% 12% 3% 7% 10% 11% 3% 7% 10% 12%
Tablet Cannibalization Impact by Vendor
Based on our assumptions of 140 million tablet shipments and a 27-29% cannibalization rate over the next two years, we believe most key traditional PC vendors will face a 1-4 million-unit headwind per year. Acer, Hewlett-Packard, and Asus are likely to absorb over 50% of the cannibalization, ba