ORIGINAL ARTICLE
*Author for correspondence. Received September 24, 2013 Revised February 08, 2014 Accepted May 17, 2014
PRODUCTION PERFORMANCE OF MAIZE IN INDIA : APPROACHING AN
INFLECTION POINT
Ranjit Kumar*, K. Srinivas, Naveen Kumar Boiroju and Pravin C. Gedam
National Academy of Agricultural Research Management, Rajendranagar, Hyderabad - 500 030, India. E-mail: ranjitkumar@naarm.ernet.in
Abstract : Maize is the third most important crop after rice and wheat in India in terms of its area coverage and contribution to total food grains production. It is grown in almost all agro-ecological regions, contributing about 22 million tonnes of grain production from about 9 million hectares of land. The production pattern as well as its consumption pattern has dramatically changed in India in the recent past. However, the average crop yield of 2.5 t/ha is still very low as compared to the other Asian countries like Bangladesh (6.8 t/ha), China (5.7 t/ha), Indonesia (4.6 t/ha) and Pakistan (3.8 t/ha) in 2012 (FAOSTAT). This paper has examined the growth and instability in maize production in the major districts of major maize growing States in the country. An attempt has also been made to forecast its production in near and mid-term under different scenarios. The results showed that more than 60 per cent of maize area is observed to be having maize yield less than 2 t/ha. At the same time, huge variability in maize yield between and within the maize growing States was also found. However, the maize yield is estimated to increase little more than 3 t/ha by the year 2020, if the current policy and macro-economic environment continues. It is also expected that the demand for maize in domestic as well as in international market will grow faster than the production growth, creating very good potential for Indian maize in the near future. Therefore, to meet the future growing demand of maize in domestic as well as international market, it is desired to have different growth pathway than the existing trend. To realize that kind of inflection point, India has to gear up its logistics and supply chain to handle the near-double size of the maize output in coming years.
Key words : Maize, Forecasting, Growth, Instability, Box-Jenkins methodology and Artificial Neural Networks.
1. Introduction
Maize (Zea mays L) is a cereal grain, also known as Queen of Cereals due to its diverse usages. In India, it is cultivated in most of the States throughout all the seasons. Depending on the regions and socio-economic conditions of the population, the maize-grain is used for various purposes including food, feed, fodder, green cobs, sweet corn, baby corn, popcorn, starch and several industrial products. According to the fourth advance estimates of the Ministry of Agriculture, Government of India, maize in India occupied about 8.7 million hectares (M ha) of the area and produced about 22.2 million tonnes (Mt) of maize grain during 2012-13. It is about 15 per cent and 5 per cent to total maize-area, while 8 per cent and 2.4 per cent to total production in Asia and the world, respectively [FAOSTAT (2013)].
In the past two decades, production performance in India has been significant as compared to the previous periods. The total maize production in the country has doubled within 15 years from about 10 Mt in 1992-93 to 20 Mt in 2008-09. However, this growth can be equally
attributed to area expansion under the crop as well as improvement in the yield, as both has increased by around 40 per cent in the same period. During this period, the country has witnessed a tectonic shift in maize growing regions. Till 1990s, Bihar, Madhya Pradesh, Rajasthan and Uttar Pradesh were the major maize-producing States, but the southern States especially Andhra Pradesh and Karnataka became the predominant maize-growing states from the last two decades [Gulati and Dixon (2008)]. More recently, Maharashtra and Tamil Nadu are also emerging as very important maize growing States. The new territory of the crop has also pushed the crop yield up significantly due to the clement weather condition in the region. Although, the improvement in average crop yield (2.55 t/ha in 2012-13) has not been very encouraging, which is far lower than that realized in many other Asian countries like Bangladesh (6.8 t/ha), China (5.7 t/ha), Indonesia (4.6 t/ha) and Pakistan (3.8 t/ha) in 2012.
The maize production in India has been largely driven by the growing demand from the feed industry and various industrial usage. According to existing literatures, the utilization pattern of maize at present includes 51 per cent
as poultry feed, 20-25 per cent as human food, 10-12 per cent as cattle feed, about 10-12 per cent going towards industrial processing like starch and brewery and 1 per cent as seed [DMR (2012) and USDA (2013)]. As the demand for maize is increasing due to its multiple uses, it is important to understand the existing maize situation, so as to plan the future based on the past and present situation. On the other hand, it should also be kept in consideration that the spatio-temporal variations in projected changes in temperature and rainfall are likely to lead to differential impacts on maize yield in the different regions in India [Kattarkandi et al. (2010)]. In this paper, the current situation of maize production in India has been analyzed and forecasting of area, production and yield (APY) of maize in India has been done under different scenarios. The findings are expected to provide the guidelines to different stakeholders in the maize sector to meet the changing demand in the future.
2. Data and Methodology
For the study, the high frequency data at district-level on area, production and yield of maize was collected for the period 1986-87 to 2012-13 from the Directorate of Economics and Statistics, Department of Agriculture and Cooperation, Ministry of Agriculture, Government of India. The growth performance of area, production and yield of maize was analyzed by estimating compound annual growth rates (CAGR) by fitting a semi-log trend equation of the following form [Bartlett (1993)]
ln Y = a + bt
where ‘Y’ defines the time series data of APY of maize, ‘t’ is the trend, ‘a’ is the constant coefficient and ‘b’ is the ln (1 + CAGR). Thus,
CAGR = {antilog (b)–1}*100.
Instability is one of the vital decision parameters in development dynamics and more in the context of varying agricultural area and yield. The high growth accompanied by low levels of instability in yield for any crop is desired for sustainable development of agriculture [Tripathi and Prasad (2009)]. The instability in maize production is measured by the Cuddy-Della Valle index (CDI). The index corrects the coefficient of variation (CV), which overestimates the level of instability in time-series data characterized by long term trends [Cuddy-Della Valle (1978)]. It is estimated by
CDI = CV* (1 – adj R2)0.5, where CV is the
Coefficient of variation and R is the coefficient of determination.
Three forecasting models namely, autoregressive integrated moving average (ARIMA) model, growth
model and artificial neural networks model were considered for the prediction of area, yield and production of maize for the years 2012 to 2020, based on the data available for the period 1986-2011. The ARIMA technique is based on the principle that a stationary process can often be parsimoniously represented by a mixture of autoregressive and moving average models. Even a non-stationary series after proper differencing, can be treated as a stationary series [Box et al. (1994)]. In case of growth model, Zt exp
b
abtg
e is estimated, where ‘Zt’ denotes the forecast value; ‘t’represents the time (year) and ‘e’ represents the error. The constants of the growth model are determined using least squares method.
Artificial neural networks (ANN) are inspired by biological systems, particularly by research into the human brain. Currently, ANNs are being used for a wide variety of tasks in many different fields of business, industry and science. One major application of ANNs is forecasting, which is used as an alternative tool for both forecasting researchers and practitioners. Haykin (1999), Zhang et al. (1998) and Boiroju (2012) presents the neural networks methodology and its application in time series forecasting. In feed forward neural networks, the relationship between the output Zt and the inputs Zt-1,
Zt-2, …, Zt-p is as follows: Zt jf ij t i e i= p oj j= q 0
F
HG
I
KJ
1 1in which 0 and oj denote the weights of the connection between the constant input (bias) and the output and between the bias and hidden nodes, respectively and p is the number of input nodes, q is the number of hidden nodes, while {j, j = 1, 2, …, q} is a vector of weights from the hidden nodes to output nodes and {ij, i = 1, 2, …, p; j = 1, 2, …, q} are weights from the input nodes to hidden nodes. f denotes the transfer function used in the hidden layer. Transfer functions such as the logistic or hyperbolic tangent functions are commonly used for time series data; as they are non-linear and continuously differentiable, which are desirable properties for network learning [Kastra and Boyd (1996)]. Feed forward neural networks is used with hyperbolic tangent function as an activation function under two hidden units in a single hidden layer and the time variable taken as the input for the network to predict the future APY of maize.
The above-mentioned three time series methods were used to predict the area and yield of maize in major States. Among these, the model was selected which has the minimum forecasting error. In this study, it was observed that the ANN models performed better than the growth and ARIMA models. Therefore, the forecasts of maize
area and yield were estimated using ANN models represented by scenario-I or ‘Business As Usual’ (BAU). The production of maize was taken as the product of the area and yield. Two more alternate scenarios were also developed. Under scenario-II, it was assumed that the area under the crop would expand according to its past trend or BAU-way, but adoption of hybrid may increase up to 75 per cent of the maize area by 2020. At the same time, the yield of hybrid maize may grow to reach up to 5 t/ha by 2020. Under Scenario- III, it is assumed that there may not be any further growth in maize area from the current level of 8.7 M ha, however all efforts may be made to cover 90 per cent of the maize area by hybrids with an average yield growing to touch 5 t/ha by 2020.
3. Maize Trends in India
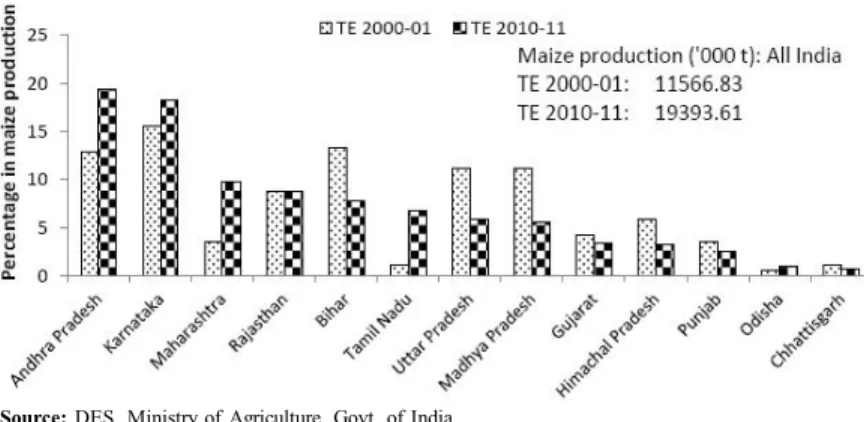
In this section, the results of past performances of the area, production and yield of maize for different States are presented. From perusal of the findings, it was observed that four States namely Karnataka, Rajasthan, Andhra Pradesh and Madhya Pradesh together constituted about 48% of the total maize area in the country. As compared to TE 2000-01, the percentage share of Karnataka, Andhra Pradesh, Maharashtra and Tamil Nadu to the total maize area in the country has increased significantly in TE 2010-11, while it has declined in Rajasthan, Madhya Pradesh, Uttar Pradesh, Bihar, Himachal Pradesh and Punjab (Fig. 1). The area under the crop in Tamil Nadu, Maharashtra and Karnataka has escalated by 3.47, 2.54 and 2.07 times, respectively during this period. Contrary to it, the traditional maize growing States like Bihar, Himachal Pradesh, Madhya Pradesh and Uttar Pradesh have witnessed a decline in the crop area during the same period.
It is important to note that the states where maize area started contracting are traditional maize belt. The maize-growers in these States prefer to grow open pollinated varieties (OPVs) or composites, mainly for domestic consumption. Besides, it is mainly grown in Kharif season as rainfed crops with low inputs. The yield in Odisha, Himachal Pradesh, Rajasthan, Uttar Pradesh, Chhattisgarh, Gujarat and Madhya Pradesh was below the national average yield (Fig. 2). On the other hand, in Andhra Pradesh, Tamil Nadu, Karnataka and Maharashtra, there was significant jump in the crop yield due to better hybrid adoption, as well as relatively high input use [ASG (2012)]. Andhra Pradesh and Madhya Pradesh have almost the same area, but these two States differed significantly in the yield level. Similarly, Uttar Pradesh and Maharashtra has the same area, but the yield is 1.48 t/ha and 2.50 t/ha, respectively, while the maize area in Himachal Pradesh and Tamil Nadu are
equal,but these two States differed significantly in the yield at 2.13 t/ha and 4.44 t/ha, respectively in TE 2010-11.
In terms of production, four States Karnataka, Andhra Pradesh, Maharashtra and Tamil Nadu together contributed about 55 per cent of total maize production in India. During the past ten years, the highest change was observed in Andhra Pradesh, Maharashtra and Tamil Nadu (Fig. 3). A significant increase in the maize area and production during this period has happened mainly due to the introduction of single crossed hybrids and implementation of Government of India sponsored ‘Integrated Scheme of Oilseeds, Pulses, Oilpalm and Maize’ (ISOPOM), as well as shift in growing season from Kharif to Rabi in many States [Dass et al. (2010) and DMR (2012)]. For the popularization of hybrid maize in the country, several State governments also started promotional programmes in public-private-partnership mode to launch the projects like ‘Project Sunshine’ in Gujarat, the ‘Golden Rays Project’ in Rajasthan, ‘Project Golden Days’ in Odisha, ‘Makka Vikas Pariyojana’ in Madhya Pradesh and the ‘Project Rainbow’ in Jammu & Kashmir.
4. Spread and Growth Performance of Maize
The past growth of maize in several States has pushed other crops to the margin in India. During the past five years, there was a negative growth in the area for sunflower, bajra, ragi, groundnut, jowar, small millets and cotton to some extent in Andhra Pradesh, Maharashtra and Karnataka at the cost of maize. Initially, maize had replaced rice and wheat in Bihar, Madhya Pradesh and Uttar Pradesh, however latter crops started regaining its lost ground. According to the maize production data for the year 2011-12, all the maize-growing States with more than one per cent of the total maize area in India can be categorized asHigh maize Andhra Pradesh and Tamil Nadu, productivity states: together constitute about 13 per cent (yield: > 4 t/ha) of the total maize area in the country. Medium maize Bihar, Himachal Pradesh, Karnataka, productivity states: Maharashtra, Odisha, Punjab and (yield: 2-4 t/ha) West Bengal together constitute about 40.15 per cent of the total maize area in the country.
Low maize Chhattisgarh, Gujarat, Jammu & productivity states: Kashmir, Jharkhand, Madhya (yield: < 2 t/ha) Pradesh, Rajasthan and Uttar Pradesh together representing 43.78 per cent of the total maize area in the country.
In terms of maize yield, the top ten districts were: Guntur (9.7 t/ha), Krishna (7.8 t/ha), Nellore (7.5 t/ha),
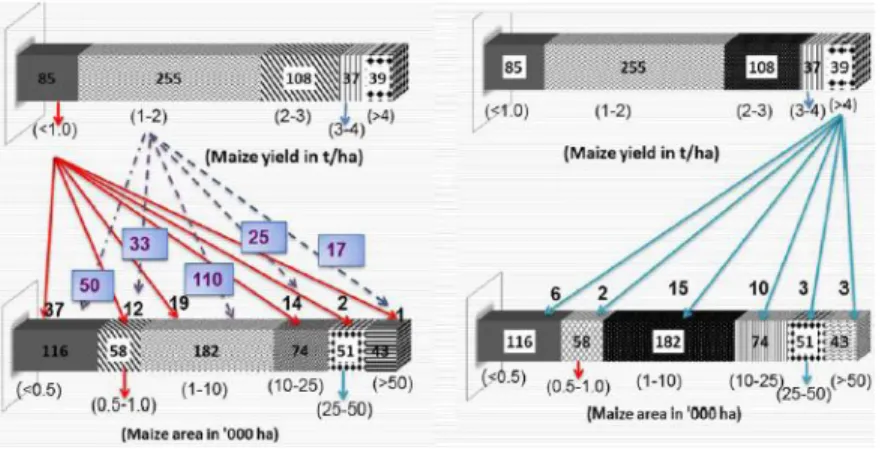
100 thousand hectares area under maize crop (Fig. 4). These were Karimnagar and Mahaboobnagar in Andhra Pradesh; Dahod and Panchmahals in Gujarat; Belgaum, Davangere and Haveri in Karnataka; Aurangabad and Nasik in Maharashtra and Banswara, Bhilwara, Chittorgarh and Udaipur in Rajasthan. The highest maize area in India was observed in the Bhilwara district of Rajasthan. Out of 640 districts in India, maize was cultivated in 524 districts, out of which 408 districts in 25 States had at least 500 ha maize area, while 168 districts had more than 10 thousand ha under maize cultivation. Maize productivity also varies widely across the districts in these States of India. There were 76 districts which harvested maize grain more than 3 t/ha, cultivating maize area in the range of less than 500 ha to more than 50,000 ha. In contrast, 340 districts had maize yield less than 2 t/ha. These districts had maize area ranging from less than 500 ha to 10,000 ha. There were three districts in Rajasthan having more than 25,000 ha of area under maize cultivation, but harvested less than 1 t/ha of maize grain. The reasons behind such a low yield in these States are: maize is grown as a rainfed crop and secondly, it is used mainly as a food crop, for which traditional or composite varieties are preferred giving poor yields. In this context, it is important to note that many rainfed districts have large maize-area but with poor yield.
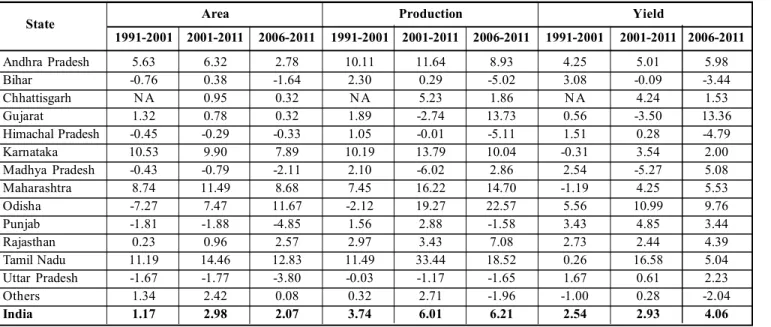
The growth in area, production and yield of maize in major States in India are presented in Table 1. It can be observed that the area under the crop and its yield have grown by about 3 per cent annually in the past decade in India, though the area growth has declined in recent years, Source: DES, Ministry of Agriculture, Govt. of India
Fig. 1 : Change in maize area in major growing states in India.
Source: DES, Ministry of Agriculture, Govt. of India
Fig. 2 : Change in maize yield in major states in India.
Source: DES, Ministry of Agriculture, Govt. of India
Fig. 3 : Change in maize production in major growing states in India.
West Godavari (7.2 t/ha), Prakasam (7.2 t/ha), Cuddapah (7.2 t/ha), East Godavari (6.9 t/ha) and Srikakulum (6.28 t/ha) from Andhra Pradesh and Erode (7.2 t/ha) and Pudukkottai (6.5 t/ha) from Tamil Nadu. More importantly, major chunk of maize area i.e. about 44 per cent of maize area, spread across the rest of the States harvested less than 2 t/ha of maize yield, which invites special attention of researchers and policy makers. Most of the maize-growing districts in Gujarat, Madhya Pradesh, Odisha, Rajasthan, Uttar Pradesh, Jharkhand and North-Eastern states had yields in the range of 1-2 t/ha.
From district-level analysis, it has been observed that only 13 districts spread across five States had more than
while that of yield has accelerated to 4 per cent. Among the major States, the pace of area expansion under maize has been faster in Tamil Nadu, Maharashtra, Karnataka and Andhra Pradesh during the period 1991-2011. Similarly, the growth in maize yield has been fastest in Tamil Nadu followed by Odisha, Andhra Pradesh, Punjab, Maharashtra and Karnataka during the period 2001-2011. However, opposite to it, negative growth in area as well yield was recorded in Bihar and Himachal Pradesh during the past five years. Thus, new production regions like Andhra Pradesh, Karnataka, Maharashtra, Odisha and Tamil Nadu have shown tremendous potential with very high growth both in acreage and productivity of maize in recent years.
of private seed companies in developing hybrid seed market and huge demand traction from poultry sector as feed. The growth in production during this period was well supported by an increase in acreage apart from an increase in the yield.
The growth and instability of maize yield in major maize growing States in India are presented in Table 2. In India, maize area is growing only in few States, like Andhra Pradesh, Karnataka, Maharashtra and Tamil Nadu. In other States, it either seized to expand or started declining. As far as the growth and instability in the yield are concerned, Tamil Nadu and Odisha have noticed high growth in yield with high and low instability, respectively. Andhra Pradesh, Karnataka and Chhattisgarh have grasped medium growth in yield with medium instability while Maharashtra and Punjab have accrued medium growth in yield with low instability. Rajasthan alone has more than 13 per cent area, but had slow growth in the yield with high instability. This is mainly due to the fact that maize is grown in Kharif season in the state with low inputs and almost no irrigation. More disappointing situations appeared from Gujarat, Madhya Pradesh and Bihar, where the maize has witnessed negative growth in yield with high, medium and low instability, respectively.
5. Outlook of Maize
As in the 2013 Kharif season, maize planting has set the pace in India and if weather conditions remain clement, the trend indicates that maize-growers intend to plant the largest area ever. The forecast of maize area, production and productivity was done for all the major growing States on the basis of past experiences of technological and policy changes implied in the previous observations. The results assume that if the pace of change in policy, technology adoption and input use would remain same. These forecasts are subject to statistical errors and they are indicative of the outlook of maize in major maize-producing States. The Source: Author.s calculations
Fig. 4 : Distribution of 524 maize-growing districts in India according to maize yield and area under the crop, TE 2010-11.
Source: Authors. estimation
Fig. 5 : Forecasts of APY of maize in India under scenario-I.
Source: Authors’ estimation
Fig. 6 :Expected share of major states in total maize production in India (2015-2020).
In late 1990s, use of single cross hybrids and a significant shift from Kharif to Rabi season for maize cultivation in several States came into being rapidly in most of the States. The improved growth in the APY of maize could happen due to the new paradigm shift in the seed policy, supportive price policy, active participation
maize area and yield in the country are denoted by Xt and Yt, respectively. The ANN prediction model for the maize area and yield are given by
respectively, where h Tanh t t t 1 11 21
F
HG
I
KJ
F
HG
I
KJ
, h Tanh t t t 2 21 22 F
HG
I
KJ
F
HG
I
KJ
for t = 1986, 1987,…, 2020. The mean and standard deviations of the variables are represented by µ and , respectively. The variable t is standardized with linear-norm method to reduce the error. The parameters of the prediction model for the maize-area in the country are approximated to three decimal places and are given by µt = 1999, t = 8.5, µa = 6852.497, a = 1038.045, 11 = -0.008, 21 = 0.381, 12 = -0.8, 22 = 1.157, 0 = 0.525, 1 = 0.452, and 2 = 1.36. Similarly, the parameter values for the prediction model of the maize-yield in the country are µt = 1999, t = 7.415, µy = 1822.886, y = 391.198, 11 = -1.398, 21 = 0.828, 12 = -0.679, 22 = -0.348, 0 = 0.296, 1 = 1.854 and 2 = -1.98. The maize production in India was estimated by taking the product of the area and yield. The forecasts of the area, production and yield presented in the Fig. 5, reveal that the area under maize may further increase in future also and may reach to about 9 M ha. Similarly, the production is also going to boost up with the addition of more than 4 Mt of maize grain. However, the yield may be increasing slowly and likely to improve marginally from current level of 2.55 t/ha to 3.17 t/ha in 2020-21.The increase in the maize production in the future is expected to come from Karnataka, Maharashtra and Tamil Nadu States. The maize area is expected to further grow in Andhra Pradesh, Maharashtra, Karnataka and Tamil Nadu (Fig. 6). Karnataka is expected to maintain its prime position in the near future also, with the total maize production of 5.7 Mt by 2020-21.In Maharashtra, maize is expected to outperform on account of a huge expansion in the maize area to 1.2 Mha and thereby production will rise to 4 Mt while productivity will increase to 3.4 t/ha by 2020-21.Tamil Nadu is one of the fastest emerging maize-producing States in India because of growing poultry and feed industries. The area, production and productivity of maize in the State would be 0.32 Mha, 2.0 Mt and 6.25 t/ha, respectively. Bihar, Madhya Pradesh and Uttar Pradesh are the traditional maize-growing States, where opportunity for area expansion under maize is very limited and the gain in its production is expected only from productivity gain due to improvement in adoption of hybrid seeds and better seed replacement rate. In Punjab, even after all the efforts by the government for crop diversification, maize may struggle to gain extra acreage, however, gain in maize productivity would be greatest among all the States. Other States like Odisha, Gujarat, Chhattisgarh and Rajasthan have also mixed results, where maize area or yield or both may
increase in the future with different paces.
During the past eight years (2005-2012), the average annual increment in maize area was 140 thousand hectares and in maize yield was 77 kg/ha. However, the forecasts show an average annual increment in maize area of about 25 thousand hectares and in maize yield of about 64 kg/ha in the next eight years (2013-2020). Thus, the growth in maize production is expected to be more yield-based than the area-based. Currently, it is estimated that only about 56 per cent of maize area is under hybrids, where maize yield is more than national average. Therefore, assuming the before-mentioned analysis as scenario-I viz. ‘Business As Usual’ (BAU) scenario, two more scenarios have been assumed for forecasting of maize production at the national level. The forecasts presented under three alternate scenarios, given in Table 3, indicate that even if area under maize seizes to expand and efforts are made to increase area under the hybrids, the total maize production can touch 44 Mt by 2020 (Scenario III). This is only possible when overall hybrid maize yield improves to 5 t/ha by the year 2020. However, if maize area expands along with the adoption of hybrids a bit slowly (Scenario II), then the total maize production may reach 37 Mt. This may offer a modest surplus of 5-10 Mt of maize for export.
However, it is pertinent to mention that with expected maize production to be doubled in next 7-8 years also require significant improvement in logistics and supply chain like storage, warehousing, transportation and grading and processing. Moreover, with the recent implementation of National Food Security Act (2013) and ongoing National Food Security Mission (NFSM) may put pressure on maize crop and overall area under the crop may not increase further. Thus, there is a need to increase the adoption of hybrids and thereby, maize yield in much faster way than the existing past trends. This inflection point will help the country to meet the future growing demand of poultry and livestock feed as well as tap the opportunity in export market. Currently, poultry sector is growing by 9 per cent per annum and expected to continue in the future. Growing demand from poultry and feed sector in India is expected to significantly hike maize consumption to go over 30 Mt by 2020 [Rattanani (2006), Falcon (2008), ASSOCHAM (2009), Chennakrishnan and Raja (2012)]. The projections show a surplus production in the country, which can be exported to the Southeast Asian countries. Similarly, there is huge maize export market of the size of about 50 Mt in Asia itself, in which India is contributing 4 Mt only in 2012 [UNCOMTRADE (2013)]. With improvement in the yield and thereby reducing the cost of production, the grain can be internationally competitive.
Table 1 : CAGR (%) in APY of maize in major maize-growing states of India.
Area Production Yield
State 1991-2001 2001-2011 2006-2011 1991-2001 2001-2011 2006-2011 1991-2001 2001-2011 2006-2011 Andhra Pradesh 5.63 6.32 2.78 10.11 11.64 8.93 4.25 5.01 5.98 Bihar -0.76 0.38 -1.64 2.30 0.29 -5.02 3.08 -0.09 -3.44 Chhattisgarh N A 0.95 0.32 N A 5.23 1.86 N A 4.24 1.53 Gujarat 1.32 0.78 0.32 1.89 -2.74 13.73 0.56 -3.50 13.36 Himachal Pradesh -0.45 -0.29 -0.33 1.05 -0.01 -5.11 1.51 0.28 -4.79 Karnataka 10.53 9.90 7.89 10.19 13.79 10.04 -0.31 3.54 2.00 Madhya Pradesh -0.43 -0.79 -2.11 2.10 -6.02 2.86 2.54 -5.27 5.08 Maharashtra 8.74 11.49 8.68 7.45 16.22 14.70 -1.19 4.25 5.53 Odisha -7.27 7.47 11.67 -2.12 19.27 22.57 5.56 10.99 9.76 Punjab -1.81 -1.88 -4.85 1.56 2.88 -1.58 3.43 4.85 3.44 Rajasthan 0.23 0.96 2.57 2.97 3.43 7.08 2.73 2.44 4.39 Tamil Nadu 11.19 14.46 12.83 11.49 33.44 18.52 0.26 16.58 5.04 Uttar Pradesh -1.67 -1.77 -3.80 -0.03 -1.17 -1.65 1.67 0.61 2.23 Others 1.34 2.42 0.08 0.32 2.71 -1.96 -1.00 0.28 -2.04 India 1.17 2.98 2.07 3.74 6.01 6.21 2.54 2.93 4.06
Table 2 : Distribution of maize area and production on the basis of growth and instability in yield in India.
CAGR in yield (2001 - 2011)
Negative Slow (0 - 3%) Medium (3 - 6%) High (6% & above)
Low (<10%) Bihar (7.44%, 7.75%) Others (10.36%, 7.46%) Maharashtra (8.99%, 9.71%), Odisha (1.00%, 0.98%)
Punjab (1.66%, 2.50%)
Medium (10-20%) Madhya Pradesh Uttar Pradesh (9.12%, Andhra Pradesh (9.83%, 19.31%) —
(9.84%, 5.49%) 5.83%), Himachal Pradesh Karnataka (14.5%, 18.22%)
(3.54%, 3.26%) Chhattisgarh (1.21%, 0.73%)
High (20-30%) Gujarat (5.91%, 3.43%) Rajasthan (13.12%, — Tamil Nadu (3.49%,
8.64%) 6.70%)
Figures within parentheses indicate percentage of total maize area and total maize production in India, respectively. ‘-’ shows that no state falls under the respective combination of growth and instability.
Source: Computed from the data of Ministry of Agriculture, Government of India.
Yield Instability (CDI)
Table 3 . Projections of APY of maize in India based on three scenarios.
Scenario I Scenario II Scenario III
(Business As Usual) (Area growing as usual, adoption of hybrid (No area growth, adoption of hybrid reaches 75% & average yield from hybrid reaches 90% & overall average
adopted area touching 5 t/ha in 2020) yield touches 5 t/ha in 2020)
Area Production Yield Area Production Yield Area Production Yield
(M ha) (Mt) (t/ha) (Mha) (Mt) (t/ha) (Mha) (Mt) (t/ha)
2012* 8.71 22.23 2.55 8.71 22.23 2.55 8.71 22.23 2.55 2013 8.77 23.34 2.66 8.77 23.72 2.70 8.71 23.86 2.74 2014 8.83 24.24 2.75 8.83 25.29 2.87 8.71 25.72 2.95 2015 8.86 25.09 2.83 8.86 26.96 3.04 8.71 27.83 3.20 2016 8.90 25.89 2.91 8.90 28.75 3.23 8.71 30.24 3.47 2017 8.92 26.63 2.99 8.92 30.68 3.44 8.71 32.98 3.79 2018 8.94 27.31 3.05 8.94 32.76 3.66 8.71 36.09 4.15 2019 8.96 27.91 3.12 8.96 35.00 3.91 8.71 39.62 4.55 2020 8.97 28.45 3.17 8.97 37.43 4.17 8.71 43.63 5.01
Source: Authors’ estimation.
Note: *Data for 2012 are actual observations for area, production and yield as per 4th advance estimates by Department of Agriculture & Cooperation, Govt. of India.
6. Conclusion
The phenomenal growth in the production and its spread across the regions proved maize a golden grain in India. Its diversified usage as food, feed and other multifarious industrial derivatives make the crop special and apart from any other cereals. Hitherto, the increase in production has been due to expansion in area under the crop as well as slow and steady improvement in its yield. Maize in India has explored new regions and seasons, where it is performing relatively faster, while in traditional belt, it started shrinking. Stagnant or negative production has been observed from Bihar, Madhya Pradesh and Uttar Pradesh. Contrary to it, maize production and productivity has improved significantly in
Andhra Pradesh, Karnataka, Maharashtra and Tamil Nadu.
Though, 56 per cent of the maize growing districts spread across the 25 States are harvesting less than 2 t/ha yield. Besides, the current national average yield of 2.55 t/ha is quite low as compared to that in any other Asian countries. This calls for strategic change in the approach and give a positive shock to the system so that the resultant inflection point can add better yield growth in the future. If the past pattern continues, the maize area, production and yield are expected to be 9 Mha, 28.5 Mt and 3.2 t/ha, respectively by 2020, while based on the alternate two scenarios, it is expected that if the productivity is improved to 4.2 t/ha and 5 t/ha, the total maize grain production may reach to 37 Mt (in Scenario-II) and 44 Mt (in Scenario-III), respectively. These forecasts, however, would warrant to have concerted efforts in developing and making available quality hybrid seeds suiting to different agro-climatic regions. The outlook also put bigger challenges to deck up the entire supply chain in maize sector to evacuate the almost double production to avoid any glut in the market. Moreover, with the congenial policy environment, India can participate in maize export market in a big way in the coming years.
Acknowledgements
The paper is based on the findings of ongoing research project on “Assessment of the maize situation, outlook and investment opportunities in Asia” funded by CIMMYT, Mexico. NAARM, Hyderabad is the lead centre of the project and other country partners include from Bangladesh, China, Indonesia and Pakistan. Therefore, the research team duly acknowledge the financial support provided by CIMMYT, Mexico under MAIZE-CRP.
References
ASG (2012). Agricultural Statistics at a Glance -2012, Directorate of Economics and Statistics, Department of Agriculture and Cooperation, Ministry of Agriculture, Govt. of India, New Delhi.
ASSOCHAM (2009). Growth in poultry farming will push maize consumption 30 Mt by 2020. Available on http://www.dare.co.in/ n e ws / o th e r s/ g r o wt h in p ou lt r yf a rm in g p u s h m a iz e
-consumption-30 -mt-by-2 020-assocham.htm (verified
17.07.2013).
Bartlett, A. A. (1993). The arithmetic of growth : methods of calculation, population an d en viron ment. Jo urn al of Interdisciplinary Studies, Vol. 14,No. 4, March 1993. Boiroju, N. K. (2012). Forecasting Foreign Exchange Rates using
Neural Networks, Unpublished Ph.D. Thesis, Department of Statistics, Osmania University, Hyderabad.
Box, G. E. P., G. M. Jenkins and G. C. Reinsel (1994). Time series analysis forecasting and control, 3rd ed., Englewood Cliffs, N.J. Prentice Hall.
Chennakrishnan, P. and K. Raja (2012). Maize production in India: fighting hunger and malnutrition, Facts for You, November, 2012. Cuddy, J. D. A. and P. A. Della Valle (1978). Measuring the instability of time series data, Oxford Bulletin of Economics and Statistics,
40(1), 79–85.
Dass, S., A. Manivannan, J. Kaul, A. Singode, J. C. Sekhar and G. K. Chikkappa (2010). Inbred-hybrid technology in maize, Technical Bulletin No. 2010/1, Directorate of Maize Research, New Delhi. Available onlin e at http:// issuu.com/kisan admin/docs/ inbrid_hybrid_tehcnology_in_maize_-mani (accessed on 10.08.2013).
DMR (2012). Maize production technologies in India. Directorate of Maize Research, New Delhi.
Falcon, W. P. (2008). The Asian maize economy in 2025. In: Gulati, A. and Dixon, J. (eds.), Maize in Asia: Changing Markets and Incentives. Academic Foundation, New Delhi, pp. 435-456. FAOSTAT (2013). Food and Agriculture Organization Corporate
Statistical Database. Available online at http://faostat3.fao.org/ faostat-gateway/go/to/browse/Q/QC/E.
Gulati, A. and J. Dixon (2008). Maize in Asia : Changing Markets and Incentive, Published by Academic Foundation, New Delhi. Haykin, S. S. (1999). Neural Networks: A Comprehensive Foundation,
Upper Saddle River, N.J., Prentice Hall. 16.
Kastra, I. and M. Boyd (1996). Designing a neural network for forecasting financial and economic time series. Neurocomputing,
10, 215-236.
Kattarkandi, B., N. K. Soora and P. K. Aggarwal (2010). Simulating impacts, potential adaptation and vulnerability of maize to climate change in India. Mitigation and Adaptation Strategies for Global Change, 15, 413-431.
Rattanani, J. (2006). India to see tremendous changes. World Poultry,
22(6), 10-12.
Tripathi, A. and A. R. Prasad (2009). Agricultural development in India since independence : A study on progress, performance, and determinants. Journal of emerging knowledge on emerging markets, 1(1), Article 8, p. 63-92.
UNCOMTRADE (2013 ). United Nations Commodity Trade Statistics Database. Available online at http: //comtrade.un.org/ db/ (verified 18.07.2013).
USDA (2013). India- Grain and Feed Annual, 2013, USDA-Foreign Agricultural Service, GAIN Report No.IN3012.
Zhang, G., B. E. Patuwo and M. Y. Hu (1998). Forecasting with artificial neural networks: The state of the art. International Journal of Forecasting, 14, 35-62.