Dis cus si on Paper No. 11-052
The Construction of a
Low Cost Airline Network
Kai Hüschelrath, Kathrin Müller,
and Volodymyr Bilotkach
Dis cus si on Paper No. 11-052
The Construction of a
Low Cost Airline Network
Kai Hüschelrath, Kathrin Müller,
and Volodymyr Bilotkach
Die Dis cus si on Pape rs die nen einer mög lichst schnel len Ver brei tung von neue ren For schungs arbei ten des ZEW. Die Bei trä ge lie gen in allei ni ger Ver ant wor tung
der Auto ren und stel len nicht not wen di ger wei se die Mei nung des ZEW dar.
Dis cus si on Papers are inten ded to make results of ZEW research prompt ly avai la ble to other eco no mists in order to encou ra ge dis cus si on and sug gesti ons for revi si ons. The aut hors are sole ly
respon si ble for the con tents which do not neces sa ri ly repre sent the opi ni on of the ZEW. Download this ZEW Discussion Paper from our ftp server:
Non-technical Summary
In a number of industries, the success and sustainability of a new firm’s busi-ness strategy is tied to its sequential decisions to enter multiple markets. In all these industries, firms face the key challenge to optimize the sequence of entries in a number of different markets - taking into account possible inter-nal resource constraints and exterinter-nal barriers to entry - in order to operate profitably and to build-up a sustainable market presence. In designing such a sustainable entry pattern, a new entrant typically has to decide on the optimal mixture of two distinct entry strategies: entering existing markets and facing competition of incumbent firms and entering new markets which can be expected to contribute to the overall profitability and success of the company.
We focus on the domestic U.S. airline industry in order to empirically estimate entry decisions and their timing. We distinguish between entry into new markets, i.e. markets which have not been served directly by another airline in the year prior to the entry, and entry into existing markets, i.e. markets which were already served directly by another airline. In particular, we investigate the construction of a low cost airline network. We choose JetBlue as our unit of observation, first, because of its amazing success story. JetBlue can be seen as the only significant and successful entrant in the domestic U.S. airline industry in the last two decades. Within 10 years this airline rapidly grew becoming the 9th largest U.S. airline in 2009. Second, we chose JetBlue because it is the only entrant we can observe from its inception and track its development over almost a decade.
Adopting duration models with time-varying covariates, we find that Jet-Blue consistently avoided concentrated airports and targeted concentrated routes; network economies also affected entry positively. For non-stop entry into a route that has not been served on a non-stop basis before, our analy-sis reveals that the carrier focused on thicker routes and secondary airports, thereby avoiding direct confrontation with network carriers. Non-stop entry into existing non-stop markets, however, shows that JetBlue concentrated on longer-haul markets and avoided routes already operated by either other low cost carriers or network carriers under bankruptcy protection.
Das Wichtigste in K¨
urze
In vielen Branchen h¨angt der Erfolg und die Nachhaltigkeit der Unterneh-mensstrategie eines neuen Unternehmens auch von deren sequentiellen Ein-trittsentscheidungen in unterschiedliche M¨arkte ab. Unter Ber¨ucksichtigung der eigenen Ressourcen und m¨oglicher Markteintrittsbarrieren spielt dabei auch der Zeitpunkt des Markteintritts eine entscheidende Rolle. Beim De-sign einer nachhaltigen sequentiellen Markteintrittsstrategie muss ein Un-ternehmen typischer Weise auch ¨uber die f¨ur es optimale Mischung zweier M¨oglichkeiten entscheiden: die Erschließung neuer M¨arkte, auf denen das Unternehmen eine (vorl¨aufige) Monopolstellung erh¨alt und den Eintritt in existierende M¨arkte, in denen es in Konkurrenz zu den etablierten Anbietern tritt.
Am Beispiel der inneramerikanische Luftverkehrsbranche untersuchen wir Markteintrittsstrategien und deren zeitliche Wahl. Wir unterscheiden zwi-schen Markteintritten in neue M¨arkte, d.h. Strecken, die noch von keiner anderen Fluggesellschaft direkt bedient werden, und Markteintritten in exis-tierende M¨arkte, d.h. direkte Strecken, auf denen schon mindestens ein an-derer Wettbewerber aktiv ist. Im Besonderen betrachten wir den Aufbau des Netzwerkes der Billigfluggesellschaft JetBlue. JetBlue ist das bislang einzi-ge wirklich relevante neu in den Markt eineinzi-getretene Unternehmen, das auch profitabel wirtschaftet. Innerhalb von zehn Jahren wuchs es zur neuntgr¨ oß-ten amerikanischen Fluglinie heran. JetBlue ist des Weiteren die einzige neu eingetretene Fluggesellschaft, die wir von ihrer Gr¨undung ¨uber fast ein Jahr-zehnt verfolgen konnten.
Unsere Ergebnisse zeigen, dass JetBlue durchweg konzentrierte Flugh¨ a-fen meidet aber insbesondere profitable Strecken mit geringer Wettbewerb-sintensit¨at als Gesch¨aftsfeld ausw¨ahlt. Des Weiteren beeinflussen Netzwerks-gesichtspunkte die Aufnahme neuer Strecken wesentlich: Je mehr Umsteige-verbindungen aufgrund einer neuen Direktstrecke angeboten werden k¨onnen, desto Wahrscheinlicher wird ein Markteintritt von JetBlue auf dieser Strecke. Bez¨uglich der Erschließung neuer M¨arkte favorisiert JetBlue dichte M¨arkte und Nebenflugh¨afen. Die Entscheidung auf existierenden Strecken in Kon-kurrenz zu anderen Fluggesellschaften zu treten trifft JetBlue insbesondere dann, wenn es sich um l¨angere Strecken handelt und auf dieser Strecke noch keine anderen Billigfluglinien ihre Dienste anbieten.
The Construction of a Low Cost
Airline Network
Facing competition and exploring new markets
Kathrin M¨
uller
aKai H¨
uschelrath
a,bVolodymyr Bilotkach
cJuly 2011
The paper investigates the construction of a low cost airline network by analyzing JetBlue Airways’ entry decisions into non-stop domestic U.S. airport-pair markets between 2000 and 2009. Adopting duration models with time-varying covariates, we find that JetBlue consistently avoided concentrated airports and tar-geted concentrated routes; network economies also affected entry positively. For non-stop entry into a route that has not been served on a non-stop basis before, our analysis reveals that the carrier focused on thicker routes and secondary airports, thereby avoiding direct confrontation with network carriers. Non-stop en-try into existing non-stop markets, however, shows that JetBlue concentrated on longer-haul markets and avoided routes already operated by either other low cost carriers or network carriers un-der bankruptcy protection.
Keywords Airline industry, network, entry, low cost carrier JEL Classification: L11, L23, L93
aZEW Centre for European Economic Research, L7 1, 68161 Mannheim, Germany. We
would like to thank Jan Brueckner, Tim Hazledine, John Kwoka, Lars Persson, Nicolas de Roos and Miguel Urdanoz for valuable comments on previous versions of the paper. The usual disclaimer applies.
bWHU Otto Beisheim School of Management, Burgplatz 2, 56179 Vallendar, Germany. cUniversity of California, Irvine, 3151 Social Science Plaza, Irvine, CA 92697, USA.
1. Introduction
In a number of industries, the success and sustainability of a new firm’s busi-ness strategy is tied to its sequential decisions to enter multiple markets. Prominent examples include fast food restaurants, supermarkets, banking and transportation services. In all these industries, firms face the key challenge to optimize the sequence of entries in a number of different markets -taking into account possible internal resource constraints and external bar-riers to entry - in order to operate profitably and to build-up a sustainable market presence. In designing such a sustainable entry pattern, a new en-trant typically has to decide on the optimal mixture of two distinct entry strategies: entering existing markets and facing competition of incumbent firms and entering new markets which can be expected to contribute to the overall profitability and success of the company.
The domestic U.S. airline industry provides a suitable environment for an empirical assessment of the determinants of successful entry in general and the importance of facing competition in existing markets and exploring new markets in particular. On the one hand, this industry has experienced a pronounced consolidation trend in the last decade, especially reflected in five high-profile mergers1 and the demise of several smaller players such as ATA,
National and Aloha, along with a short-lived failed entry by Skybus. On the other hand, despite this general consolidation trend, the domestic U.S. airline industry witnessed one significant countervailing force: the market entry and growth of JetBlue Airways.2 Since its first market appearance in February
2000 until the end of 2009, the low cost airline managed to build up a route network with 60 destinations in 21 U.S. states and transported about 20 million domestic passengers (in 2009) making it the 9th largest airline in the United States. Furthermore, despite its rapid growth, JetBlue Airways still managed to realize an overall net income of USD 201 million, and therefore belongs to the small group of profitable airlines.3
1The mergers are American Airlines-Trans World Airlines (2001), US Airways-America
West Airlines (2005), Delta Air Lines-Northwest Airlines (2009), United Airlines-Continental Airlines (2010), Southwest Airlines-AirTran Airways (2011).
2We believe that it is too early at the time of this writing to consider Virgin America
-the youngest player in -the domestic U.S. airline industry - as -the second successful new entrant. Since its market entry in 2008, the carrier only managed to turn profitable for the first time in the third quarter of 2010.
3Data source: Bureau of Transportation Statistics at
Although numerous examples of failed low cost carriers assert that a cost advantage is not a sufficient condition for market success, JetBlue Airways is different. One frequently cited distinctive characteristic is its innovative busi-ness strategy that diverges from other low cost carriers in several important dimensions. In addition to relying on secondary airports, JetBlue Airways developed hub operations at New York’s largest airport (JFK). Furthermore, the carrier offers high quality services including in-flight entertainment and pre-assigned leather seats, some featuring more legroom than what is found on traditional network carriers’ aircraft. It has also signed code-share agree-ments with international carriers such as Lufthansa, Aer Lingus or Icelandair. Last but not least, JetBlue Airways introduced long-haul services on a large scale and therefore brought ‘low cost’ competition to a type of routes formerly dominated by legacy network carriers.
Since the issue of sequential entry has been understudied in the empirical literature, we analyze the factors that have driven JetBlue’s entry decisions, from inception to the end of 2009. Our data analysis uses duration analysis regression models, which have not previously been applied to airline entry studies, but which are a popular tool in survival analysis literature. We find that JetBlue consistently avoided concentrated airports and targeted concen-trated routes; network economies also affected entry positively. For non-stop entry into a route that has not been served on a non-stop basis before, our analysis reveals that the carrier focused on thicker routes and secondary air-ports, thereby avoiding direct confrontation with network carriers. Non-stop entry into existing non-stop markets, however, shows that JetBlue concen-trated on longer-haul markets, avoided slot-restricted airports, and routes already operated by either other low cost carriers or network carriers under bankruptcy protection.
In addition to developing an understanding of the entry strategy of a suc-cessful low cost carrier, this study addresses the issue of the nature of entry barriers in the U.S. airline industry. Our findings point to airport dominance as a significant impediment to entry. We also find that the apparent entry deterrence effect of airport dominance is not limited to hubs or large airports. Furthermore, airport dominance deters entry into both markets where incum-bents are present and on new non-stop routes. This suggests that network carriers are able to use their airport dominance to prevent an entrant from establishing a network with a hub at a different airport. At the same time, JetBlue’s reliance on secondary airports, along with some evidence that the
airline avoided other low cost carriers, hints at the necessity for entrants into the airline industry to differentiate their product as much as possible.
The remainder of the paper is structured as follows. The second section provides a review of the literature on the determinants of entry into U.S. airline markets. The third section gives some background on the entry and growth of JetBlue Airways in the U.S. airline industry, followed by the pre-sentation of our empirical analysis in Section 4. Section 5 concludes the paper by summarizing the key results and deriving important conclusions for both business strategy and public policy.
2. The determinants of entry into U.S. airline
markets
An airline network is constructed by multiple market entry decisions. In determining these decisions, the airline management generally has to assess both the external attractiveness of the candidate markets - determined by potential customers, suppliers, competitors and partners - and the internal capabilities and resources of the company that determine its ability to com-pete in the respective candidate markets (see, e.g., Spulber, 2009, pp.433ff.). Although admittedly a simplification, this section condenses down market en-try decisions to answers of the following two questions: ’Is enen-try profitable?’ and ’Is entry possible?’
With respect to the profitability question, it can be expected that cur-rent and expected profitability of a particular market typically is a key de-terminant in the decision to enter the market. In general, it is reasonable to assume that a profit-maximizing, risk-neutral firm will enter a market if the net present value of expected post-entry profits is greater than the sunk costs of entry. As post-entry profits depend on post-entry competition, the entry decision therefore is connected to the entrant’s expectations about the conduct and performance of the firms after entry. Furthermore, the level of sunk costs incurred is a critical determinant of the entry decision (see e.g. Besanko et al., 1996, 396 ff.). The higher the necessary sunk costs to enter an industry; the higher is the risk of entry, and the lower the expected prof-its. Additionally, the entry condition above clarifies that profits immediately after entry are not necessary for a rational entry decision. It is sufficient that, for instance, market growth expectations promise ample profits in the
future. With respect to airline markets, this condition means that an entry decision must not be guided by the isolated profit expectations on the route actually entered, but typically has to take account of the revenue and profit contribution of the respective passengers over the entire network of the re-spective airline. Concerning entry sequence, routes which are expected to be most profitable should be entered first.
Although the expected profitability certainly is a key determinant of en-try, empirical studies have regularly found evidence that abnormal profits are not competed away by entry but remain persistent for longer time periods (see Geroski (1995) for a general analysis; Joskow et al. (1994) for the U.S. airline industry). This finding suggests that an entrant also has to address the issue of the possible extent of entry into a particular market and implies that a positive net present value (which at least outweighs sunk costs) is a necessary but not sufficient condition for entry, as barriers to entry can reduce or even eliminate entry incentives. For the U.S. airline industry, commen-tators leave no doubt that several potentially significant (structural and/or strategic) barriers to entry have developed after deregulation. For example, in a report on ‘Aviation Competition - Challenges in Enhancing Competition in Dominated Markets’, the US General Accounting Office (2001) identified the following operating and marketing barriers, which might constrain new entry into airline markets: access to airport facilities 4, such as gates, ticket
counters, baggage handling and storage as well as take-off and landing slots; frequent flyer programs; corporate incentive agreements; travel agent com-mission overrides; flight frequency; and network size and breadth.
Given this general reasoning on the determinants of entry into airline markets, the existing empirical research can broadly be separated into two different strands. The first group of papers focuses on the estimation of struc-tural models of entry decisions and consists of contributions by Bresnahan and Reiss (1990, 1991), Reiss and Spiller (1989), Berry (1992), Dunn (2008), and Ciliberto and Tamer (2009). Reiss and Spiller (1989) incorporate both entry and price competition in a structural model, and investigate competi-tion between differentiated direct and indirect services. They find that the indirect services are significantly more competitive if a direct competitor is also in the market. Dunn’s (2008) study investigates the decision of an airline to offer high-quality non-stop service between cities, depending on whether 4Scarcity of airport facilities (gates) in connection with control of gates have also been
or not the carrier also offers a lower quality one-stop service. Dunn finds that competition with rival one-stop service is an important determinant of non-stop entry (complementary to direct competition between non-stop entrants). The presence of a rival offering one-stop service in the market reduces the probability of entry suggesting that there is competition between one-stop and non-stop entry. Furthermore, Berry (1992) estimates a model of airline entry with heterogeneous firms and finds that an airline’s market share on routes departing from a particular airport is an important deter-minant of entry into other routes from that airport. Ciliberto and Tamer (2009) build on Berry’s contribution but relax the assumption that entry af-fects the profitability of competing airlines symmetrically. They are able to show significant heterogeneity in competition between airlines.
The second group of empirical papers follow a reduced form approach. These studies estimate the likelihood of entry as a function of firm and mar-ket characteristics. Starting with the contribution of Sinclair (1995) who focuses on the importance of hub-and-spoke networks for route entry and exit decisions, Boguslaski et al. (2004) estimate a model of city-pair entry for Southwest Airlines using data from 1990 to 2000. In addition to a quantifi-cation of the market characteristics which have influenced Southwest’s entry decisions (such as especially high passenger density, short travel distances, low income areas, prior airport presence and high route concentration), the authors find evidence that Southwest’s entry strategies have changed signif-icantly throughout the decade. Furthermore, Morrison and Winston (1990) estimate probit entry models for several U.S. carriers before and after dereg-ulation. They conclude that the airlines’ activity at origin and destination airports is an important entry determinant. Finally, the study by Leder-man and Januszewski (2003) estimates a reduced form model of entry into airport-pair markets. The authors assume that an airline starts operating a route as soon as the incremental profits - which depend on demand, cost and expected competitive characteristics of the route - from serving that route are positive. The model then explains entry as a function of the respective airline’s own characteristics and the characteristics of all actual and potential competitors on the route. The probit estimations with a dataset for the U.S. domestic airline industry between 1996 and 2000 provide some evidence con-sistent with the hypothesis that low cost carriers may aim at expanding the variety of products in order to soften competition. Interestingly, Lederman and Januszewski (2003) conclude that in order to be successful, low cost
carriers must either offer a differentiated product (i.e., enter new markets in the terminology of this paper), or alternatively provide products similar to existing ones but at lower prices (i.e., entry into existing markets in the terminology of this paper).
In a nutshell, the review of the existing literature has shown that probit models are often used to describe airline market entry. These models, how-ever, do not take adequate account of the timing of entry decisions in general and do not study these decisions from the inception of a new entrant in par-ticular. Applying an econometric technique, which allows taking account of the timing of entry (of a successful new entrant) is the distinguishing feature of this study. Although duration analysis models have not been applied to the airline industry, the model type has been used to study determinants of both firm entry (e.g. Haveman and Nonnemaker, 2000; Fuentelsaz et al., 2002; Fuentelsaz and G´omez, 2006) and exit (e.g. Audretsch and Mahmood, 1995; Disney et al., 2003; Mata and Portugal, 1994; Shane and Foo, 1999) in a variety of industries.
3. Entry and growth of JetBlue Airways
Given the review of existing studies on the determinants of entry, this section narrows the view down to the entry and growth of one particular airline: Jet-Blue Airways. The unique position of JetJet-Blue Airways as the only significant and successful entrant in the domestic U.S. airline industry in the last two decades justifies such a detailed investigation of its determinants. Before we present our econometric approach in Section 4 - which concentrates solely on the role of network construction in explaining the success of JetBlue Airways - this section aims at providing some general background information on the entry and growth of JetBlue Airways. In particular, after a brief general characterization in Section 3.1, the subsequent Section 3.2 focuses on the presentation and discussion of descriptive evidence on the entry pattern of this carrier.
3.1. A brief characterization of JetBlue Airways
JetBlue Airways was founded by David Neeleman in February 1999. Neele-man as well as several other JetBlue key executives were former Southwest
employees. In September 1999, JetBlue was awarded 75 take-off and landing slots at New York’s JFK airport, followed by the granting of formal U.S. au-thorisation in February 2000. JetBlue started operations on 11 February 2000 with services from New York JFK to Buffalo and Fort Lauderdale, rapidly extending its route network in the following years. As of December 2009, the carrier’s network included 60 destinations in 21 U.S. states, complemented by destinations in eleven countries in the Caribbean and Latin America. Jet-Blue operates a base at New York’s JFK airport, and has developed focus city5 operations in Boston, Orlando, Fort Lauderdale, Long Beach, and San
Juan (Puerto Rico). In 2004, JetBlue transported about 11.6 million pas-sengers on U.S. domestic flights. This number increased to about 20 million passengers in 2009 - a share of about 3 percent of all domestic passengers - making JetBlue the 9th largest airline in the United States.6 Despite the
rapid growth of JetBlue in partly difficult periods for the U.S. economy, the airline realized an overall net income of $201 million from inception until the end of 2009 (after subtracting the net losses experienced in four of the ten business years7).
Although JetBlue is usually classified as low cost carrier, its business strategy has several specific characteristics. First, the airline provides high quality service in several important service dimensions, such as in-flight enter-tainment and pre-assigned leather seats with more legroom. Second, JetBlue does not only concentrate - like most other low cost carriers - on short- and medium-haul markets but also entered long-haul markets typically only of-fered by the network carriers. Third, JetBlue has recently started entering into alliance agreements with foreign and domestic network carriers such as Lufthansa8, Aer Lingus and Icelandair (code-share agreements) or American
Airlines (interline agreement). JetBlue is considered a likely future mem-ber of one of the three global airlines alliances: Star Alliance, SkyTeam and oneworld.9
5A focus city is typically defined as a location that is not a hub, but from which the
airline has non-stop flights to several destinations other than its hubs.
6Data source: Bureau of Transportation Statistics at
http://www.transtats.bts.gov/carriers.asp (accessed on 22 May 2011).
7The net losses were realised in 2000 (USD 21 million), 2005 (USD 20 million),
2006 (USD 1 million) and 2008 (USD 76 million). For the raw data, see http://www.transtats.bts.gov/ (accessed on 22 May 2011).
8See http://www.jetblue.com/about/ourcompany/lufthansa/ for a detailed
characterisa-tion of the agreement with Lufthansa (accessed on 22 May 2011).
9Since Lufthansa acquired a 19 percent stake in JetBlue in December 2007, Star Alliance
Despite its rather unconventional business strategy, a quick look at the cost side of JetBlue reveals that it actually is a ‘low cost’ airline. While the network carriers show average costs of 10.96 cents per available seat mile (excluding fuel) in 2009, the average value for the low cost carrier group drops to 7.06 cents. In 2009, JetBlue averaged 6.62 cents per available seat mile, which is clearly below even the average cost level in the group of low cost carriers.10 Complementary to the low cost-low fare approach, JetBlue
offers a high quality product as confirmed, e.g., by the Airline Quality Rating (AQR) Scores11, which always show a top rank for JetBlue Airways in both
the entire group of major airlines, and the sub-group of low cost airlines since its first appearance in the rating in 2003.
3.2. Patterns of entry by JetBlue Airways
Given the brief general characterization of JetBlue Airways as a rather atyp-ical low cost carrier, this section narrows the focus down to the patterns of entry by JetBlue Airways. As a starting point for such a discussion, Figure 1 provides an overview of the entry activities of JetBlue Airways between 2000 and 2009. 0 5 10 15 20 25 30 35 2000 2001 2002 2003 2004 2005 2006 2007 2008 2009 Number of entries
Entries into existing markets Entries into new markets (a) Entries by type of market
0 5 10 15 20 25 30 35 2000 2001 2002 2003 2004 2005 2006 2007 2008 2009 Number of entries
≤ 750 miles 751-1500 miles > 1500 miles
(b) Entries by haul
Figure 1: Entry activity of JetBlue Airways (2000-2009)
Source: U.S. DOT, T-100 Domestic Segment Data, authors’ calculations
Panel (a) of Figure 1 plots the number of non-stop market entries by Jet-Blue Airways between 2000 and 2009. In addition to the respective overall numbers, the panel also provides a differentiation between entries in existing
10Data source: US DOT Form 41 via BTS, Schedule T2 & P6 & P52.
11The AQR is a common method of comparing airline quality on combined multiple
per-formance criteria. AQR scores for the calendar year are based on 15 elements in four major categories of airline performance: On-time performance (OT), denied boardings (DB), mishandled baggage (MB) and customer complaints (CC). The AQR is derived by Wichita State University (now in cooperation with Purdue University).
markets (i.e., markets which were already served directly by another airline when JetBlue Airways entered) and entries in new markets (i.e., markets which have not been served directly by another airline in the year prior to the entry of JetBlue Airways). As shown in the panel, overall entry activ-ity by JetBlue Airways has been substantial. Between 2000 and 2009, the airline entered 131 domestic markets12 with a clear peak in 2006, where 31
new routes were introduced. As revealed further by the panel, entry into new markets played a significant role in the business strategy of JetBlue Air-ways. On average, about 40 percent of all entries created new routes, with 14 percent in 2005 and 83 percent in 2002 delineating the spectrum. Despite the significance of entry into new markets, in 2009, only 30 percent of the 20 million JetBlue Airways passengers traveled in new markets while the re-maining 70 percent flew in existing markets. Furthermore, JetBlue’s entry decisions have apparently been successful in the sense that the airline only left 23 routes out of the 131 routes it entered between 2000 and 2009. Of the 23 exits, 13 occurred in 2008, most probably in response to reduced demand due to economic recession.
Panel (b) of Figure 1 breaks down entries by length of haul. As shown in the panel, entry activity has been substantial in all three categories. In sum, over the entire sample period, 42 entries (about 32 percent) took place in long-haul markets above 1500 miles while 53 entries (about 40 percent) were observed in medium-haul markets (751-1500 miles). The remaining 36 entries (about 28 percent) took place in short-haul markets up to 750 miles. As further shown in panel (b), there is significant variation in the entry activity of JetBlue Airways. While long-haul routes is the only category that shows entry activity in every year since the birth of JetBlue Airways, short-haul and medium-short-haul markets show higher absolute peaks (in 2006 and 2008 with 15 entries each).
Additionally, descriptive data analysis reveals that the share of long-haul passengers for JetBlue Airways is significantly larger than for Southwest. Al-though JetBlue’s entry waves in short-haul markets in 2006 and medium-haul markets in 2008 inevitably led to a drop in the share of long-haul passengers from its peak of 36 percent in 2005 to 23 percent in 2009, its share is still substantially larger than in case of Southwest (8 percent). Although future
12Non-stop services to unincorporated territories, such as Puerto Rico, are not counted
as domestic entries. Between 2000 and 2009, JetBlue started 11 non-stop services to destinations in Puerto Rico.
growth of JetBlue Airways will likely lead to a further convergence - basi-cally because the number of (potentially profitable) long-haul market entries is limited - the focus of JetBlue Airways on long-haul routes in its first years of existence is clearly reflected in the descriptive data analysis.13
4. Empirical Analysis
Given the review of existing evidence on the determinants of entry into air-line markets and the identification of JetBlue Airways as a successful and innovative new entrant, this section aims at investigating the determinants of entry by JetBlue Airways in a rigorous econometric framework. Section 4.1 concentrates on hypothesis development, while Section 4.2 presents the regression models and Section 4.3 describes the data set. Section 4.4 is de-voted to the presentation of the empirical results separated between entries into new markets and entries into existing markets.
4.1. Hypothesis development
We have identified three main categories of determinants of entry: route characteristics, airport characteristics, and demographic characteristics. In the following, we provide motivations for the respective variables in the three categories.
Route characteristics
Six different route-specific variables enter our empirical analysis: Distance, number of passengers, route HHI, LCC competition and Chapter 11. First, with respect to the distance variable, it was suggested by the descriptive anal-ysis above that although LCCs traditionally focused on short- and medium-haul markets, JetBlue’s business strategy has a focus on long-medium-haul routes. We therefore expect that entry becomes more likely with route distance. Second, route density was identified as a key determinant of LCC entry in previous studies such as Ito and Lee (2003), basically because the revenue and profit opportunities are expected to be larger. We therefore expect that the likeli-hood of entry increases with the number of passengers traveling in a certain 13These figures exclude JetBlue Airways’ (mostly long-haul) routes to Puerto Rico and
market. Third, a high route HHI suggests, other things equal, that competi-tion on the respective route is less intensive and the respective market players might enjoy market power leading to higher fares and supracompetitive prof-its (see, e.g., Morrison and Winston, 1990). Since the most profitable routes should be entered first, the higher a route’s HHI the earlier JetBlue’s entry should occur. Fourth, the route presence of another low cost carrier can be expected to reduce the profitability of entry as the respective carrier already serves a substantial fraction of the entire low cost carrier demand potential. We therefore expect that the existence of other low cost carriers on a route hamper entry by JetBlue. Fifth, carriers flying under Chapter 11 bankruptcy protection are often able to take advantage of this status to negotiate hard-to-cut costs with employees, suppliers, and contractors and may therefore be able to reduce fares. Furthermore, as shown by Busse (2002), airlines under financial strain are more likely to initiate price wars. Ceteris paribus, we therefore expect a reduced profitability of entry into routes which are also served by airlines under Chapter 11 bankruptcy protection suggesting a neg-ative relationship with entry activity on these routes. Sixth, although LCCs typically focus on point-to-point traffic, it was identified above that JetBlue focuses their operations on a hub and several focus cities. Exploiting network economies might therefore be of major relevance for JetBlue Airways. Ceteris paribus and given the results of previous research on airport dominance by Borenstein (1989), we expect that network economies, as measured by the number of potential new one-stop connections, make entry more attractive in order to construct a sound network.
Airport characteristics
Four different airport-specific variables enter our empirical analysis: sec-ondary airport, slot-restricted airport, airport HHI and passenger facility charge (PFC). First, with respect to the secondary airport variable, it is a well-documented observation that LCCs often use secondary airports as they have lower charges, allow for shorter turnover times and increase the likeli-hood of providing on-time flights (see, e.g., Ito and Lee, 2003). We expect that JetBlue prefers entry on routes involving a secondary airport. Second, LCCs tend to avoid slot-restricted airports as they are expensive to use, have longer turnover times and increase the likelihood of delays. We expect entry for routes that involve a slot-restricted airport is less likely. Third, LCCs tend to avoid highly concentrated airports as the dominance of another carrier
con-strains growth potential, might increase airport-specific operating costs and contains the risk of aggressive responses by the incumbent carrier (see, e.g., Hofer et al., 2008; Lin et al., 2002). We expect that the probability of entry decreases for routes that involve a highly concentrated airport. Fourth, the higher the PFC, the less lucrative is market entry other things equal. We expect that entry occurs less often on routes that involve an airport with high PFCs.
Demographic characteristics
Three different demographic variables enter our empirical analysis: popula-tion, average weekly wage and unemployment rate. These variables are mea-sured at the corresponding Metropolitan Statistical Area (MSA) level, and obtained from the U.S. Census Bureau and the Bureau of Labour Statistics. In regressions, we will use mean values for origin and destination airport’s MSAs as independent variables. The expected relationships between these variables and the hazard rate of entry are intuitive. Specifically, we expect higher population and higher weekly wage to be associated with a higher probability of entry, other things equal, as both these variables are measures of market size. Higher unemployment rate will be associated with a lower entry probability, due to lower expected demand.
4.2. The regression models
Analysis of network construction involves studying not only which routes the airline decides to serve with non-stop flights, but also at what point in time the entries take place. Investigating the timing of entry distinguishes our approach from previous studies on the determinants of market entry by low cost carriers (e.g. Boguslaski et al., 2004; Oliveira, 2008). A convenient set of models which make it possible to account for the sequence of entry are duration models commonly used in survival analysis, but also suitable for entry analysis (see e.g. Haveman and Nonnemaker, 2000). These models explain either the hazard rate λ(t)of entry (hazard rate metric) or the time
until entry takes place (accelerated failure-time metric). In the case of the hazard rate metric, the hazard rate can be understood as the probability of starting to serve a route directly within a short interval of time, conditional on not having entered that route up to the starting time of the interval (see
Wooldridge, 2002). Formally, the hazard rate for market i at timet is given by λi(t) = lim h→0+ P[t≤Ti<t+h∣t≤Ti] h ,
whereTi denotes the duration between the foundation of JetBlue in the fourth
quarter of 1999, and the quarter when the carrier entered market i.
To estimate the effect of certain time-constantxi and time-varying
covari-ates zit on the hazard rate, we use a proportional hazard model, expressed
by λi(t∣xi,zit) =λ0(t)exp(x ′ iβx+z ′ itβz).
As the baseline hazard λ0(t)14 is time-dependent, but not influenced by
the covariates, each market has the same baseline hazard of entry. Therefore, comparing market i to market m, we obtain
λ(t∣xi,zit) λ(t∣xi,zmt) = exp(x ′ iβx+z ′ itβz) exp(x′mβx+z ′ mtβz) ,
which is called hazard ratio.
From the hazard rate expression it is easy to see that for a binary covariate
xk shifting from zero to one, the hazard ratio is
λ(t∣xi,zit, xk=1) λ(t∣xi,zit, xk=0) = exp(x ′ iβx+z ′ itβz+1⋅βk) exp(x ′ iβx+z ′ itβz) =exp(βk),
which gives the coefficients an easy interpretation. For a binary covariate
xk shifting from zero to one, the hazard increases by exp(βk) −1. The same
interpretation applies for a discrete change of a covariate by one unit. As a semi-parametric estimation method proposed by Cox (1972) imposes no restrictions on the shape of the baseline hazard and therefore allows the baseline hazard to be as flexible as possible, Cox regression is used for the analysis.
Unfortunately, hazard rates are not easily conceivable and less concrete than a corresponding time measure. With Cox regression, predicting actual failure times is not possible. In order to be able to give an estimate on how 14The baseline hazard is the hazard rate of observations with zero covariates. The
the covariates of interest influence the mean time to entry, we also apply a parametric, and thus more rigid, type of duration models. As Cleves et al. (2004) note, the use of the accelerated failure-time metric is justified if pre-dicting the effects on failure time is desired. Duration models in accelerated time metric are written as
ln(ti) =xiβx+ln(τi) τ ∼e.g. log-logistic
Exponentiated coefficients in accelerated failure-time models can be in-terpreted as time ratios for a change of a dummy variable from zero to one or a one-unit change in the corresponding covariate. In other words, if the covariate x1 increases by one unit, the predicted time of entry increases by
exp(β1) −1. Dependent on the distribution of τ we can distinguish between
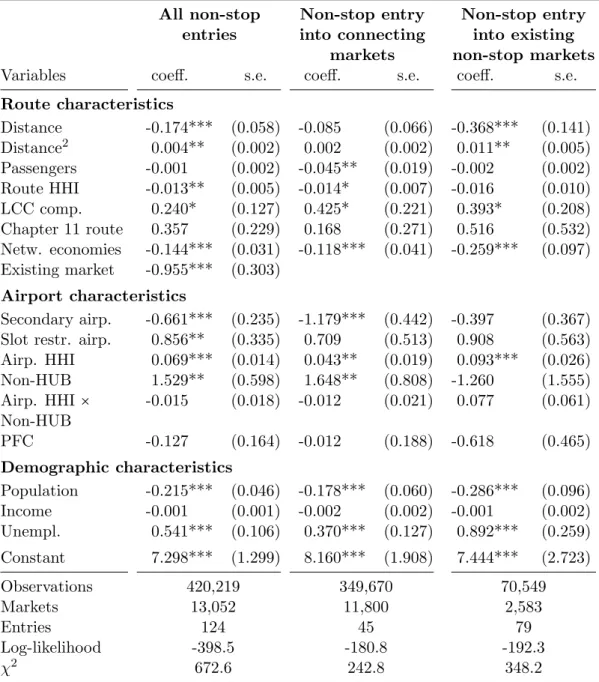
several parametric models: the exponential model, the Weibull regression, the Gompertz regression, the log-normal regression, and the log-logistic regres-sion. We choose among these five parametric models by comparing the values of the Akaike information criterion (AIC). According to AIC, the model with the lowest value of the AIC is preferred. In our case, it turns out that the data is best described when using either the log-logistic or the log-normal duration model. Results do not differ between these models and are pre-sented for the log-logistic model. For comparison, results for the log-normal duration model can be found in Table 5 in the Appendix.
4.3. Data and Descriptive Statistics
For our empirical analysis, we combined data from several sources. First, we use the U.S. Department of Transportation (U.S. DOT) DB1B Market Origin and Destination Survey to identify a sample of possible airport-pair routes JetBlue Airways might enter. All routes which are served at least via two stops qualify for potential non-stop entry. Second, we add infor-mation on population, average income, and unemployment of the respective Metropolitan Statistical Areas from the U.S. Census Bureau and the Bureau of Labour Statistics. In all our estimations, we restrict the sample to routes which connect the 200 largest Metropolitan Statistical Areas (MSA).
In our regressions, we aim to explain network development. In addition to an analysis of the entire sample, we especially investigate a split of the sample into non-stop entries which result in a new non-stop connection (entry
into new markets), and non-stop entries, which took place in markets which have been served directly by another carrier (entry into existing markets). For entry into new markets we identified all routes which areonly served via one- or two-stop connections.
We use traffic data from the U.S. DOT in order to identify non-stop market entry of JetBlue Airways and to construct some of our explanatory variables. More precisely, we use the T-100 Domestic Segment database for the period from 2000 to 2009. This data set contains monthly domestic non-stop segment data reported by U.S. airlines when both origin and des-tination airports are located within the boundaries of the United States and its territories. We used T-100’s information on origin, destination, available capacity, number of departures, and number of passengers for each of the major carriers15 to construct a quarterly panel data-set of non-directional
non-stop airport-pair markets. We dropped airline-route observations with fewer than 12 quarterly departures and airline-route observations which were only served for one quarter between 2000 and 2009. An entry event of Jet-Blue Airways is determined by the quarter when we first observe the airline providing non-stop scheduled services16. Furthermore, we were able to
con-struct some of the airport characteristics such as airport concentration, the number of routes JetBlue already serves from an airport, or the airport’s pas-senger share from T-100 data. Data on paspas-senger facility charges collected by airports was retrieved from the Federal Aviation Administration (FAA).
Non-stop entry is explained by route, airport, and corresponding demo-graphic characteristics. Distance is measured as the non-stop distance in 100 miles. Existing market demand is approximated by total number of passen-gers. As described in Section 4.1, we also account for market concentration (Route HHI), low cost carrier competition (LCC comp.), possible advan-tages of carriers operating under Chapter 11 protection (Chapter 11 route) and possibilities of exploiting network economies (Netw. economies). With regard to airport characteristics, we include a dummy variable to indicate
15The T-100 data set also includes traffic data for regional carriers who support the major
airlines. Although most of these typically small carriers are legally independent, their economic existence is often tied to a large network carrier. For example, in many instances, regional carriers do not issue their own tickets but refer to the network carrier for all flight bookings. For our analysis, regional carriers are merged to the respective major carrier for which they operate on a specific route.
16We cross-checked this methodology with information on route entries provided from
JetBlue at http://www.jetblue.com/about/ourcompany/history.asp and it turned out that all entries were correctly identified.
that at least one end point is a secondary airport (Secondary airp.); another variable indicates whether either of the endpoints is a slot-restricted airport (Slot restr. airp.); and we include a variable that indicates whether either of the endpoints is not a major hub (Non-HUB)17. Furthermore, we include
the mean level of passenger facility charges (PFC), and mean concentration (Airp. HHI) at the respective airports. To capture demographic character-istics, the number of inhabitants (Population), average income (Income)18,
and the unemployment rate (Unempl.) are included.
Given this detailed overview of the data, Table 1 provides summary statis-tics of the variables included, while Table 4 in the Appendix summarizes the description of the variables, both for the entire sample, and for the two sub-samples discussed above.
Table 1: Summary statistics
All markets One- or
two-stop markets
Existing non-stop markets
Variable Mean Std. D. Mean Std. D. Mean Std. D.
Route characteristics Distance 11.094 7.558 11.632 7.724 8.432 6.005 Passengers 8.763 28.352 2.143 3.962 41.573 58.450 Route HHI 55.581 24.712 54.691 25.116 59.990 22.084 Chapter 11 route 0.326 0.469 0.372 0.483 0.101 0.301 LCC comp. 0.310 0.614 0.222 0.513 0.746 0.845 Netw. economies 1.259 3.880 1.135 3.779 1.876 4.290 Existing market 0.167 0.373 0.000 0.000 1.000 0.000 Airport characteristics Secondary airp. 0.201 0.401 0.200 0.400 0.205 0.404
Slot restr. airp. 0.069 0.254 0.049 0.216 0.169 0.375
Airp. HHI 37.258 14.730 37.334 14.979 36.878 13.425 Non-HUB 0.781 0.414 0.872 0.334 0.330 0.470 PFC 2.649 0.756 2.632 0.758 2.731 0.742 Demographic characteristics Population 2.382 2.621 2.089 2.478 3.832 2.820 Income 576.107 75.723 565.377 71.114 629.290 75.424 Unempl. 5.270 1.585 5.264 1.584 5.299 1.585 Observations 420,219 349,670 70,549
Source: U.S. DOT T100 Market Segment and DB1B Origin and Destination Survey, U.S. Census Bureau, Bureau of Labor Statistics, authors’ calculations.
17A route is classified to be between non-HUBs if one of the airport’s passenger share is
below 0.25 percent.
4.4. Empirical Results
Our estimation results are presented in Table 2 for the Cox proportional hazard model and in Table 3 for the log-logistic duration model. We first report results for the entire sample; then we break the sample into cases of entry into new markets and entry into existing markets. The distinction between the two types of markets is simple: new markets correspond to airport pairs that had no non-stop service before entry of JetBlue (such as New York JFK - Long Beach route); whereas existing routes are markets where other airlines were present before JetBlue entered (such as New York JFK-Los Angeles (LAX) route). Out of the 124 entries covered by our data analysis, 45 were new entries, and 79 are classified as entries into existing routes.
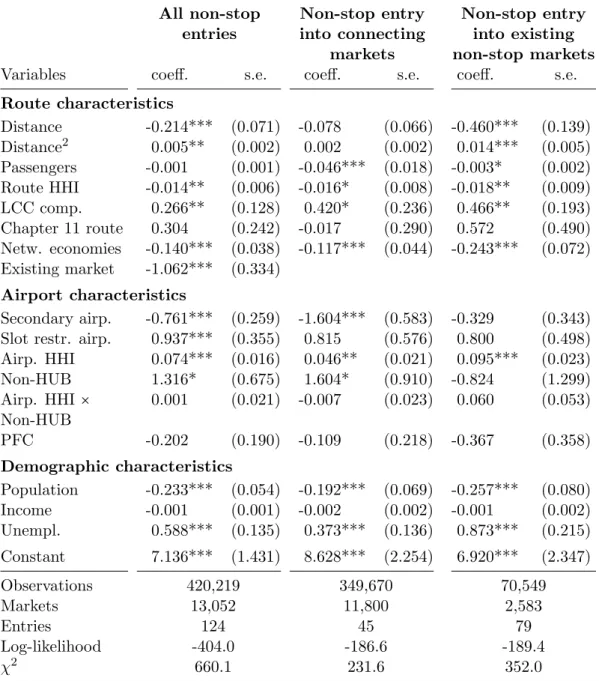
As reported in Table 3, the following four factors appear in all three regressions as robust predictors of JetBlue’s entry decisions. First, JetBlue was more likely to enter more concentrated airport-pair routes. Holding other variables constant, the hazard rate of entry increases by about 1.7 percent if the route’s HHI, as measured on a 0-100 scale, increases by 1 unit. As can be retrieved from the log-logistic regression in Table 3, a one-unit increase in the route’s HHI corresponds to an decrease in mean time to entry of 1.4 percent. Thus, we find a large effect on the hazard of entry and its corresponding time to entry for a relative small increase in market concentration. However, this result is very intuitive - other things equal - as more concentrated markets are typically associated with higher profits, which invite entrants. Second, the carrier shied away from concentrated airports. Comparing the magnitudes of the two coefficients, we see that airport concentration appears as a strong entry deterrent. For instance, comparing the effect of a decrease in airport concentration19 with that of an otherwise equal increase in route
concentra-tion20, we see that the former is considerably more likely to attract entry by
JetBlue than the latter. The same result applies in the accelerated failure-time metric. While an one point increase in route HHI decreases the mean time to entry by 1.4 percent, a one point increase in each of the respective airport’s HHIs increases the mean time to entry by 7.7 percent.
19A one point decrease in the mean airport HHI, i.e. a one point increase at each of the
two airports, increases the hazard of entry by 9.2 percent.
Table 2: Cox Regressions on non-stop entry All non-stop entries Non-stop entry into connecting markets Non-stop entry into existing non-stop markets
Variables coeff. s.e. coeff. s.e. coeff. s.e.
Route characteristics Distance 0.276*** (0.064) 0.089 (0.088) 0.407*** (0.083) Distance2 -0.008*** (0.002) -0.003 (0.003) -0.011*** (0.003) Passengers -0.000 (0.001) 0.056*** (0.017) 0.000 (0.002) Route HHI 0.017*** (0.005) 0.018** (0.009) 0.018*** (0.007) LCC comp. -0.180 (0.136) -0.304 (0.277) -0.366** (0.172) Chapter 11 route -0.621** (0.282) -0.426 (0.485) -0.874** (0.424) Netw. economies 0.108*** (0.010) 0.114*** (0.018) 0.106*** (0.013) Existing market 1.086*** (0.310) Airport characteristics Secondary airp. 0.559** (0.225) 1.406*** (0.421) 0.160 (0.294)
Slot restr. airp. -0.963*** (0.328) -0.743 (0.594) -0.916** (0.409)
Airp. HHI -0.097*** (0.013) -0.057*** (0.021) -0.118*** (0.016) Non-HUB -1.318* (0.708) -1.414 (0.952) 1.435 (1.323) Airp. HHI× Non-HUB 0.009 (0.023) 0.006 (0.027) -0.083 (0.059) PFC 0.148 (0.174) 0.030 (0.241) 0.348 (0.273) Demographic characteristics Population 0.190*** (0.038) 0.167*** (0.061) 0.186*** (0.052) Income 0.004*** (0.001) 0.004 (0.002) 0.004** (0.002) Unempl. -0.358** (0.169) -0.238 (0.271) -0.513** (0.234) Observations 420,219 349,670 70,549 Markets 13,052 11,800 2,583 Entries 124 45 79 Log-likelihood -845.2 -302.8 -440.3 χ2 599.6 208.0 302.6
Notes: *** p<0.01, ** p<0.05, * p<0.1, standard errors in parentheses. Interval censoring is accounted for using the Efron approximation.
Source: U.S. DOT T100 Market Segment Data, U.S. DOT DB1B Origin and Destination Survey, U.S. Census Bureau, Bureau of Labor Statistics, authors’ calculations.
Table 3: Log-logistic Regressions on non-stop entry (accelerated failure-time metric) All non-stop entries Non-stop entry into connecting markets Non-stop entry into existing non-stop markets
Variables coeff. s.e. coeff. s.e. coeff. s.e.
Route characteristics Distance -0.214*** (0.071) -0.078 (0.066) -0.460*** (0.139) Distance2 0.005** (0.002) 0.002 (0.002) 0.014*** (0.005) Passengers -0.001 (0.001) -0.046*** (0.018) -0.003* (0.002) Route HHI -0.014** (0.006) -0.016* (0.008) -0.018** (0.009) LCC comp. 0.266** (0.128) 0.420* (0.236) 0.466** (0.193) Chapter 11 route 0.304 (0.242) -0.017 (0.290) 0.572 (0.490) Netw. economies -0.140*** (0.038) -0.117*** (0.044) -0.243*** (0.072) Existing market -1.062*** (0.334) Airport characteristics Secondary airp. -0.761*** (0.259) -1.604*** (0.583) -0.329 (0.343)
Slot restr. airp. 0.937*** (0.355) 0.815 (0.576) 0.800 (0.498)
Airp. HHI 0.074*** (0.016) 0.046** (0.021) 0.095*** (0.023) Non-HUB 1.316* (0.675) 1.604* (0.910) -0.824 (1.299) Airp. HHI× Non-HUB 0.001 (0.021) -0.007 (0.023) 0.060 (0.053) PFC -0.202 (0.190) -0.109 (0.218) -0.367 (0.358) Demographic characteristics Population -0.233*** (0.054) -0.192*** (0.069) -0.257*** (0.080) Income -0.001 (0.001) -0.002 (0.002) -0.001 (0.002) Unempl. 0.588*** (0.135) 0.373*** (0.136) 0.873*** (0.215) Constant 7.136*** (1.431) 8.628*** (2.254) 6.920*** (2.347) Observations 420,219 349,670 70,549 Markets 13,052 11,800 2,583 Entries 124 45 79 Log-likelihood -404.0 -186.6 -189.4 χ2 660.1 231.6 352.0
Notes: *** p<0.01, ** p<0.05, * p<0.1, standard errors in parentheses.
Source: U.S. DOT T100 Market Segment Data, U.S. DOT DB1B Origin and Destination Survey, U.S. Census Bureau, Bureau of Labor Statistics, authors’ calculations.
This finding is in line with Hofer et al. (2008) who find that the largest components of price premiums are those from airport concentration, rather than route concentration. Third, JetBlue is apparently more likely to en-ter a route, if the carrier can sufficiently exploit network economies. If the number of new one-stop connections JetBlue can serve after a non-stop en-try between two airports increases by one, the hazard of enen-try increases by 11 percent (= exp(0.108) −1). In terms of time to entry, one new
poten-tial one-stop connection decreases the mean time to entry by 13 percent (= exp(−0.140) −1). This is also understandable as a significant sunk
in-vestment into airport facilities, marketing etc. is necessary to start off a new airport presence. Furthermore, this result can be interpreted as a clear indication that JetBlue rather wanted to construct a hub-and-spoke than a point-to-point network. Hub and focus city development eases (aircraft) scheduling and boosts the possibilities of JetBlue to offer connecting flights. Fourth, the effect of population on the likelihood of entry is also robust and significant in all specifications. An increase in one million inhabitants in each of the endpoint cities increases the hazard of entry by 21 percent and decreases time to entry by 21 percent.
With respect to the remaining variables, we observe the following effects. Distance exhibits a significant effect in the entire sample, and for entries into existing markets. Consistent with what is believed about JetBlue’s strategy, the carrier is more likely to enter longer-haul routes already served by its competitors. The effect of distance is decreasing, as evidenced by the negative coefficient on distance squared. The effect is mainly driven by entry into existing non-stop markets, since the effect is not statistically significant for entry into connecting markets. Number of passengers served on the market predicts entry into new routes, but not into existing markets. This result simply implies that JetBlue did its homework to identify markets with many connecting passengers (traveling with one or two stops en route), and without non-stop services. Presence of other low cost carrier(s) serves as an important deterrent for entry into existing markets. JetBlue also tried to avoid routes, served by the airlines under Chapter 11 bankruptcy protection. Although this result might appear counter-intuitive at first, our discussion above indicates that both Chapter 11-specific cost advantages and an increased likelihood of price wars can explain why JetBlue tended to avoid those markets. However, entry deterrence of Chapter 11 bankruptcy protection cannot be confirmed in the accelerated failure-time metric.
Interestingly, support for the commonly accepted wisdom that low cost carriers tend to choose secondary airports appears mixed. It is true that JetBlue is more likely to choose secondary gateways when entering new mar-kets; however, the corresponding coefficient is not significant for regression analyzing the carrier’s entry into existing routes. Part of this finding can be explained by the observation that JetBlue operates many of its (long-haul) flights from New York JFK and Boston Logan to mostly primary airports at the West Coast.
Coming back to the issue of airport concentration, the negative relation-ship between airport HHI and the likelihood of entry could have two expla-nations. First, we could interpret this result as implying that JetBlue tries avoiding hub airports, which tend to be concentrated. The second explana-tion relates to economies of scale: airports located in smaller metropolitan areas might only sustain limited services, and end up being monopolized by a single airline, feeding traffic from the airport to its hub. The airline oper-ating the nearest hub will then end up as a dominant carrier in such small gateways. To account for this possibility, we have included a non-hub air-port dummy, and interacted that dummy with the airair-port HHI. To identify non-hub airports, we have used the Federal Aviation Administration’s clas-sification: non-hub airports are defined as airports serving more than 10,000 but less than 0.25 percent of entire domestic passenger traffic annually. Our results provide very little support to the contention that the effect of airport concentration on entry is specific to airports of certain size.
Last but not least, our results show the expected effects of demographic variables on entry, even though the corresponding coefficients are not always significant. Interestingly, comparing the coefficients of our income variable with the respective results reported in the study of Boguslaski et al. (2004) reveals substantial differences. While Southwest is found to target on highly price elastic passengers in low income cities with favorable operational condi-tions, our analysis for JetBlue fails to find such an effect. This result therefore supports out earlier observation that the business strategies (and customer groups) of both carriers differ significantly.
With respect to the implications of our results for entry barriers in the airline industry, we can say the following. First, the fact that JetBlue fo-cused on secondary airports establishing new non-stop service indicates that it avoided direct confrontation with the network carriers. The other impor-tant finding is that JetBlue was more likely to enter routes if it was able to
exploit network economies by increasing the number of connection flights. Collectively, the two results imply that airport presence itself may be an im-portant entry barrier, consistent with Berry (1990) and Borenstein (1989). Not only airport presence itself, but also the extent of this presence is a defining factor, as clearly evidenced by the relationship between airport HHI and likelihood of entry. As for the route-level entry barriers; the identity of your competitors apparently matters a lot. We find some evidence that JetBlue avoided routes, where it would have to compete with the low cost and currently financially distressed carriers. This suggests that the carrier evaluated the likely post-entry competition when making entry decisions.
5. Conclusion
In the last decade, the domestic U.S. airline industry has experienced a sub-stantial consolidation trend. In addition to a number of high level mergers, several smaller carriers had to leave the industry. The only significant coun-tervailing force of this development has been the entry and growth of JetBlue Airways. Since its first market appearance in February 2000 until the end of 2009, the low cost airline managed to build up a route network with 60 destinations in 21 U.S. states and transported about 20 million passengers (in 2009) making it the 9th largest airline in the United States. Furthermore, despite its rapid growth, JetBlue Airways still managed to realize an overall net income of USD 201 million, and therefore belongs to the small group of profitable airlines.
Against this background, we analyze the factors that have driven Jet-Blue’s entry decisions, from inception to the end of 2009. Our data analysis uses Cox proportional regression models and, in order to provide a more intu-itive picture, parametric duration models in accelerated failure-time metric. These have not previously been applied to airline entry studies, but they are a popular tool in the survival analysis literature. We find that JetBlue consistently avoided concentrated airports and targeted concentrated routes; network economies also affected entry positively. For non-stop entry into a route that has not been served on a non-stop basis before, our analysis reveals that the carrier focused on thicker routes and secondary airports, thereby avoiding direct confrontation with network carriers. Non-stop entry into existing non-stop markets, however, shows that JetBlue concentrated on
longer-haul markets, avoided slot-restricted airports, and routes already op-erated by either other low cost carriers or network carriers under bankruptcy protection.
In addition to developing an understanding of the entry strategy of a suc-cessful low cost carrier, this study addresses the issue of the nature of entry barriers in the U.S. airline industry. Our findings point to airport dominance as a significant impediment to entry. We also find that the apparent entry deterrence effect of airport dominance is not limited to hubs or large airports. Furthermore, airport dominance deters entry into both markets where incum-bents are present and on new non-stop routes. This suggests that network carriers are able to use their airport dominance to prevent an entrant from establishing a network with a hub at a different airport. At the same time, JetBlue’s reliance on secondary airports, along with some evidence that the airline avoided other low cost carriers, hints at the necessity for entrants into the airline industry to differentiate their product as much as possible.
From a business strategy perspective, it can be concluded that successful entry into the U.S. airline industry is still possible as long as the respective entrant understands the key industry characteristics and growth needs and is able to position itself taking into account its relative strengths and weak-nesses. The case of JetBlue Airways has especially shown that significant structural and strategic entry barriers can be overcome by a combination of entry into existing and new markets driven by an innovative general business strategy. Although entry into existing markets may yield higher revenues, entry into new markets has the key advantage of avoiding the costs of com-peting against incumbents and is therefore likely to contribute substantially to the overall profitability and success of the company.
From a public policy perspective, it is very likely that consumers gain substantially from the existence and growth of JetBlue Airways through sig-nificant reductions in fares - first and foremost on the airport-pair actually entered but also on adjacent city-pairs or on routes which face an elevated probability of entry by JetBlue Airways. In order to keep and further extend these benefits, antitrust authorities are not only well advised to monitor the industry to identify potential forms of anticompetitive behavior by incumbent firms but they should especially be skeptical with respect to any initiative of network carriers to acquire or merge with JetBlue Airways. Given the effi-ciency and significance of JetBlue, it is very likely that loosing this ’maverick firm’ would cause substantial anticompetitive effects on many U.S. domestic
routes.
Although the paper investigates the entry strategy of one particular firm in one particular industry, our results generally suggest that the art of suc-cessful firm entry in industries with multiple markets includes both facing competition by incumbents and exploring new markets. Although new firms are well advised to differentiate their products in order to reduce competitive pressure, successful and sustainable entry often cannot avoid overcoming en-try barriers and competing with incumbents directly. Following the method-ology of Paul Geroski (1991, 1995), industries which demand multiple entries in different markets therefore are a nice example for the importance of both imitative entry into existing markets and innovative entry into new markets. Independent of an answer to the question which type of entry is more im-portant for the company or social welfare, consumers will surely profit from both increases in competitive pressure and spirit of innovation.
References
Audretsch, D. and T. Mahmood (1995): “Firm Survival: New Results
Using a Hazard Function,”Review of Economics and Statistics, 77, 97–103.
Berry, S. (1990): “Airport Presence as Product Differentiation,”American
Economic Review, Papers and Proceedings, 80, 394–399.
——— (1992): “Estimation of a Model of Entry in the Airline Industry,”
Econometrica, 60, 889–917.
Besanko, D., D. Dranove, and M. Shanley (1996): The Economics
of Strategy, New York: John Wiley & Sons.
Boguslaski, R., H. Ito, and D. Lee (2004): “Entry Patterns in the
Southwest Airlines Route System,”Review of Industrial Organization, 25, 317–350.
Borenstein, S. (1989): “Hubs and High Fares: Dominance and Market
Power in the US Airline Industry,”RAND Journal of Economics, 20, 344– 365.
Bresnahan, T. F. and P. C. Reiss(1990): “Entry in Monopoly Markets,”
——— (1991): “Entry and Competition in Concentrated Markets,”The Jour-nal of Political Economy, 99, 977–1009.
Busse, M. (2002): “Firm Financial Condition and Airline Price Wars,”
RAND Journal of Economics, 33, 298–318.
Ciliberto, F. and E. Tamer (2009): “Market Structure and Multiple
Equilibria in Airline Markets,”Econometrica, 77, 1791–1828.
Ciliberto, F. and J. Williams (2010): “Limited Access to Airport
Fa-cilities and Market Power in the Airline Industry,” Journal of Law and Economics, 53, 467–495.
Cleves, M., W. Gould, and R. Gutierrez (2004): An Introduction to
Survival Analysis Using Stata, College Station, Texas: Stata Press.
Cox, D. (1972): “Regression Models and Life Tables,”Journal of the Royal
Statistical Society, 34, 187–220.
Disney, R., J. Haskel, and Y. Heden (2003): “Entry, Exit and
Estab-lishment Survival in UK Manufacturing,”Journal of Industrial Economics, 51, 91–112.
Dunn, A.(2008): “Do low-quality products affect high-quality entry?
Multi-product firms and nonstop entry in airline markets,”International Journal of Industrial Organization, 26, 1074–1089.
Fuentelsaz, L. and J. G´omez (2006): “Multipoint Competition,
Strate-gic Similarity and Entry Into Geographic Markets,”Strategic Management Journal, 27, 477–499.
Fuentelsaz, L., J. G´omez, and Y. Polo (2002): “Followers’ Entry
Timing: Evidence From the Spanish Banking Sector After Deregulation,”
Strategic Management Journal, 23, 245–264.
Geroski, P. (1995): “What Do We Know about Entry?” International
Journal of Industrial Organization, 13, 421–440.
Geroski, P. A.(1991): Market Dynamics and Entry, Oxford: Oxford
Uni-versity Press.
Haveman, H. and L. Nonnemaker (2000): “Competition in Multiple
Geographic Markets: The Impact on Growth and Market Entry,” Admin-istrative Science Quarterly, 45, 232–267.
Hofer, C., R. Windle, and M. Dresner (2008): “Price Premiums and
Low Cost Carrier Competition,”Transportation Research Part E, 44, 864– 882.
Ito, H. and D. Lee (2003): “Low Cost Carrier Growth in the US Airline
Industry: Past, Present and Future,” Working paper, Cambridge.
Joskow, A., G. Werden, and R. Johnson (1994): “Entry, Exit, and
Performance in Airline Markets,”International Journal of Industrial Or-ganization, 12, 457–471.
Lederman, M. and S. Januszewski(2003): “Entry Patterns of Low-Cost
Airlines,” Working paper, Cambridge.
Lin, J.-S., M. Dresner, and R. Windle (2002): “Determinants of Price
Reactions to Entry in the U.S. Airline Industry,”Transportation Journal, 41, 5–22.
Mata, J. and P. Portugal(1994): “Life Duration of New Firms,”Journal
of Industrial Economics, 42, 227–245.
Morrison, S. and C. Winston (1990): “The Dynamics of Airline Pricing
and Competition,”American Economic Review, Papers and Proceedings, 80, 389–393.
Oliveira, A. V. (2008): “An empirical model of low-cost carrier entry,”
Transportation Research Part A: Policy & Practice, 42, 673–695.
Reiss, P. C. and P. T. Spiller (1989): “Competition and Entry in Small
Airline Markets,”Journal of Law and Economics, 32, S179–S202.
Shane, S. and M.-D. Foo (1999): “New Firm Survival: Institutional
Ex-planations for New Franchisor Mortality,”Management Science, 45, 142– 159.
Sinclair, R. A. (1995): “An empirical model of entry and exit in airline
markets,”Review of Industrial Organization, 10, 541–557.
Spulber, D. (2009): Economics and Management of Competitive Strategy,
New Jersey: World Scientific.
US General Accounting Office(2001): “Aviation Competition -
Chal-lenges in Enhancing Competition in Dominated Markets,” Gao/01-518t, Washington D.C.
Wooldridge, J. (2002): Econometric Analysis of Cross Section and Panel
A. Appendix
Table 4: Description of variables
Variable Description
Route characteristics
Distance Non-stop distance in 100 miles
Passengers Sum of passengers (in thousands) in the previous period
(DB1B)
Route HHI Route HHI (0-100) in the previous period,
passenger-based (DB1B)
Chapter 11 route At least one Chapter11-airline serves the route
LCC comp. Number of other low-cost carrier serving the market
Netw. economies Number of potential new one-stop connection routes
(=# B6 routes Airport A +# B6 routes Airport B)
Existing market Route is already served directly by some other airline
Airport characteristics
Secondary airp. At least one airport is a secondary airport
Slot restr. airp. At least one airport is slot-restricted
Airp. HHI HHI (0-100) at the airports in the previous period
(Mean), passenger-based
Non-HUB Airport’s passenger share is below 0.25 percent (at least
one of the airp.)
PFC Passenger Facility Charge in 1995 USD (Mean)
Demographic characteristics
Population Population estimate in Mio inhabitants (Mean)
Income Average weekly wage in 1995 USD (Mean)
Table 5: Log-normal Regressions on non-stop entry (accelerated failure-time metric) All non-stop entries Non-stop entry into connecting markets Non-stop entry into existing non-stop markets
Variables coeff. s.e. coeff. s.e. coeff. s.e.
Route characteristics Distance -0.174*** (0.058) -0.085 (0.066) -0.368*** (0.141) Distance2 0.004** (0.002) 0.002 (0.002) 0.011** (0.005) Passengers -0.001 (0.002) -0.045** (0.019) -0.002 (0.002) Route HHI -0.013** (0.005) -0.014* (0.007) -0.016 (0.010) LCC comp. 0.240* (0.127) 0.425* (0.221) 0.393* (0.208) Chapter 11 route 0.357 (0.229) 0.168 (0.271) 0.516 (0.532) Netw. economies -0.144*** (0.031) -0.118*** (0.041) -0.259*** (0.097) Existing market -0.955*** (0.303) Airport characteristics Secondary airp. -0.661*** (0.235) -1.179*** (0.442) -0.397 (0.367)
Slot restr. airp. 0.856** (0.335) 0.709 (0.513) 0.908 (0.563)
Airp. HHI 0.069*** (0.014) 0.043** (0.019) 0.093*** (0.026) Non-HUB 1.529** (0.598) 1.648** (0.808) -1.260 (1.555) Airp. HHI× Non-HUB -0.015 (0.018) -0.012 (0.021) 0.077 (0.061) PFC -0.127 (0.164) -0.012 (0.188) -0.618 (0.465) Demographic characteristics Population -0.215*** (0.046) -0.178*** (0.060) -0.286*** (0.096) Income -0.001 (0.001) -0.002 (0.002) -0.001 (0.002) Unempl. 0.541*** (0.106) 0.370*** (0.127) 0.892*** (0.259) Constant 7.298*** (1.299) 8.160*** (1.908) 7.444*** (2.723) Observations 420,219 349,670 70,549 Markets 13,052 11,800 2,583 Entries 124 45 79 Log-likelihood -398.5 -180.8 -192.3 χ2 672.6 242.8 348.2
Notes: *** p<0.01, ** p<0.05, * p<0.1, standard errors in parentheses.
Source: U.S. DOT T100 Market Segment Data, U.S. DOT DB1B Origin and Destination Survey, U.S. Census Bureau, Bureau of Labor Statistics, authors’ calculations.