Speech emotion classification using fractal
dimension-based features
Gintautas Tamuleviˇcius, Rasa Karbauskait˙e, Gintautas Dzemyda Vilnius University Institute of Data Science and Digital Technologies, Akademijos str. 4, Vilnius LT-08412
Received:August 1, 2018 / Revised:September 6, 2019 / Published online:September 27, 2019 Abstract.During the last 10–20 years, a great deal of new ideas have been proposed to improve the accuracy of speech emotion recognition: e.g., effective feature sets, complex classification schemes, and multi-modal data acquisition. Nevertheless, speech emotion recognition is still the task in limited success. Considering the nonlinear and fluctuating nature of the emotional speech, in this paper, we present fractal dimension-based features for speech emotion classification. We employed Katz, Castiglioni, Higuchi, and Hurst exponent-based features and their statistical functionals to establish the 224-dimensional full feature set. The dimension was downsized by applying the Sequential Forward Selection technique. The results of experimental study show a clear superiority of fractal dimension-based feature sets against the acoustic ones. The average accuracy of 96.5% was obtained using the reduced feature sets. The feature selection enabled us to obtain the 4-dimensional and 8-dimensional sets for Lithuanian and German emotions, respectively.
Keywords:fractal dimension, speech emotion, feature selection.
1
Introduction
The speech emotion recognition is not a new task. The first investigation results were published 30–35 years ago [5, 41, 42]. The outbreak of investigations appeared in the last two decades: various effective feature sets and feature formation techniques were proposed, various classifications, and multi-modal schemes were applied.
Most of the modern investigations report speech emotion classification rates of 70– 90% [4, 45, 54]. Particular results depend on the analyzed language, the number of emo-tions, the speaker mode, and other important factors.
Looking from the perspective, a few trends in the speech emotion recognition could be distinguished over the years. First of all, the exploration of acoustic features should be mentioned: all research efforts were aimed at defining and applying feature sets for the speech emotion classification. The proposed sets included various time, spectral and cepstral features, that describe the rate, intensity, and prosody of the emotional speech [27,50,52]. Besides, the sets were extended with various statistics of the primary features.
c
2019 Authors. Published byVilnius University Press
That resulted in enormous sets up to a few thousand features [44, 51]. There emerged a need for feature dimension reduction. Various feature selection and transformation tech-niques have been proposed for the reduction of feature sets [1,11,26,40,43]. Nevertheless, both selection and extraction techniques yield suboptimal feature subsets.
The rise of deep learning techniques brings so-called end-to-end speech emotion recognition paradigm [14, 49]. Employment of deep learning networks enables us to analyze the time representation of the speech signal directly. In this way, the neural network becomes a “black-box” analysis technique for speech emotion feature extraction. Nevertheless, acoustic (or any other) analysis of the speech signal still remains relevant topic in speech emotion recognition [13, 28, 55].
The additional emotional attribute sources such as face expression, body pose and gesture, electrocardiography, electroencephalography have been proposed for the imple-mentation of multi-modal speech emotion recognition [8, 25]. However, a multi-modal analysis means aggregation of different data, additional recording devices, and more complex logic of decision making. Thus, the speech signal analysis still remains an attractive way to identify emotions.
In parallel with the task of speech emotion recognition, the idea of the nonlinear nature of a speech signal has been developed [47, 48]. Widely used linear models cannot help to deal with the natural speech phenomena such as elision, co-articulation, assimilation, rapid variations in the speech rate, fundamental frequency due to the speaker’s emotional state, health state or physical activities. Therefore, different nonlinear techniques have been proposed for modeling and analysis of a speech signal: nonlinear predictors, energy operators, various modulation types [10], chaotic models, and fractal-based methods [33]. A fractal can be defined as an abstract mathematical object that describes a particular set or sequence of values. A fractal exhibits a pattern-based fragmentation, self-similarity, and self-affinity. Consequently, the fractal objects may be used to describe the irregular or fragmented shape of natural features as well as other complex objects that the traditional Euclidean geometry fails to analyze. The fractal properties of the object are characterized using a fractal dimension (FD) value [19, 21]. It characterizes how densely a fractal fills the space at different scales. The fractal dimension must not be an integer and it is often a real number [21]. When FD is applied to one-dimensional or higher-dimensional real data, the fractal dimension is capable to estimate the fragmentation level of the data.
The origin of a fractal dimension is the Hausdorff dimension [30]. The Hausdorff dimensiondH is defined as
dH = logN
logr,
whereN is the number of self-similar objects created from the original object when it is divided byr, i.e., each object isrtimes smaller than the original one.
In [21], the Hausdorff dimension dH of a setX ⊂ Rn is defined in detail. Since
it is difficult to evaluate the Hausdorff dimension numerically, various definitions of a fractal dimension have been proposed or derived from the Hausdorff dimension. In practical applications, the Hausdorff dimension is substituted by other fractal dimensions [19–22], i.e., the box-counting (also known as the Minkowski–Bouligand dimension or
capacity dimension), information, correlation, generalized Renyi, packing, Liapunov, Katz, Higuchi, Maragos, Castiglioni dimensions, etc.
In data analysis, the fractal dimension can be employed to solve various problems: FD is used to estimate the intrinsic dimensionality of high-dimensional data [15, 19, 21, 24] as well as other intrinsic dimensionality estimators [20, 22]. FD may be applied to reduce the initial dimensionality of data [19, 37, 53] or to describe the complexity of the analyzed object [19]. FD is also applied in the analysis of one-dimensional time series: biomedical signals such as electrocardiogram [35], electroencephalogram [39], and speech signal [2, 3, 32, 38].
Fractal dimension-based analysis of the emotional speech is not a new idea. The relation between box-counting dimension and emotional utterance waveform has been declared in [31]. In [11], the same dimension was combined with spectral and energy fea-tures. Detrended Fluctuation Analysis-based fractal dimension calculation was presented in [38]. Here, the obtained average emotion classification accuracy was 77% for German language. Higuchi fractal dimension was applied for multiresolution analysis-based audio emotion recognition in [12].
Considering the nonlinearity of emotional speech, the fractal-based analysis is applied to classify speech emotions. In this paper, we demonstrate that the fractal analysis is capable to describe the specificities and differences of emotional speech.
2
Fractal-based analysis of the speech signal
2.1 Emotions in speech
The speech signal is generated by the airflow floating through the vocal folds and a vocal tract. Depending on the vocal fold operation (closed or relaxed), movements and the position of articulators (position of tongue and velar, closed or open lips), various sounds are generated: voiced and voiceless, consonants and vowels. The result of this process is quite unique. All the pronunciations of the same phoneme, syllable of a word will be different. This is because the speech production process is impacted by multiple factors: the speaker’s age, gender, physiological state, emotional state, acoustic environment, the topic of conversation, and others.
The emotional state affects the entire process of speech production: respiration rate (anger and stress increase it), activity of vocal folds, dryness of the mouth, and movements of articulators [16]. All that results in variations of fundamental frequency, duration of vowels, varied speaking rate and loudness, shorter pauses, and other speech emotion markers (Fig. 1).
Various analysis techniques were applied to represent all these speech signal varia-tions across emovaria-tions. Considering the enormous number of employed acoustic features, their temporal and statistical functionals, multi-stage classification schemes, multi-modal classification ideas, we can state that the classification of speech emotions is still a task of limited success.
In this paper, we have applied a fractal-based analysis for the extraction of speech emotion features. Since the fractal dimension can describe the fragmentation, irregularity,
(a) (b) (c)
Figure 1.The waveform of the German sound [a] in the neutral state (a), sadness (b), and anger (c).
and self-similarity of the speech signal, different signal patterns should yield different fractal dimension values, which might enable us to identify speech emotion.
2.2 Fractal dimensions for a speech signal
The fractal-based analysis is a natural decision for an image analysis, where a coverage in a two-dimensional space is analyzed. In the case ofN×M size image, the fractal-based analysis requires a computational complexity of orderO(N×M). Therefore, we restrict ourselves to one-dimensional analysis only, which would require the complexity of order
O(N).
From the graphical point of view the speech waveform is a planar curve with a mono-tonically increasing argument (time variable). We can expect the fractal dimension value larger than 1 (the straight line has FD= 1) and smaller than 2 (fully filled two-dimensional space).
There are many algorithms for estimating the fractal dimension of one-dimensional sequences, proposed by Maragos [32], Katz [23], Higuchi [17], Castiglioni [9], the am-plitude scale method, etc. Hereinafter we define the fractal dimension calculation for the speech signal.
Let us analyze and denote a speech signal asX = {x(1), x(2), . . . , x(N)}. We are not going to consider the sampling period value, but integer values of time indices of the signal samples. That makes our extracted features independent of the signal sampling frequency.
2.2.1 The Katz algorithm
The Katz fractal dimension of a waveform is defined in [23] as
D= lg(L/ ¯ l)
lg(d/¯l), (1)
whereLis the sum of Euclidean distances between adjacent signal values and can be interpreted as an accumulated change of the speech signal values.L is calculated as
follows: L= N−1 X i=1 li,i+1= N−1 X i=1 q 1 + x(i+ 1)−x(i)2 . (2)
The value din (1) is the maximum distance between the first signal value and any other:
d= max
26i6N{l1,i}, (3)
We calldas the signal extent, since it represents the maximum change of the signal value in comparison with the first one (which is likely to represent the silent segment of the speech).
The accumulated changeLand the signal extentdare normalized by the factor¯lthat is calculated as the average distance between adjacent signal values
¯l= L
N−1. (4)
Normalization discards the impact of a signal dynamic range on the calculated FD value and makes it dimensionless.
Considering (4), Katz FD expression (1) can be rewritten as
D= lg(N−1)
lg(N−1) + lg(d/L). (5)
By analyzing the Katz FD expression obtained in (5), we can determine the relation-ship between the Katz fractal dimension and the properties of the speech signal. The more high frequency components appear in the speech signal, the lower value the ratiod/L
acquires (because of increasingL). Therefore, a higher value ofDwill be obtained. On the contrary, a low value ofDwill reflect dominance of low frequency components. Thus, for high arousal emotions (like anger, joy), containing more high frequency components, we can expect higher Katz FD values. Lower values will identify low arousal emotions (sadness, boredom).
2.2.2 The Castiglioni algorithm
The Castiglioni fractal dimension can be considered as a modified version of the Katz FD. In his paper [9], Castiglioni has discovered that the Katz algorithm considers a signal as a two-dimensional value with homogeneous argument variables and this is true for geometrical shapes and curves where both variables represent physical distance. In the case of time series (for example, speech signal), we have single-dimensional sequences with completely different time and signal variables.
The core of Castiglioni proposed modification is refusal of time index from the cal-culation of accumulated distanceLand the signal extentd. In this case, (2) and (3) are
expressed as follows: L= N−1 X i=1 x(i+ 1)−x(i) , d= max x(i) −min x(i) , i= 1, . . . , N.
Lcan be interpreted as an accumulated change of signal values, anddas a dynamic range of the speech signal.
The descriptive properties of the Castiglioni dimension should be similar to that of Katz FD properties. The speech with high frequency components (i.e., abrupt changes of the signal) would have a higher Castiglioni FD value, whereas the low frequency-based speech would have a lower FD value.
2.2.3 Higuchi algorithm
The Higuchi approach [17] evaluates the regularity properties of a time series over dif-ferent time scales. Employment of difdif-ferent time scales enables us to analyze frequency properties of time series. The more changes we find in a sequence in time scales, the more irregular the analyzed sequence is supposed to be.
In the speech signal analysis different time scales correspond to the different sampling frequency of the signal. At first, a set of the original signal segments{Xm}is obtained
by shifting the starting time moment of the signal bymsamples. These signal segments are resampled, obtainingknew versions{Xmk}of the signal. The obtained new signals are described as follows:
Xmk =
x(m), x(m+k), . . . , x m+bm, kc ·k ,
wherem,m = 1,2, . . . , k, is the starting index value,kindicates a resampling period,
k= 1,2, . . . , kmax.bm, kcdenotes the integer part of the ratio(N−m)/k.
Then, the frequency properties of the resampled signal are estimated by calculating the normalized accumulated change of signal values:
Lm(k) = N−1 bm, kck2 bm,kc X i=1 x(m+ik)−x m+ (i−1)k) .
The average accumulated changeL(k)of the sequenceX for eachk,k = 1,2, . . . , kmax, is defined as the average value ofLm(k)for allm= 1,2, . . . , k. Then the Higuchi
FD value is obtained as theDvalue assumingL(k)∝k−D.
The idea of the Higuchi FD is as follows. Resampling of a nonstationary high-frequency signal segment will result in a set of quite different versions of the original signal. There-fore, the nonlinear dependency law ofL(k)yields a non zero value of D. The more similar the resampled sequences are, the closer to zero the value ofDis attained.
2.2.4 The Hurst exponent
The Hurst exponent was proposed to evaluate a long-term memory and fractality of time series [18, 30]. It characterizes the dynamics of time sequences and can be estimated both globally for the entire sequence and locally by applying a sliding window [36].
The originally proposed evaluation technique of the Hurst exponent is based on a re-scaled-range analysis of time series. The ratio of range and standard deviation (rescaled range) is calculated for all possible length segments of the analyzed series. The statistics of the rescaled range considered to follow a power law, and the Hurst scaling exponentH
is defined as a power index:
E R(M)
S(M)
=CMH, M → ∞,
whereR(M)is the range of the firstMsequence values,S(M)is their standard deviation,
E[·]is an expectation operator,M is the number of analyzed sequence values, andCis a constant.
The value of the Hurst exponent lies between 0 and 1 [30]. The Hurst exponent value can be applied to estimate the sequence dynamics:
• H <0.5: a sequence is said to be anti-persistent, negative deviations of the values are followed by positive deviations. In other words, the autocorrelation of such a sequence is negative. That could be characteristic of high frequency (as compared to the sampling frequency) speech segments. As we have mentioned before, high frequency components can be the attribute of the high arousal emotions in the speech.
• H > 0.5: a persistent sequence with trending variation of values. In this case, the autocorrelation of a signal is considered positive, which could be a sign of dominant low frequency components in a speech signal and low arousal emotions of the speaker.
• H = 0.5: there is no correlation between sequence values and the analyzed se-quence is considered as random, the change of the value is hardly predictable. In the case of a speech signal, that can be interpreted as a constant change of the signal: the signal contains segments with the positive and negative autocorrelation. Nevertheless, it will be true both for random and quasi-periodic speech signals of any frequency and cannot be considered as characteristic of a particular emotion. In order to relate the Hurst exponentHvalue with fractal dimensionDand consider-ing their ranges, the Hurst exponent-based fractal dimension is expressed as follows:
D= 2−H.
In addition to the rescaled-range technique, many different techniques were proposed for estimating the Hurst exponent [6]: detrended fluctuation analysis, periodogram anal-ysis, aggregated variance method, local Whittle estimator, wavelet analanal-ysis, absolute moments method, Geweke–Porter–Hudak estimator, and others. Nevertheless, their de-scriptive and discriminant power for the speech signal analysis is not established and should be considered as unknown.
3
Fractal dimension-based feature sets
Considering the variability of a speech signal, all emotional utterances were analyzed in the classical frame-by-frame manner. Therefore, the FD-based speech emotion features were extracted from fractal dimension values in two steps. At first, the frame-level fea-tures were extracted. At the second step, utterance-level feafea-tures were generalized from the frame-level data.
In order to highlight fractal properties of the speech signal, segments 3–4 fundamental periods long were analyzed. That ensured the waveform of the speech signal to have at least 3–4 affine segments. Therefore, the frames 45 ms long were selected for the analysis with 20% overlap to ensure the time consistency of signal variation. Eight different FD values were extracted for each frame of the signal: Katz, Castiglioni, Higuchi and 5 differ-ent Hurst expondiffer-ent-based (approximated by polynomial, detrended fluctuation analysis, average wavelet coefficient, Geweke–Porter–Hudak estimator, and generalized version of the Hurst exponent) fractal dimension values. The result of the first step analysis was sequences of FD values for each emotional utterance.
Utterance-level features were established as statistical generalizations of the frame-level feature values during the utterance. We believe that utterance-frame-level features will generalize the emotion-driven variability of FD values and will gain discriminative power of the features.
For utterance-level features we calculated the following statistical functionals of the frame-level FD values [46]:
• Range values: minimal, maximal values, and the range of the fractal dimension.
• Mean values: arithmetical, geometrical, and harmonic mean values of the FD se-quences. Mean values excluding outliers were calculated additionally.
• Higher moments: variance, skewness, and kurtosis of the FD values.
• Central moments: 2nd–5th central moments.
• Quantiles: 5 different quantiles were calculated as well.
In total, 28 different functionals were calculated for each of 8 aforementioned FD values. Hence, a full set of 224 utterance-level features was extracted for every emotional utterance. Considering different value ranges and variation of the calculated functional values, all the extracted 224 features were normalized. The maximum value of a partic-ular feature-based normalization was selected to obtain homogeneous feature sets with a unitary range.
In some cases, 224 feature sets may be considered as redundant. If the speech dataset analyzed contains less than 200 samples of every emotion, the classification process becomes biased. The Sequential Forward Selection (SFS) technique was applied to reduce the initial feature set size. The SFS technique is a suboptimal feature filtering approach to eliminate redundant, irrelevant or noisy features. The reduced feature set is constructed by adding overall set efficiency improving features. As our experience shows, the employ-ment of feature selection techniques causes reduction of feature sets up to a few hundred times [29].
Therefore, two different feature sets have been obtained for experimental investiga-tion: a full feature set and the SFS-based feature set.
4
Experimental results and discussion
The proposed fractal dimension features were experimentally tested in classifying the speech emotion. The task of 7 emotions was selected as the most difficult one and assum-ing it able to confirm the quality of the proposed features.
Two databases were employed for the experimental investigation: the Berlin database of the German emotional speech [7] and the database of Lithuanian speech emotions [34]. The total amount of emotional German utterances was 535 (recorded by 5 male and 5 female speakers). The following emotions were analyzed: anger (127 utterances), bore-dom (81 utterance), disgust (46 utterances), fear (69 utterances), happiness (71 utterance), sadness (62 utterances), and the neutral state (79 utterances).
The recorded Lithuanian emotion set was a little bit different: anger, astonishment, disgust, fear, happiness, sadness, and the neutral state. The number of each emotional pattern was 1000 utterances (pronounced by 10 speakers).
In order to obtain comparable results, a classification with both databases was per-formed under the same conditions. A 10-fold cross-validation scheme was chosen for
K-Nearest Neighbor classifier-based experimental testing (withK= 5). This choice was due to the limited amount of German data. The results of statistical classification would not be reliable in the German case, and employment of different techniques would lead to incomparable and hardly interpreted experimental results.
Firstly, the general efficiency of feature sets was estimated. To this end, the criterion of the classification accuracy (CA) was applied.
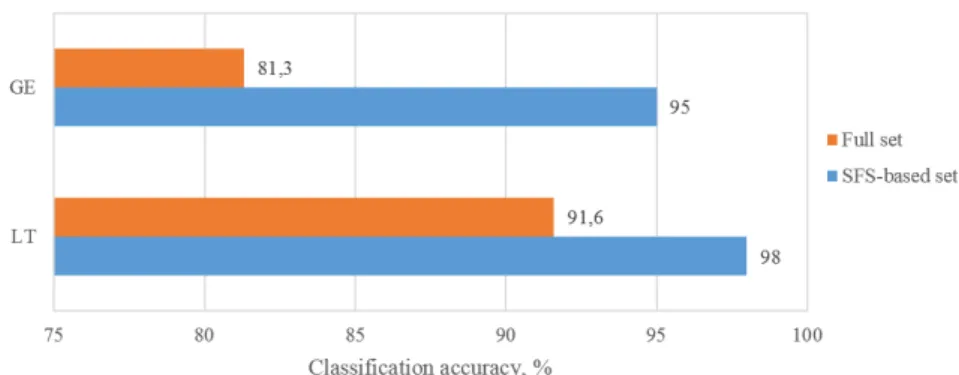
Figure 2 shows the averaged classification rates for different databases and feature sets. We can see the obvious superiority of the SFS-based FD feature sets in both lan-guages. Feature selection led to higher classification results: approximately by 14% in the German case and by more than 6% in the Lithuanian case.
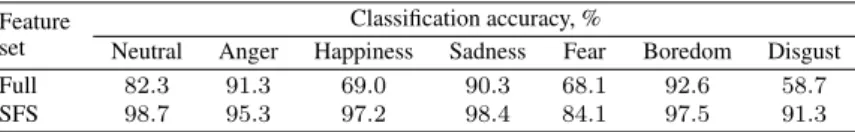
Table 1.Classification rates of German emotions. Feature
set
Classification accuracy, %
Neutral Anger Happiness Sadness Fear Boredom Disgust Full 82.3 91.3 69.0 90.3 68.1 92.6 58.7
SFS 98.7 95.3 97.2 98.4 84.1 97.5 91.3
Table 2.Classification rates of Lithuanian emotions. Feature
set
Classification accuracy, %
Neutral Anger Happiness Sadness Fear Astonishment Disgust Full 92.0 94.0 86.6 95.2 87.7 96.7 88.8
SFS 99.9 97.9 94.8 99.9 96.8 98.9 97.9
The employment of feature selection for the German case has developed the 8-dimen-sional feature set. In the Lithuanian case, the obtained sets dimension was 4. Thus, the increase of the analyzed pattern set did not bring an expansion of the feature set. This re-sult is the opposite to our experience with the acoustic feature sets. There the expansion of feature sets was remarkable [29]. This result indicates that the speech emotion recognition task is a full data-driven problem: all the techniques and feature sets can be approved only by the experimentally tested data set. Therefore, this fact needs for a further investigation and analysis.
The obtained average accuracy rates are quite high. They are similar or higher as compared to the results of the acoustic analysis of speech emotions [29]. These higher results have been obtained using the straightforward classification (against hierarchical, step, or stage classification schemes) and plain feature set (against multi-level and complex sets). Thus, we can state a clear superiority of FD features against the acoustic ones.
Tables 1 and 2 present the classification rates of German and Lithuanian emotions, re-spectively. In the German case, the lowest rates, using a full feature set, were obtained for happiness, fear, and disgust in all the cases, the rates were below 70%. Similar results were obtained in the Lithuanian case: the classification rates of happiness, fear, and disgust were poorest (below 90%). SFS-based selection of features raised up the classification results of these emotions above 90% (except the German fear with the rate of 84.1%).
For a deeper analysis of the classification, confusion matrices are given in Tables 3 and 4 (here N, A, H, S, B, and D denote first letters of the analyzed emotions). The highest false positive rates, in the German case, were observed for happiness (19.7% of happy patterns were classified as angry) and disgust (17.4% as fear). In the Lithuanian case, 6.6% of happiness were identified as fear, and 6.4% of fear were identified as happiness. These results correlate with the acoustic analysis of speech emotions: anger and happiness were the most heavily distinguished emotions.
The results of the German and Lithuanian emotions differed quantitatively. The ex-planation for this fact may be the different contingent of recorded persons. In the German case, all emotions were played by professional actors, while in the Lithuanian case, the recordings were performed by nonprofessional actors. Besides, there are not enough experimental data to state a linguistic reason for the obtained differences.
Table 3.Confusion matrix of Lithuanian emotions. Actual emotions Predicted emotions, % N A H S F B D N 82.2 0.0 1.3 1.3 1.3 12.6 1.3 A 0.0 91.3 7.9 0.0 0.8 0.0 0.0 H 2.8 19.7 69.1 1.4 5.6 1.4 0.0 S 4.8 0.0 0.0 90.4 1.6 0.0 3.2 F 2.9 7.2 13.1 2.9 68.2 4.3 1.4 B 5.0 0.0 1.2 0.0 0.0 92.6 1.2 D 2.2 10.9 4.3 6.5 17.4 0.0 58.7
Table 4.Confusion matrix of German emotions. Actual emotions Predicted emotions, % N A H S F As D N 92.0 1.3 0.4 0.0 1.8 0.3 4.2 A 1.0 94.0 1.5 0.0 1.0 0.5 2.0 H 1.4 1.9 86.6 0.4 6.6 0.1 3.0 S 0.2 0.4 0.4 95.2 1.3 2.2 0.3 F 0.9 0.7 6.4 0.9 87.7 0.0 3.4 As 0.4 0.4 0.3 1.5 0.2 96.7 0.5 D 2.7 1.6 2.4 1.0 3.4 0.1 88.8
The analysis of selected features has shown that two types of the fractal dimension dominated in features: Higuchi and Hurst exponent dimensions. For the German emo-tions, the feature set consisted of 3 Higuchi (mode, 10% and 25% quantile values) and 5 Hurst exponent-based (mode, median, maximal, 10% and 90% quantile values) features. The selected features for the Lithuanian emotions were: 3 Higuchi (the same as in German case) and 1 Hurst exponent-based (mode value) dimensions.
Comparing the feature sets of the German and Lithuanian emotions, we can state a full overlap of these sets: the entire feature set of the Lithuanian emotions was included in the set of German emotions. This fact and the high rates obtained show high discriminative power of the selected fractal dimensions. Nevertheless, there are not enough data and results to claim feature appropriateness for different language emotions.
The speech emotion classification, using acoustic features [29], has led to a high variability of the selected feature sets for different tasks. Comparative study of acoustic and fractal features has shown the clear superiority of fractal-based analysis in speech emotion classification [46]. Acoustic features (including various time, energy, fundamen-tal frequency, spectral, and mel-frequency cepstral characteristics) has resulted in 12–20% lower classification rates. In this study, fractal dimension-based features demonstrated a higher coherence in the speech emotion classification task than acoustic features: a full overlap of features was observed in different language emotions. In the case of acoustic features, the overlap of feature sets for Lithuanian and German languages was up to a few percents.
In order to affirm the discriminative power of the selected fractal dimension-based features, we have decided to carry out a speaker-independent emotion classification. We have appliedLeave-One-Speaker-Outtechnique for testing data separation. This is the
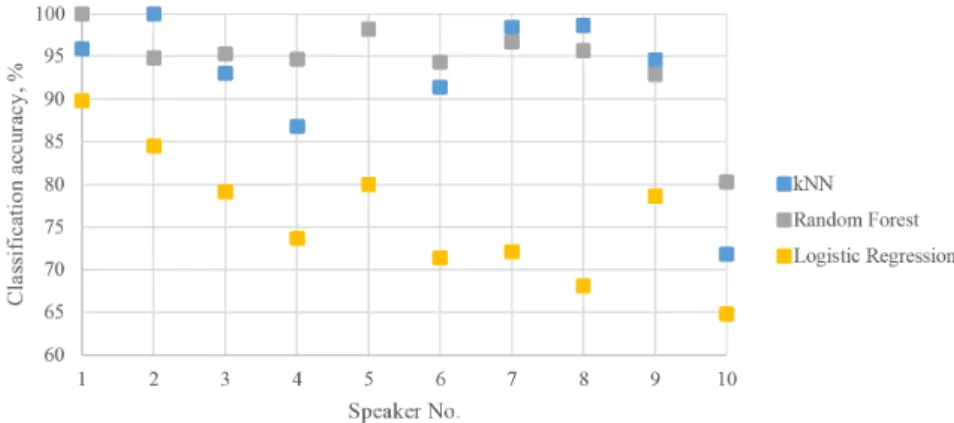
Figure 3.Speaker-specific rates of speech emotion classification (Lithuanian language).
Figure 4.Speaker-specific rates of speech emotion classification (German language).
most rigorous testing for the speech analysis-based classification tasks, as the testing is based on unknown data (which was not the case in our first experiment).
All the utterances of the individual speaker were dedicated to the testing subset, and the remaining utterances were employed as the training data. Totally, ten different cases with different testing data were analyzed. For feature set validation purposes, 3 different classification techniques were employed for the same feature set in the experiment: kNN (number of neighbours: 5, metric: Euclidean, weight: distance), Random Forest (number of trees: 10), and Logistic Regression (regularization type: Lasso (L1), strength:C = 1) based classification. The individual classification rates for every speaker are given in Figs. 3 and 4.
In case of emotional Lithuanian speech (Fig. 3), the individual speaker results for the different classification techniques are similar in most cases, only in case of Speakers Nos. 1 and 5, results are scattered.
The averaged classification rates for the classification techniques were as follows: 97.4% (kNN case), 97.5% (Random Forest), and 96.2% (Logistic Regression). The dif-ference between different classification technique rates was less than 2%. Therefore, in case of emotional Lithuanian speech, the discriminative power of the fractal dimension-based features is affirmed.
In case of German language (Fig. 4), we observe different results. The main reason for differences was the amount of speech data. For the German language, the number of emotional utterances varied from 1 (fear by Speaker No. 2 and disgust by Speaker No. 4) to 16 examples (anger by Speaker No. 8). This data unbalance affected the classifica-tion rates heavily. The average rate of Logistic Regression-based classifier has decreased down to 76.2%. The average rates for kNN and Random Forest classifiers were 92.8% and 94.3% respectively. Although these average values are comparable with the case of Lithuanian speech, the scattering of individual speaker results was higher for German speech. The difference between classifiers has increased also and reached 30% (in case of Speaker No. 8).
The classification results for Speaker No. 10 were the lowest individually (72.3%). The reason for this could be the following: emotions of this speaker differ acoustically from the rest mostly.
This scattering (both in Lithuanian and German cases) can be the consequence of the impact of varying speaking style, recording conditions, or any other acoustic variability among speakers. This may be the result of insufficient training: the training set of 9 speakers is not sufficiently representative. Using larger training data would solve this problem.
5
Conclusions
In this study, we applied fractal dimension-based features in the speech emotion classifi-cation. These features were proposed considering the nonlinear and fluctuating nature of the emotional speech. Katz, Castiglioni, Higuchi, and 5 different Hurst exponent-based features were employed for the classification of 7 emotions in two different languages: German and Lithuanian.
The initial set of 224 features was reduced down to the 4-dimensional and to the 8-dimensional (for the Lithuanian and the German emotions, respectively) by applying the Sequential Forward Selection technique. Employment of the feature selection has increased the classification accuracy by 14% in the German case and more than 6% in the Lithuanian case. The obtained average classification accuracy was 96.5% for both languages. The classification accuracy of 97.2% was achieved in the speaker-independent mode for the Lithuanian case and 94.3% for the German case, respectively.
Considering the obtained results, we conclude our study as follows:
• Fractal dimension-based features are distinguished by their discriminative power and coherence as compared to the acoustic features. The obtained average clas-sification accuracy of 96.5% (86.5% for a full feature set) significantly exceeds
the acoustic feature-based classification accuracy. Besides, the fractal dimension-based analysis of the speech signal provides more coherent feature sets for different classification tasks.
• An increase in emotional patterns did not increase the size of the required feature set. This result contradicts the results of the previous studies using the acoustic features. Besides, the fractal dimension-based features enabled us to separate anger and happiness reliably, which is not the case using the acoustic feature sets. There-fore, the result implies the idea about the data-driven nature of the speech emotion recognition problem.
• The feature selection provided 6–14% higher classification rates (for the Lithuanian and the German emotions, respectively) in comparison with the full feature set. The improvement has been obtained employing 28–56 times smaller feature sets as compared with the full feature sets.
• The selected feature sets both for the German and Lithuanian emotions consisted mainly of Higuchi and Hurst fractal dimension-based features. These fractal dimen-sion techniques can be treated as having a high discrimination power to classify speech emotions.
References
1. M. Abdelwahab, C. Busso, Ensemble feature selection for domain adaptation in speech emotion recognition, in IEEE International Conference on Acoustics, Speech and Signal Processing (ICASSP), IEEE, New York, 2017, pp. 5000–5004.
2. Z. Ali, I. Elamvazuthi, M. Alsulaiman, G. Muhammad, Detection of voice pathology using fractal dimension in a multiresolution analysis of normal and disordered speech signals,J. Med. Syst.,40:20, 2016.
3. P. Baljekar, H. Patil, A comparison of waveform fractal dimension techniques for voice pa-thology classification, inIEEE International Conference on Acoustics, Speech and Signal Processing (ICASSP), IEEE, New York, 2012, pp. 4461–4464.
4. S. Basu, J. Chakraborty, A. Bag, M. Aftabuddin, A review on emotion recognition using speech, inInternational Conference on Inventive Communication and Computational Technol-ogies (ICICCT), IEEE, New York, 2017, pp. 109–114.
5. R. van Bezooijen, The Characteristics and Recognizability of Vocal Expression of Emotions, Foris, Dordrecht, 1984.
6. A. B˘arbulescu, C. Serban, C. Maftei, Evaluation of Hurst exponent for precipitation time series, inProceedings of the 14th WSEAS International Conference on Computers, WSEAS, Stevens Point, WI, 2010, pp. 590–595.
7. F. Burkhardt, A. Paeschke, M. Rolfes, W. Sendlmeier, A database of german emotional speech, inInterspeech, ISCA, Baixas, France, 2005, pp. 1517–1520.
8. C. Busso, Zh. Deng, S. Yildirim, et al., Analysis of emotion recognition using facial expres-sions, speech and multimodal information, inProceedings of the 6th International Conference on Multimodal Interfces ICMI’04, ACM, New York, 2004, pp. 205–211.
9. P. Castiglioni, What is wrong in Katz’s method? Comments on: ”A note on fractal dimensions of biomedical waveforms”,Comput. Biol. Med.,40(11–12):950–952, 2010.
10. T. Chaspari, D. Dimitriadis, P. Maragos, Emotion classification of speech using modulation features, in22nd European Signal Processing Conference (EUSIPCO), IEEE, New York, 2014, pp. 1552–1556.
11. L. Chen, X. Mao, Y. Xue, L.L. Cheng, Speech emotion recognition: Features and classification models,Digit. Signal Process.,22(6):1154–1160, 2012.
12. M. Cheng, A.Ch. Tsoi, Fractal dimension pattern-based multiresolution analysis for rough estimator of speaker-dependent audio emotion recognition, Int. J. Wavelets Multiresolut. Inf. Process.,15(5):1–17, 2017.
13. J. Deng, X. Xu, Z. Zhang, et al., Semisupervised autoencoders for speech emotion recognition,
IEEE/ACM Trans. Audio Speech Lang. Process.,26(1):31–43, 2018.
14. H.M. Fayek, M. Lech, L. Cavedon, Evaluating deep learning architectures for speech emotion recognition,Neural Netw.,92:60–68, 2017.
15. P. Grassberger, I. Procaccia, Measuring the strangeness of strange attractors, Physica D,
9(1–2):189–208, 1983.
16. J.H.L. Hansen, S. Patil, Speech under stress: Analysis, modeling and recognition, in C. Müller (Ed.),Speak. Class. I., Lect. Notes Comput. Sci., Vol. 4343, Springer, Berlin, 2007, pp. 108– 137.
17. T. Higuchi, Approach to an irregular time series on the basis of the fractal theory,Physica D,
31:277–283, 1988.
18. H.E. Hurst, Long-term storage of reservoirs: An experimental study, inTransactions of the American Society of Civil Engineering, Vol. 116, ASCE, New York, 1951, pp. 770–799. 19. R. Karbauskait˙e, G. Dzemyda, Geodesic distances in the intrinsic dimensionality estimation
using packing numbers,Nonlinear Anal. Model. Control,19(4):578–591, 2014.
20. R. Karbauskait˙e, G. Dzemyda, Optimization of the maximum likelihood estimator for deter-mining the intrinsic dimensionality of high-dimensional data,Int. J. Appl. Math. Comput. Sci.,
25(4):895–913, 2015.
21. R. Karbauskait˙e, G. Dzemyda, Fractal-based methods as a technique for estimating the intrinsic dimensionality of high-dimensional data: A survey,Informatica,27(2):257–281, 2016. 22. R. Karbauskait˙e, G. Dzemyda, E. Maz˙etis, Geodesic distances in the maximum likelihood
estimator of intrinsic dimensionality,Nonlinear Anal. Model. Control,16(4):387–402, 2011. 23. M.J. Katz, Fractals and the analysis of waveforms,Comput. Biol. Med.,18(3):145–156, 1988. 24. B. Kégl, Intrinsic dimension estimation using packing numbers, in S. Becker, S. Thrun,
K. Obermayer (Eds.),Advances in Neural Information Processing Systems 15 (NIPS 2002), MIT Press, Cambridge, 2003, pp. 697–704.
25. L. Kessous, G. Castellano, G. Caridakis, Multimodal emotion recognition in speech-based interaction using facial expression, body gesture and acoustic analysis,Journal of Multimodal User Interfaces,3(1–2):33–48, 2010.
26. R. Kohavi, G.H. John, Wrappers for feature subset selection, Artif. Intell.,97(1–2):273–324, 1997.
27. Sh.G. Koolagudi, K.R. Sreenivasa, Emotion recognition from speech: A review,Int. J. Speech Technol.,15(2):99–117, 2012.
28. P. Li, Y. Song, I. McLoughlin, et al., An attention pooling based representation learning method for speech emotion recognition, inInterspeech, ISCA, Baixas, France, 2018, pp. 3087–3091. 29. T. Liogien˙e, G Tamuleviˇcius, SFS feature selection technique for multistage emotion
recog-nition, in3rd Workshop on Advances in Information, Electronic and Electrical Engineering (AIEEE), IEEE, New York, 2015, pp. 1–4.
30. B.B. Mandelbrot,The Fractal Geometry of Nature, Henry Holt & Co, New York, 1983. 31. X. Mao, L. Chen, Speech emotion recognition based on parametric filter and fractal dimension,
IEICE Trans. Inf. Syst.,E93D(8):2324–2326, 2010.
32. P. Maragos, Fractal spects of speech signals: Dimension and interpolation, inIEEE Inter-national Conference on Acoustics, Speech and Signal Processing (ICASSP), IEEE, New York, 1991, pp. 417–420.
33. P. Maragos, A. Potamianos, Fractal dimensions of speech sounds: Computation and application to automatic speech recognition,J. Acoust. Soc. Am.,105(3):1925–1932, 1999.
34. J. Matuzas, T. Tišina, G. Drabaviˇcius, L. Markeviˇci¯ut˙e, Lithuanian spoken language emo-tions database, 2015, http://www.datasets.bpti.lt/lithuanian-spoken-language-emotions-database/.
35. A.K. Mishra, S. Raghav, Local fractal dimension based ecg arrhythmia classification,Biomed. Signal Process. Cntrol,5(2):114–123, 2010.
36. E. Molino-Minero-Re, F. García-Nocetti, H. Benítez-Pérez, Application of a time-scale local hurst exponent analysis to time series,Digit. Signal Process.,37:92–99, 2015.
37. Z. Ni, X. Wu, L. Ni, et al., The research on selective clustering ensemble algorithm based on fractal dimension and projection, Journal of Computational Information Systems,11(11): 4025–4035, 2015.
38. J.-S. Park, S.-H. Kim, Emotion recognition from speech signals using fractal features, Int. J. Software Eng. Appl.,8(5):15–22, 2014.
39. A. Petrosian, Kolmogorov complexity of finite sequences and recognition of different preictal eeg patterns, inProceedings of IEEE Symposium on Computer-Based Medical System, IEEE Computer Society Press, Los Alamitos, CA, 1995, pp. 212–217.
40. J. Rong, G. Li, Y.P.Ph. Chen, Acoustic feature selection for automatic emotion recognition from speech,Inf. Process. Manage.,45(3):315–328, 2009.
41. K.R. Scherer, Non-linguistic indicators of emotion and psychopathology, in C.E. Izard (Ed.),
Emotions in Personality and Psychopathology, Plenum, New York, 1979, pp. 495–529. 42. K.R. Scherer, R. Banse, H.G. Wallbott, T. Godbeck, Vocal cues in emotion encoding a
de-coding,Motiv. Emotion,15:123–148, 1991.
43. B. Schuller, A. Batliner, S. Steidl, D. Seppi, Recognising realistic emotions and affect in speech: State of the art and lessons learnt from first challenge, Speech Commun.,53:1062– 1087, 2011.
44. B. Schuller, B. Vlasenko, F. Eyben, G. Rigoll, A. Wendemuth, Acoustic emotion recognition: A benchmark comparison of performances, inIEEE Workshop on Automatic Speech Recogni-tion & Understanding, IEEE, New York, 2009, pp. 552–557.
45. M. Swain, A. Routray, P. Kabisatpathy, Databases, features and classifiers for speech emotion recognition: A review,Int. J. Speech Technol.,21(1):93–120, 2018.
46. G. Tamuleviˇcius, R. Karbauskait˙e, G. Dzemyda, Selection of fractal dimension features for speech emotion classification, in2017 Open Conference of Electrical, Electronic and Informa-tion Sciences (eStream), IEEE, New York, 2017, pp. 1–4.
47. H.M. Teager, S.M. Teager, Evidence for nonlinear sound production mechanisms in the vocal tract, in W.J. Hardcastle, A. Marchal (Eds.),Speech Production and Speech Modelling, NATO ASI series, Springer, Dordrecht, 1990, pp. 241–261.
48. I.R. Titze, R. Baken, H. Herzel, Evidence of chaos in vocal fold vibration, in I.R. Titze (Ed.),Vocal Fold Physiology: New Frontiers in Basic Science, Singula, San Diego, CA, 1993, pp. 143–188.
49. G. Trigeorgis, F. Ringeval, R. Brueckner, et al., Adieu features? End-to-end speech emotion recognition using a deep convolutional recurrent network, inIEEE International Conference on Acoustics, Speech and Signal Processing (ICASSP), IEEE, New York, 2016, pp. 5200–5204. 50. D. Ververidis, C. Kotropoulos, Emotional speech recognition: Resources, features, and
methods,Speech Commun.,48(3):1162–1181, 2006.
51. T. Vogt, E. André, Comparing feature sets for acted and spontaneous speech in view of automatic emotion recognition, inIEEE International Conference on Multimedia and Expo, IEEE, New York, 2005, pp. 474–477.
52. T. Vogt, E. André, J. Wagner, Automatic recognition of emotions from speech: A review of the literature and recommendations for practical realisation, in C. Peter, R. Beale (Eds.),Affect and Emotion in Human-Computer Interaction, Lect. Notes Comput. Sci., Vol. 4868, Springer, Berlin, 2008, pp. 75–91.
53. C. Zhang, Z. Ni, L. Ni, N. Tang, Feature selection method based on multi-fractal dimension and harmony search algorithm and its application,Int. J. Syst. Sci., pp. 3476–3486, 2015. 54. X. Zhang, Y. Sun, S. Duan, Progress in speech emotion recognition, inTENCON2015 –
IEEE Region 10 Conference, Macao, 1–4 November 2015, IEEE, New York, 2015, pp. 623– 628.
55. J. Zhao, X. Mao, L. Chen, Speech emotion recognition using deep 1D & 2D CNN LSTM networks,Biomed. Signal Process. Control,47:312–323, 2019.
![Figure 1. The waveform of the German sound [a] in the neutral state (a), sadness (b), and anger (c).](https://thumb-us.123doks.com/thumbv2/123dok_us/1282724.2672341/4.892.214.688.237.426/figure-waveform-german-sound-neutral-state-sadness-anger.webp)