Disclaimer: This student paper was prepared in 2014 as a requirement for the Master of Public Policy Program at Duke University’s Sanford School of Public Policy. The research, analysis, and recommendations contained in this paper are the work of the student who authored the document, and do not represent the official or unofficial views of the Sanford School of Public Policy, Duke University, or RTI International. Without the specific permission of its author, this paper may not be used or cited for any purpose other than to inform the client organization about the subject matter. The author relied in many instances on data provided by the client and related organizations and makes no independent representations as to the accuracy of the data.
Cocopeat Effluent Water Filtration Systems in the Philippines:
A Comparative Evaluation of Alternative Implementation Models
Prepared for:
David Robbins, Senior Water and Sanitation Specialist Research Triangle Institute (RTI) International
Prepared by: Seth Parsons
Master of Public Policy Candidate The Sanford School of Public Policy
Duke University
Advisor:
Professor Fernando Fernholz
i
Executive Summary
1Context & Problem Overview
There is a great necessity for improved sanitation practices in the developing world. Forty percent of the world’s population practice open defecation or lack adequate sanitation facilities. In urban areas throughout the developing world, where household and community toilets are available, 2.1 billion people use toilets connected to septic tanks that are not safely emptied or use other systems that discharge raw sewage into open drains or surface waters resulting in a greater incidence of waterborne diseases, poor drinking water quality, and contaminated water sources. In the Philippines, poor sanitation infrastructure and disease costs the economy $1.94 billion a year.
Improved sanitation practices and infrastructure are difficult to implement and sustain. Public services, treatment systems, and sanitation practices in the developing world often require sufficient land, capital, and energy resources that are often scarce. Low cost, sustainable improvements and innovations, as well as local acceptance and ownership, are necessary to develop and implement alternative technologies that can help reuse waste, improve water treatment and improve overall quality of sanitation services.
Researchers at Research Triangle Institute (RTI) International have developed and tested a secondary waste water treatment filter that can be appended to existing decentralized waste water treatment systems (DEWATS) and collection facilities. Using a cocopeat filter, the discarded dust and coir generated from coconut processing plants, an effective bio-filter unit can be
constructed. This simple device can easily be connected to existing septic tanks or other primary treatment components to filter effluent waste water and meet national discharge standards. This filtration technology has the potential to improve health and positively impact sanitation services for urban poor communities. Although successful pilot programs have been launched through grant funding and self-financing, RTI would like to explore alternative implementation models to deliver this technology to a larger audience in the Philippines.
Policy Question
What implementation models could RTI International consider for scaling up cocopeat bio-filtration systems to improve access to safe water and sanitation in urban poor areas of the Philippines?
1
This student paper was prepared in 2014 as a requirement for the Master of Public Policy Program at Duke University’s Sanford School of Public Policy. The research, analysis, and recommendations contained in this paper are the work of the student who authored the document, and do not represent the official or unofficial views of the Sanford School of Public Policy, Duke University, or RTI International. Without the specific permission of its author, this paper may not be used or cited for any purpose other than to inform the client organization about the subject matter. The author relied in many instances on data provided by the client and related organizations and makes no independent representations as to the accuracy of the data.
ii Data and Methodology
To assess and recommend potential implementation model options the following data and methodology was used:
Sanitation Sector Landscape Analysis – I conducted a literature review of the Philippines sanitation sector to assess the most significant institutional factors related to
implementing DEWATS projects.
Case Study Analysis – I collected and reviewed relevant case studies related to DEWATS
projects implemented in urban Philippines locations to determine key lessons learned, potential implementation models, and project financing structures.
Integrated Financial and Economic Analysis – From the financial and economic data
collected in the case studies, I analyzed cocopeat filter technology system costs with comparable secondary treatment systems. Additionally, I analyzed potential cost distributions of a cocopeat filter system using four different implementation models. Findings
Cocopeat filter technology is a proven low cost, sustainable, and effective alternative to other secondary waste water treatment technology options with comparable efficiency.
The Community Participation model shows the most potential for mitigating institutional
risks and constraints within the sanitation sector.
Efficient DEWATS implementation using a cocopeat filter has the potential to improve
benefit to cost ratios (BCRs), reduce cost burdens on direct users, and introduce sanitation treatment systems to urban areas where space constraints are a key limiting factor.
Recommendations
RTI could pursue Community Participation models for implementing cocopeat filter DEWATS projects with support from local government units (LGUs) and NGOs. This model shows the most promise for mitigating institutional risks, promoting awareness of sanitation benefits, driving ownership by end users, and enabling technology adoption. Given that technical implementation, social marketing, and sanitation training expertise resides predominantly with NGOs, RTI should also continue to promote the benefits of cocopeat filter technology through these subject matter experts.
iii
Table of Contents
List of Figures & Tables ... v
List of Appendices ... vi
List of Acronyms ... vii
I. INTRODUCTION ...1
POLICY QUESTION ...1
PROBLEM OVERVIEW ...1
CONTEXT & BACKGROUND...2
Sanitation in the Philippines ...2
Cocopeat Filter Research ...3
Current Cocopeat Collaborations ...4
Benefits of Cocopeat Filter Technology ...6
II. DECENTRALIZED WASTE WATER TREATMENT IN THE PHILIPPINES ...7
SANITATION SECTOR OVERVIEW ...7
Legislation & Policy ...8
Government Agencies ...8
Non-Governmental Agencies ...10
Technology Factors ...11
Social, Cultural & Economic Factors ...12
Key Risks & Constraints ...12
III. CASE STUDY ANALYSIS OF DEWATS FINANCING MODELS ...15
DATA & METHODOLOGY ...15
iv
Summary of Studies ...15
COMPARATIVE CASE STUDY ANALYSIS ...16
Private Participation Model ...17
NGO Model ...17
Local Government Model ...18
Community Participation Model...18
Comparison of Model Risks and Benefits ...19
IV. ANALYSIS OF FINANCING MODELS FOR A COCOPEAT FILTER ...21
COCOPEAT FILTER BASE CASE COST MODEL ...21
COCOPEAT FILTER VS A CONSTRUCTED WETLAND ...22
Assumptions ...22
Analysis...23
COCOPEAT FILTER FINANCED UNDER DIFFERENT MODELS ...25
Assumptions ...25
Analysis...26
V. DISCUSSION & CONCLUSION ...28
VI. APPENDICES ...30
v
List of Figures & Tables
Figure 1. Critical Inputs and Outputs of a Decentralized Waste Water Treatment System
Figure 2. Waste Water and Septage Flow in Urban Philippines
Table 1. RTI Cocopeat Pilot and Testing Programs
Table 2. Key Risks & Constraints for DEWATS in the Philippines
Table 3. Summary of Case Study Characteristics
Table 4. Selected DEWATS Base Case Study Models
Table 5. Cost Allocation for Selected DEWATS Implementation Models
Table 6. Ability to Address Institutional Risks by Implementation Model
Table 7. Cost Comparison of a Constructed Wetland vs. a Cocopeat Filter
Table 8. Comparison of Secondary Treatment Options for Muntinlupa Market
Table 9. Allocation of Externalities to Key Stakeholders for a Cocopeat Filter
Table 10. Cost Allocation Using the Private Participation Model
Table 11. Cost Allocation Using the NGO Model
Table 12. Cost Allocation Using the Local Government Model
vi
List of Appendices
Appendix 1. Sample Cocopeat Filter
Appendix 2. Sample Cocopeat Filter Configurations
Appendix 3. Cocopeat Filter Test Parameters Compared with Water Effluent Standards Appendix 4. Summary of Case Studies
Appendix 5. Table of Parameters for NPV Analysis
Appendix 6. NPV Analysis of Muntinlupa Market DEWATS with a Cocopeat Filter Appendix 7. NPV Analysis of Muntinlupa Market DEWATS with a Constructed Wetland Appendix 8. Integrated Economic and Financial Analysis of a Cocopeat Filter Using a Private
Participation Model
Appendix 9. Integrated Economic and Financial Analysis of a Cocopeat Filter Using a NGO Model
Appendix 10. Integrated Economic and Financial Analysis of a Cocopeat Filter Using a Local Government Model
Appendix 11. Integrated Economic and Financial Analysis of a Cocopeat Filter Using a Community Participation Model
vii
List of Acronyms
ABR Anaerobic Baffled Reactor
ADB Asian Development Bank
AUSAID Australian Agency for International Development
BCR Benefit to Cost Ratio
BNS Basic Needs Services
BOD Biochemical Oxygen Demand
BORDA Bremen Overseas Research & Development Association
CAPS Center for Advanced Philippine Studies
CBO Community Based Organization
COD Chemical Oxygen Demand
DENR Department of Environment and Natural Resources
DEWATS Decentralized Waste Water Treatment Systems
DGIS Directorate General of International Cooperation
DILG Department of the Interior and Local Government
DO Dissolved Oxygen
DOH Department of Health
DPWH Department of Public Works and Highways
EASAN East Asia Sanitation Conference
ECO-Asia Ecological Sanitation - Asia
ESI Economics of Sanitation Initiative
FAO Food and Agriculture Organization of the United Nations
FDI Foreign Direct Investment
GTZ German Technical Corporation
IRC International Resource Centre on Water Supply, Sanitation and Hygiene
ITB Institut Teknologi Bandung
JBIC Japan Bank for International Cooperation
LBP Land Bank of the Philippines
LDA Laguna Lake Development Authority
LGU Local Government Unit
LINAW Local Initiative for Affordable Waste Water
LWUA Local Water Utilities Administration
MDG Millennium Development Goal
MMDA Metro Manila Development Authority
NAWASA National Water and Sanitation Association of the Philippines
NEDA National Economic Development Authority
NH4+ Ammonia Content
NO3- Nitrate Content
NPV Net Present Value
NTKN Nitrogen Content
NWRB National Water Resources Board
O&M Operations and Maintenance
PADCO Planning and Development Collaborative International, Inc.
PCWS Philippine Center for Water and Sanitation
viii
PhilHealth Philippine Health Insurance Corporation
PPP Public-Private Partnership
RTI Research Triangle Institute
SBR Sequencing Batch Reactor
SIDA Swedish International Development Cooperation Agency
SuSEA Sustainable Sanitation for East Asia
SWAPP Solid Waste Management Association of the Philippines
TSS Total Suspended Solids
UDDT Urine Diverting Dry Toilet
UNICEF United Nations Children’s Fund
USAID United States Agency for International Development
WAND Water, Agroforestry, Nutrition and Development Foundation
WATSAN Water Sanitation
WASH Water Supply, Sanitation, and Hygiene
WHO World Health Organization
WSP Water and Sanitation Program
1
I. INTRODUCTION
POLICY QUESTION
What implementation models could Research Triangle Institute (RTI) International consider for scaling up cocopeat bio-filtration systems to improve access to safe water and sanitation in urban poor areas of the Philippines?
PROBLEM OVERVIEW
There is a great necessity for improved sanitation practices in the developing world. Forty percent of the world’s population (2.5 billion people) practice open defecation or lack adequate sanitation facilities.2 In urban areas throughout the developing world, where household and community toilets are available, 2.1 billion people use toilets connected to septic tanks that are not safely emptied or use other systems that discharge raw sewage into open drains or surface waters.3 These suboptimal sanitation practices result in a greater incidence of waterborne diseases, poor drinking water quality, and contaminated water sources. 1.8 million deaths are attributed to diarrheal diseases each year with 90% occurring in children under 5 years old in developing countries.4 It is estimated that marginal improvements in sanitation can improve diarrheal morbidity by 37.5%.5
Improved sanitation practices and infrastructure are also difficult to implement and sustain. Public services, treatment systems, and sanitation practices in the developing world often require sufficient land, capital, and energy resources that are often scarce. Low cost, sustainable
improvements and innovations, as well as local acceptance and ownership, are necessary to develop and implement alternative technologies that can help reuse waste, improve water
treatment and improve overall quality of sanitation services. Sanitation innovation is particularly crucial in urban areas and communities, where billions of people are only capturing and storing their waste in septic tanks and latrine pits, without sustainable ways to process the waste once these storage facilities are full.6
RTI International has developed an effective, waste water filter that has the potential to improve health and positively impact sanitation services for urban poor communities. Although
successful pilot programs have been launched through grant funding and self-financing, RTI
2 (Prüss-Üstün, Bos, Gore, & Bartram, 2008) 3
(Bill & Melinda Gates Foundation, 2013) 4 (World Health Organization, 2013) 5 (World Health Organization, 2013) 6 (Bill & Melinda Gates Foundation, 2013)
2
would like to explore additional partnerships and implementation models to deliver this technology to a larger audience in the Philippines.
CONTEXT AND BACKGROUND
Sanitation in the Philippines
As part of the Millennium Development Goals, commissioned by the United Nations in
September 2000, the Philippines government adopted a resolution in 20047 to target “halving by 2015, the proportion of the population without sustainable access to safe drinking water and basic sanitation.8” According to official estimates, Southeast Asian developing countries, including the Philippines, are officially on track to meet this goal; however, 29% of this
population still lacks access to improved sanitation facilities.9 Despite progress toward improved sanitation access, these estimates may be misleading since official access data only accounts for waste entering septic tanks or pit latrines. Often, these storage facilities are improperly sealed and poorly serviced resulting in waste water overflows to uncovered drainage systems, thus leaving the majority of the population across the country exposed to raw sewage.10
Because of inadequate infrastructure, investment, and services in the Philippines, contaminated drinking water and waterborne diseases continue to be a significant health concern to the public accounting for more than 500,000 morbidity and 4,200 mortality cases a year.11 Poor sanitation infrastructure and disease in the Philippines costs the economy $1.94 billion a year. 71% of these costs are for healthcare associated with 38 million cases of diarrhea per year and 31 premature deaths per day.12 The remaining economic losses are due to lost income from major industries such as fisheries and tourism. According to estimates from the World Health
Organization, for every $1 financial investment in improved sanitation solutions, the expected return in the Philippines could result in $9 to $11 of economic benefits.13
Multiple sanitation strategies and interventions have been tested and implemented with varying degrees of success toward reducing public health costs and other economic losses. These models have included community-based solutions, government funded models, non-governmental aid models, and hybrid partnership models. Often, these strategies are implemented at a high financial cost, lack widespread distribution, and/or lack acceptance and buy-in. Many of these
7
(National Statistical Coordination Board, 2004) 8 (United Nations, 2013, p. 46)
9 (United Nations, 2013, p. 48) 10
(The World Bank Group, 2005, p. xviii) 11 (The World Bank Group, 2005, p. xviii) 12 (Rodriquez, Jamora, & Hutton, 2008) 13 (Hutton, Haller, & Bartram, 2007)
3
strategies also only focus on sanitation storage rather than waste water treatment. Future sanitation interventions will require a more sustainable approach with a reliance on low cost, locally available resources.14
Cocopeat Filter Research
Since 2011, researchers at RTI International have developed and tested a secondary waste water treatment filter that can be appended to existing decentralized sanitation systems and collection facilities. Using a small plastic or wooden box and the proper loading of cocopeat, the discarded dust and coir generated from coconut processing plants, an effective bio-filter unit can be
constructed. This simple device can easily be connected to existing septic tanks or other primary treatment components to filter effluent waste water and meet national discharge standards.15 Depending on the site configurations and soil conditions, the effluent waste water from a cocopeat filter can be directly discharged into a common drainage system or reused for plant irrigation.16 Each filter unit can be configured to meet the needs of a single household or scaled up for a small community.17 Appendix A and B show example filters and potential filter
configurations for various inputs and site conditions.
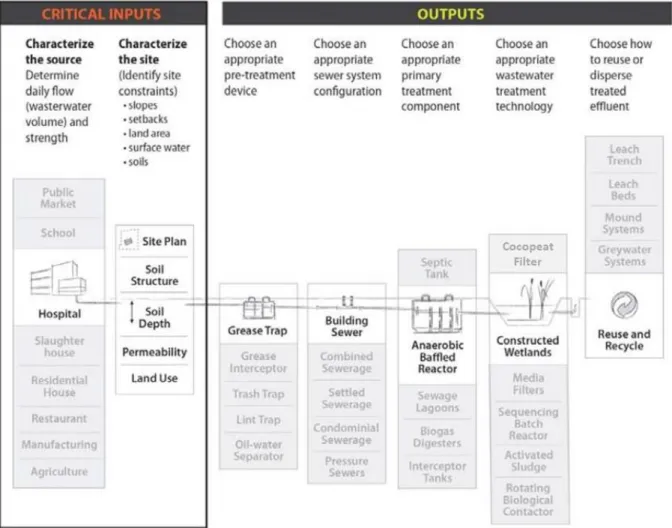
Figure 1 details the critical inputs for choosing appropriate DEWATS technology and a range of possible system configurations. With an adaptive approach to waste water treatments, a variety of different configurations could be implemented. Cocopeat filters are considered secondary treatment technology and used following treatment from a primary treatment mechanism (e.g., septic tanks, anaerobic baffled reactors, sewage lagoons, etc.). Due to low cost technology and minimal space constraints cocopeat filters have the potential to be used in lieu of a variety of other comparable secondary treatment mechanisms (e.g., constructed wastelands, alternative media filters, etc.).
14 (Bill & Melinda Gates Foundation, 2013) 15
(RTI International, 2012)
16 (Robbins D. , Interview with Dave Robbins on Using Coco Peat to Develop Low-Cost Waste Water Treatment, 2012)
4
Figure 1: Critical Inputs and Outputs of a Decentralized Waste Water Treatment System18
Source: Adapted from Developing Guidance Policies for the Management of Decentralized Waste Water Treatment Systems (DEWATS) by Local Governments, D. Robbins 2012.
Current Cocopeat Filter Collaborations
RTI conducted laboratory testing at Can Tho University in Vietnam and Duke University in North Carolina to test various aspects of the filtration technology. Test results of effluent sample filter water showed 90% reductions in organic matter, suspended solids, and pathogenic
bacteria19 and met discharge standards in accordance with the Philippine Clean Water Act of 200420 and the Revised Effluent Regulations of 199021. Appendix D compares filter test results with regulatory standards.
18 (Robbins D. , Developing Guidance Policies for the Management of Decentralized Wastewater Treatment Systems (DEWATS) by Local Governments, 2011).
19 (RTI International, Can Tho University, 2012) 20 (Congress of the Philippines, 2004)
5 Table 1: RTI Cocopeat Pilot and Testing Programs
Location Description
Target
Users Partners
Philippines RTI and Habitat for Humanity collaborated to incorporate cocopeat filters into septic tanks designs for low income residential housing
developments in Oriental Mindoro.22
Urban Poor Communities
Habitat for Humanity RTI International
Philippines The cocopeat system installed at Putatan Elementary School serves over 2,000 users. Pour-flush toilets discharge to a septic tank equipped with a small pump that feeds effluent to the cocopeat bio-filter. 23
Schools Putatan Elementary
School
RTI International Gates Foundation
Philippines The Muntinlupa Public Market waste water project coupled a cocopeat filter with a traditional sewage treatment system to treat from human, animal, and food waste water and meet local
discharge standards.24 Public Market RTI International USAID Muntinlupa City LINAW ECO-Asia
Indonesia Institut Teknologi Bandung is testing
cocopeat filter technology to study configurations for single family homes in flood prone areas.25
Single Family Households Institut Teknologi Bandung (ITB) Gates Foundation
USA Cocopeat filter media was laboratory
tested at Duke University under different loading scenarios and compared with sphagnum peat, an effective bio-filtration medium.26
Research RTI International
Duke University Gates Foundation
Vietnam Can Tho University tested cocopeat
filters to demonstrate how the
technology might be incorporated into waste water systems for rural farmers.27
Rural Farmers
Can Tho University RTI International Gates Foundation Bangladesh A pilot project was implemented in
Kushtia, Bangladesh to treat fecal sludge and solid waste together using a fecal drying bed, compost plant, and a cocopeat filter.28 Urban Poor Communities Kushtia Municipality UNESCAP 22 (Doczi, 2012)
23 (Robbins D. , Addressing Site Constraints through Cocopeat System Design, 2012) 24 (Santos Jr. & Robbins, 2011)
25
(Robbins & Richkus, 2012) 26 (Robbins & Richkus, 2012) 27 (Robbins & Richkus, 2012) 28 (Enayetullah & Sinha , 2013)
6
In addition to laboratory testing, pilot programs were established in Indonesia, Philippines, Bangladesh, and Vietnam due to the high production of coconuts in these countries.29 Pilot filter programs were launched in schools, public markets, communities, and other locations to test usability features of the filter, configurations, and potential partnership options. Thus far, RTI has implemented these pilot programs primarily through self-financing and a grant funded by the Bill & Melinda Gates Foundation. Table 1 provides a summary of these pilot projects and partners.
Benefits of Cocopeat Filter Technology
From both laboratory and pilot testing, cocopeat filter technology has shown the following advantages:
Low cost: On average, each filter costs less than 2 cents per user per day to build and maintain30, which is considerably less than the 5 cents per day goal set by the Bill & Melinda Gates Foundation’s Sanitation and Hygiene initiative.31
Cocopeat filters, on average, require 70% of the capital and maintenance costs of a constructed wetland.32 Effectiveness: Testing showed that these filters have a 90% removal rate of harmful
matter and bacteria thus producing effluent water suitable for discharge in accordance with national standards.33
Sustainability: Cocopeat is a locally renewable resource in coconut rich countries. When cocopeat media life has been expended, it can safely be used as a nutrient rich fertilizer.34 Low Land Resource Requirements: Cocopeat filtration efficiency is comparable to
constructed wetlands and sewage lagoons; however, cocopeat filters require 60% less land and are 90% faster to build.35
Longevity: Cocopeat filters have a potential life expectancy of up to 8 years with an expected usable life of 3 years before requiring media replacement. 36
29 (United Nations Conference on Trade and Development, 2012) 30 (Robbins & Richkus, 2012, p. 7)
31
(Bill & Melinda Gates Foundation, 2013) 32 (RTI International, 2012, p. 25)
33 (RTI International, Can Tho University, 2012) 34
(Robbins D. , Interview with Dave Robbins on Using Coco Peat to Develop Low-Cost Waste Water Treatment, 2012)
35 (RTI International, 2012, p. 25) 36 (Sherman, 2006)
7
II. DECENTRALIZED WASTE WATER TREATMENT IN THE PHILIPPINES
SANITATION SECTOR OVERVIEW
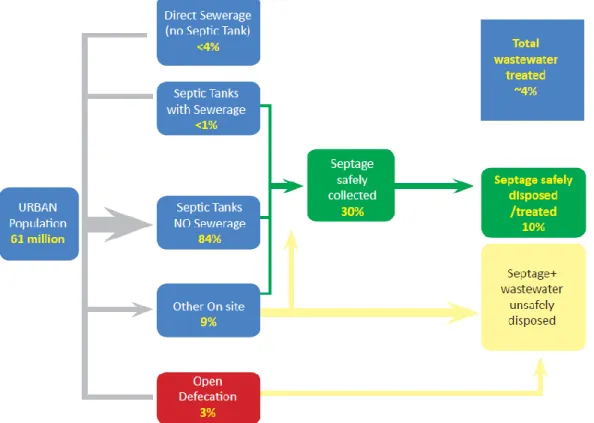
In urban areas throughout the Philippines, there is high access to sanitation services but low access to waste water treatment. Over 95% of the urban population has access to sewerage, septic tanks, or other on site collection facilities; however, less than 14% of total urban sewage is being safely treated.37 Figure 2 details the current state of waste water collection and treatment in the Philippines.
Figure 2: Waste Water and Septage Flow in Urban Philippines38
Source: East Asia and the Pacific Region Urban Sanitation Review, World Bank 2012.
Several regulatory, technological, cultural, and economic factors frame the institutional landscape for the sanitation sector in the Philippines. These factors have both enhanced and hindered the implementation of DEWATS projects throughout the Philippines. Through both a literature review of the Philippines sanitation sector and a DEWATS case study analysis, I assessed the most significant institutional factors related to implementing DEWATS projects.
37 (Kearton, et al., 2013) 38 (Kearton, et al., 2013)
8 Legislation & Policy
The sanitation subsector is guided by several laws and regulations that govern effluent discharge standards, sanitation policies, and agencies responsible for carrying out these laws. As they pertain to DEWATS, these include the following notable legislation:
Provincial Water Utilities Act of 197339
This act established local Water Districts as the prime authorities responsible for providing and maintaining urban water supply and sanitation outside of Metro Manila.
Revised Effluent Regulations of 199040
This law established national effluent discharge standards for sanitation systems.
Local Government Code of 199141
This code divided the local Philippines government into three administrative levels of local government units (LGUs): provinces, municipalities, and barangays42. LGUs are charged with the authority to establish local sanitation regulations and enforcement mechanisms to support national standards.
Clean Water Act of 200443
This act established regulations prohibiting the dumping of untreated waste water into the ground and bodies of water. The act calls for all waste water pollution to be discharged via a sewer system or
DEWATS. This law also mandates that LGUs share in the
management and improvement of water quality standards within their jurisdiction. Government Agencies Department of Environment and Natural Resources (DENR)44
DENR is responsible for defining and regulating effluent discharge standards for waste water. Regional offices provide assistance and technical support to LGUS, Water Districts, and other stakeholders to develop action plans in support of the Clean Water Act.
39 (Government of the Philippines, 2012) 40 (Government of the Philippines, 1990)
41 (Department of Interior and Local Government, 2010)
42
The barangay is the lowest level of government administration in the Philippines. The barangay can be considered close to the equivalent of a “village,” “district,” or “ward.”
43 (Congress of the Philippines, 2004)
9 Department of Interior
and Local Government
(DILG)45
DILG defines policies, and performance standards for LGU capacity building programs. DILG also assists LGUs in preparing action plans, accessing finance, and facilitating sanitation project plans.
Department of Public Works and Highways
(DPWH)46
DPWH helps to set long term goals for sanitation spending, program objectives, and provision of septage services. DPWH is the lead authority for developing the National Sewerage & Septage Management Plan (NSSMP) with national targets for pollution reduction, service provision, and access to sanitation by 2020. Local Government
Units (LGUs)47
These government units are organized from the city level to the community (barangay) level to administer sanitation management, provide services and enforce policies for residents. LGUs are
responsible for financing, planning, and regulating water and sanitation services.
Local Water Utilities Administration
(LWUA)48
LWUA is a specialized lending institution that provides financial and technical assistance for the development, administration, and regulation of local Water Districts in partnership with LGUS.
National Economic Development
Authority (NEDA)49
NEDA is the key agency for policy formulation, coordination, and planning for the sanitation sector. Responsibility for monitoring and evaluation of national septage management programs also resides with NEDA.
National Water and Sanitation Association of the Philippines
(NAWASA)50
NAWASA is an organization of small scale private service sanitation operators with the intent of collaborating on best practices to improve service delivery and promote community involvement.
Philippine Center for Water and Sanitation
(PCWS)51
PCWS serves as a research organization and provides technical services to local governments for implementing low cost water and sanitation systems within communities.
45
(Department of Interior and Local Government, 2010) 46 (Department of Public Works and Highways, 2014) 47 (Department of Interior and Local Government, 2010) 48
(Local Water Utilities Administration, 2011)
49 (Republic of The Philippines National Economic and Development Authority, 2013) 50 (Philippine Water Partnership, 2010)
10
Water Districts52 Water Districts serve as a separate legal entity from LGUs with the
authority to regulate water supply and sanitation services. Non-Governmental Organizations
Asian Development
Bank (ADB)53
ABD provides loan financing, grant financing, and technical assistance for DEWATS projects. ADB also partners with LGUs and other external agencies to provide institutional strengthening to meet sanitation infrastructure needs.
Bremen Overseas Research and Development Association
(BORDA)54
BORDA assists in developing sustainable sanitation solutions through partnerships with LGUs and other supporting agencies to deliver quality standards, implementation measurement, research, technical assistance, and training for DEWATS projects.
German Technical Cooperation Agency (GTZ)55
GTZ provides technical assistance, training, and infrastructure
development in areas lacking access to improved sanitation. GTZ aids LGUs to improve policies and governance around sanitation and introduce low cost sanitation options.
Philippine Center for Water and Sanitation
(PCWS)56
PCWS serves as a research organization and provides technical services to local governments for implementing low cost water and sanitation systems within communities.
USAID57 USAID provides technical assistance of DEWATs projects and
promotes social marketing programs to educate and train community members in the health benefits of improved sanitation. USAID
contributes both loan and grant financing to support LGUs in attaining Millennium Development Goals. USAID partnered with multiple stakeholders, government agencies, and external agencies for a four year project to help implement the Clean Water Act.
52 (Government of the Philippines, 2012) 53 (Asian Development Bank, 2013) 54
(Bremen Overseas Research and Development Association, 2014) 55 (Asian Development Bank, 2013)
56 (Philippine Center for Water and Sanitation, 2014) 57 (AECOM, 2014)
11
World Bank58 World Bank supports localized sanitation infrastructure projects
through direct engagement with LGUs community-based organizations, and the private sector. Several DEWATs projects have been
implemented with technical assistance support, loan financing, and grant financing from the World Bank.
Technology Factors
The primary storage and treatment technology used is the septic tank. 84% of households in urban areas discharge waste water to a septic tank.59 Despite this relatively high access to sanitation, the design, construction, and maintenance of these septic tanks remains suboptimal. Septic tanks are often inaccessible and/or improperly maintained resulting in overflows to open drainage systems rather than via a secondary treatment facility (e.g., constructed wetland, media filter, etc.).
Secondary treatment systems have become more prevalent in recent years as health standards and improved low cost technology have emerged. The most common secondary treatment systems include constructed wetlands, reed beds, anaerobic baffled reactors, rotating biological contactors, activated sludge, and other filtration media. These technologies allow for aerobic and anaerobic digestion of harmful waste water components prior to effluent discharge to the ground or surrounding bodies of water.
DEWATS have been successful alternatives to city wide sewerage systems in urban areas due to low cost designs, high efficiency, and adaptable configurations based on individual site
requirements. Sanitation technology improvements and DEWATS innovations have been spurred by external organizations such as the Bill & Melinda Gates Foundation’s Sanitation and Hygiene initiative campaign with the goal of providing low cost, simple waste water treatment, collection, and reuse technology at the cost of less than 5 cents per user per day.
Social, Cultural & Economic Factors
Significant pressure has been placed on creating sustainable infrastructure due to the rapid population growth and urbanization within the Philippines. Between 2000 and 2010, the population increased by 1.9% per year, on average, with most growth in urban areas.60
Population in urban areas is projected to grow even more rapidly, by as much as 67%, between 2010 and 2030. Urban expansion and job opportunities have fueled the Philippine economy,
58 (Asian Development Bank, 2013) 59 (Asian Development Bank, 2013) 60 (Asian Development Bank, 2013)
12
growing 4.64% per year between 2007 and 2011.61 Despite rapid economic and population
growth, there remains a disparity in sanitation services and infrastructure investments between urban poor communities and middle income communities.
Sanitation spending has been a low priority for both local governments and residents in the Philippines. On average, only 3% of total spending allocated to water and sanitation is spent on sanitation improvement. The majority of the total funding is directed toward improving water supply sources and infrastructure. Local governments, therefore, receive relatively few subsidies to improve sanitation infrastructure.
There is poor education about the health benefits associated with improved sanitation infrastructure. Thus, there is a lower consumer willingness to pay for improved sanitation technology. Many stakeholders associate having a septic tank with adequate sanitation and thus are not proactive about paying for desludging services or demanding improved treatment
systems. LGUs acknowledge the importance of sanitation education, but given the low fiscal priority attention to sanitation is often limited. When education is led by LGUs, training is generally limited to basic health education about the relationship between clean water, sanitation awareness and proper hygiene practices.62
NGOs have been instrumental partners in filling this education gap through sanitation marketing programs. In addition to basic sanitation education, sanitation marketing programs aim to enhance community involvement and demand for improved sanitation systems. These programs include stakeholders throughout the community to determine the specific sanitation
requirements, select appropriate DEWATS configurations, meet financial constraints, and encourage social acceptance of new technologies. Through a strategic marketing mix, social campaigns, and key community partnerships, these programs have enhanced DEWATS projects, increased consumer willingness to pay, and reduced project costs through higher community participation.63
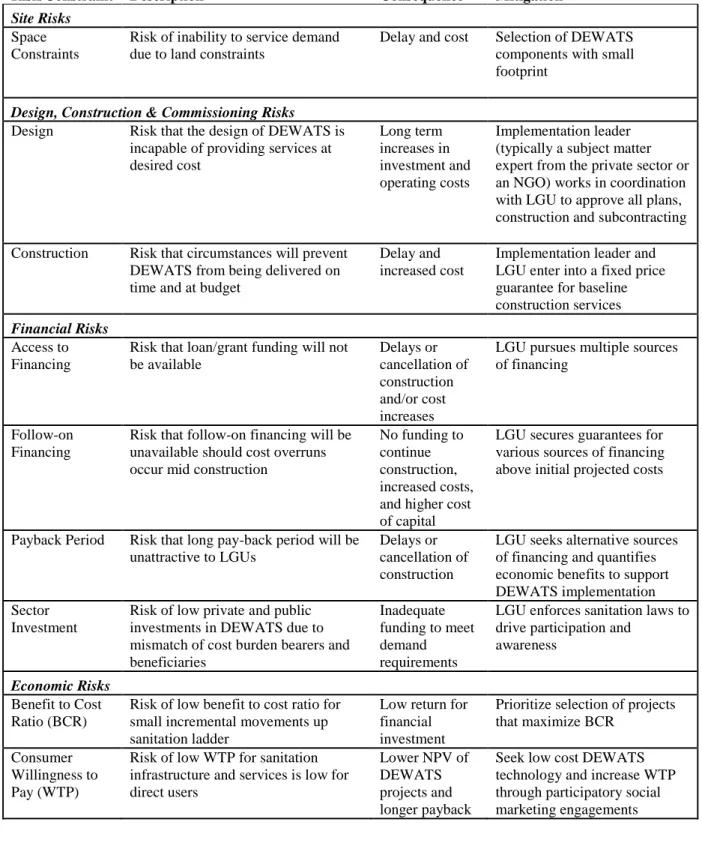
Key Risks & Constraints
Given the current sanitation sector landscape, there are significant institutional risks and constraints related to implementing successful DEWATS projects. These risks and constraints are detailed in Table 2.
61 (Asian Development Bank, 2013) 62 (Water and Santiation Program, 2011) 63 (Sustainable Sanitation Alliance, 2010)
13
Table 2: Key Risks & Constraints for DEWATS in the Philippines
Risk/Constraint Description Consequence Mitigation
Site Risks Space Constraints
Risk of inability to service demand due to land constraints
Delay and cost Selection of DEWATS components with small footprint
Design, Construction & Commissioning Risks
Design Risk that the design of DEWATS is incapable of providing services at desired cost Long term increases in investment and operating costs Implementation leader (typically a subject matter expert from the private sector or an NGO) works in coordination with LGU to approve all plans, construction and subcontracting Construction Risk that circumstances will prevent
DEWATS from being delivered on time and at budget
Delay and increased cost
Implementation leader and LGU enter into a fixed price guarantee for baseline construction services Financial Risks
Access to Financing
Risk that loan/grant funding will not be available Delays or cancellation of construction and/or cost increases
LGU pursues multiple sources of financing
Follow-on Financing
Risk that follow-on financing will be unavailable should cost overruns occur mid construction
No funding to continue construction, increased costs, and higher cost of capital
LGU secures guarantees for various sources of financing above initial projected costs
Payback Period Risk that long pay-back period will be unattractive to LGUs
Delays or cancellation of construction
LGU seeks alternative sources of financing and quantifies economic benefits to support DEWATS implementation Sector
Investment
Risk of low private and public investments in DEWATS due to mismatch of cost burden bearers and beneficiaries
Inadequate funding to meet demand requirements
LGU enforces sanitation laws to drive participation and
awareness Economic Risks
Benefit to Cost Ratio (BCR)
Risk of low benefit to cost ratio for small incremental movements up sanitation ladder
Low return for financial investment
Prioritize selection of projects that maximize BCR
Consumer Willingness to Pay (WTP)
Risk of low WTP for sanitation infrastructure and services is low for direct users
Lower NPV of DEWATS projects and longer payback
Seek low cost DEWATS technology and increase WTP through participatory social marketing engagements
14
Risk/Constraint Description Consequence Mitigation
Operating Risks
Inputs Risk that required inputs and costs will be greater than anticipated
Lower benefit to cost ratio
Source long term supply contracts to manage costs Demand Risk that users will not use DEWATS Lower benefit
to cost ratio
LGU and NGOs use marketing and promotional strategies to enhance demand
Operating & Maintenance
Risk that design and construction quality is
inadequate resulting in higher than anticipated maintenance and refurbishment cost
Higher maintenance costs
Implementing agency establishes and enforces a routine maintenance plan to maintain system integrity Environmental Risks
Sanitation Access & Coverage
Risk that inconsistent DEWATS within a LGU or in adjacent LGU will be suboptimal and not address site and input constraints Lower benefit to cost ratio, increased construction costs
LGUs and implementing agencies adequately assess sites and inputs to deliver optimal DEWATS
Discharges to Ground & Water Sources
Risk that sanitation system will not properly collect and treat harmful waste water
Lower benefit to cost ratio
LGU and NGOs use marketing and promotional strategies to enhance demand for improved sanitation
Cultural Risks
Education Risk that poor education about sanitation benefits will lead to non-use or improper maintenance
Non-use of system and health consequences
LGU and NGOs use marketing and promotional strategies to enhance demand for improved sanitation
Legislative & Government Policy Risks Priority for
Sanitation Services
Risk that Sanitation Infrastructure investments will be displaced by competing infrastructure needs
Project delays, inadequate coverage
Partner with additional funding agencies to seek additional financing
Policy Enforcement
Risk that Government will not implement fee collection or enforce sanitation regulations
Lower NPV, poor quality control
Partner with external agency for capacity building and project finance structuring
Technical Expertise
Risk that implementing authority does not hold technical expertise and authority for a successful project
Delay and/or low quality implementation
Partner with NGO or supporting agency with domain knowledge Delineation of
Responsibilities
Risk that overlapping responsibilities and weak sector planning fosters delays and inefficiencies in DEWATS implementation
Delays in implementation, poor
governance
LGU and other partners need to clearly define roles and responsibilities at project onset. Policy Changes Risk that changes in sanitation policies
may shift authority for sanitation financing and administration to other governing units
Delays in implementation, financing restrictions
Seek additional sources of financing from external supporting agencies
15
III. CASE STUDY ANALYSIS OF DEWATS FINANCING MODELS
DATA & METHODOLOGY
Scope of Analysis & Search Criteria
Several sanitation interventions have been implemented throughout the Philippines across multiple demographics and environments. I sought out case studies that specifically focused on DEWATS interventions with outcomes related to improvement of effluent waste water
parameters such as Biological Oxygen Demand (BOD), Total Suspended Solids (TSS), and Fecal Coliform levels.
I performed a broad search of multiple economic, sanitation, and international development journals for relevant studies. I also searched through working papers from multiple research institutes, universities, and international governance organizations. My primary aim was to find studies that had well documented costs, well documented results, and implementation lessons learned. From my search, I identified over 100 potentially relevant studies using Boolean
searches of the following key terms: Water Sanitation, Health Impact, Philippines, DEWATS,
Waste Treatment System, Water, Sanitation, Sewage, Costs, Impact, and Case Study.
Studies were rejected if they did not meet the following criteria:
Project was completed in the last 15 years
Economic benefit to cost ratio >1
Project was completed in an urban setting
Intervention related to a decentralized waste water treatment system
Project was completed in the Philippines
Intervention included secondary waste water treatment components
Project included well documented costs, beneficiaries, and lessons learned Summary of Studies
A total of 28 case studies met the inclusion criteria and are included in Appendix 4. These case studies were published between 2007 and 2013 with projects completed from 2005 to 2012. Studies focused on DEWATS systems implemented for communities of households,
slaughterhouses, schools, universities, public markets, public buildings, and one jail. Each case study is characterized by the chief stakeholder responsible for leading the project
implementation; 1) Private Participation, 2) Local Government, 3) NGO and 4) Community Participation. In all of the selected cases, some combination of partnership between the public
16
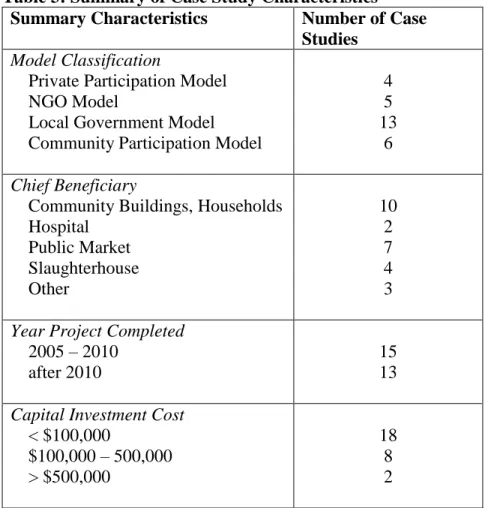
sector, private sector, and NGOs was employed to implement successful projects. Although the intervention methods vary across all of the studies, the expected overall economic impact is positive for each case. For each case, health and economic impacts are not directly measured. As a proxy for health and economic impacts, improved water quality outputs and the number of direct beneficiaries serve as indicators for successful implementations. A summary of the 28 case studies examined in this analysis is detailed in Table 3.
Table 3: Summary of Case Study Characteristics
Summary Characteristics Number of Case
Studies
Model Classification
Private Participation Model NGO Model
Local Government Model Community Participation Model
4 5 13
6
Chief Beneficiary
Community Buildings, Households Hospital Public Market Slaughterhouse Other 10 2 7 4 3
Year Project Completed
2005 – 2010 after 2010
15 13
Capital Investment Cost
< $100,000 $100,000 – 500,000 > $500,000 18 8 2
COMPARATIVE CASE STUDY ANALYSIS
From the studies that met the inclusion criteria, I selected 4 case studies that were the most representative models of DEWATS implementation and financing approaches. These 4 cases highlight typical financial risk distribution and burden among the key stakeholders for each approach; private participation model, local government model, NGO model, and community participation. These cost distributions are used as base cases to highlight possible financing structures for a cocopeat filter DEWATS project in the next section. Table 4 details the 4 case studies used as base case financing structures.
17 Table 4: Selected DEWATS Base Case Study Models
Case Study Location Approach
Chief Beneficiaries
Chief Risk Partner
Preserving Water Quality for Iloilo City Mission Hospital64
Iloilo City Private Participation Hospital Staff and Patients Iloilo Mission Hospital Implementing a Septage Treatment Plant in Dumaguete City65 Dumaguete City Community Participation Community Households Community Residents
Constructed Wetland for a Peri-urban Housing Area66 Bayawan City Local Government Community
Households City of Bayawan
Decentralized Waste Water Treatment Facility for the Lilo-an Public Market67 Lilo-an NGO Public Market Vendors and Users Asian Development Bank
Private Participation Model
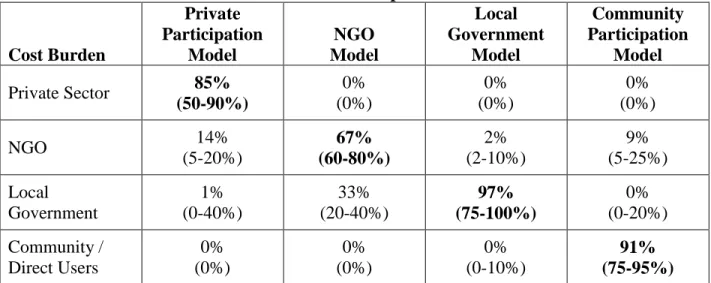
In this approach, a private entity such as a school, university, jail, or hospital finances the DEWATS project. The impetus for commencing the project is usually driven by regulatory pressure to meet effluent discharge standards. Among the case studies using this approach, capital investments financed by the private sector ranged from 50% to 90% with the median at 85% for the selected case study. In all case studies, the private sector contributed 100% toward ongoing operations and maintenance costs. While the private entity is the main implementing and financing stakeholder, there is often collaboration with the LGU to assist with meeting regulatory requirements. NGOs are consulted for technical assistance, construction, and implementation of training programs. In some cases, LGUs have partnered with the private sector to drive awareness for improved sanitation and replicate successful private sector projects with other local businesses.
NGO Model
In this approach, a non-governmental organization is the primary financing partner for a particular DEWATS project. Among the case studies using this approach, capital investments financed by NGOs ranged from 60% to 80% with the median at 67% for the selected case study.
64
(PADCO, 2006) 65 (PADCO, 2006)
66 (Sustainable Sanitation Alliance, 2010) 67 (König, 2006)
18
In most cases, routine maintenance and ongoing costs are passed on to the local government at project completion. Implementation efforts are usually carried out very closely with the LGU to build capacity and conduct system training. An NGO is typically also included in these projects to conduct technical assessments and determine the most appropriate DEWATS design based on input and site configurations.
Local Government Model
In this approach, the LGU or Water District is the primary financing partner for a particular DEWATS project. Among the case studies using this approach, capital investments financed by LGUs ranged from 75% to 100% with the median at 97% for the selected case study. In all case studies, the LGU contributed 100% toward ongoing operations and maintenance costs. In most cases, the LGU either contracted technical assistance and construction from local providers or sought assistance from NGOs for site design and implementation guidance. Initial project costs were most often financed through the LGU coffers, loan financing, and subsidies. Ongoing maintenance costs and loan repayments are often passed onto community residents as a fixed user fee or as a percentage of their water supply fee.
Community Participation Model
In this approach, community residents are the main implementing and financing partners for sanitation projects. NGOs are typically the driving impetus for spurring action within communities by creating forums and social awareness programs about improved sanitation benefits. Among the case studies using this approach, capital investments financed via
community participation ranged from 75% to 95% with the median at 91% for the selected case study. Community stakeholders are given training to make informed decisions regarding
appropriate DEWATS technology and appropriate financing programs. Community stakeholders are direct participants in the consulting, decision making, financing, construction, and
maintenance of DEWATS projects. LGUs are typically responsible for collecting user fees and dispersing funds for capital and operations & maintenance expenses.
19
Table 5: Cost Allocation for Selected DEWATS Implementation Models
Cost Burden Private Participation Model NGO Model Local Government Model Community Participation Model Private Sector 85% (50-90%) 0% (0%) 0% (0%) 0% (0%) NGO 14% (5-20%) 67% (60-80%) 2% (2-10%) 9% (5-25%) Local Government 1% (0-40%) 33% (20-40%) 97% (75-100%) 0% (0-20%) Community / Direct Users 0% (0%) 0% (0%) 0% (0-10%) 91% (75-95%)
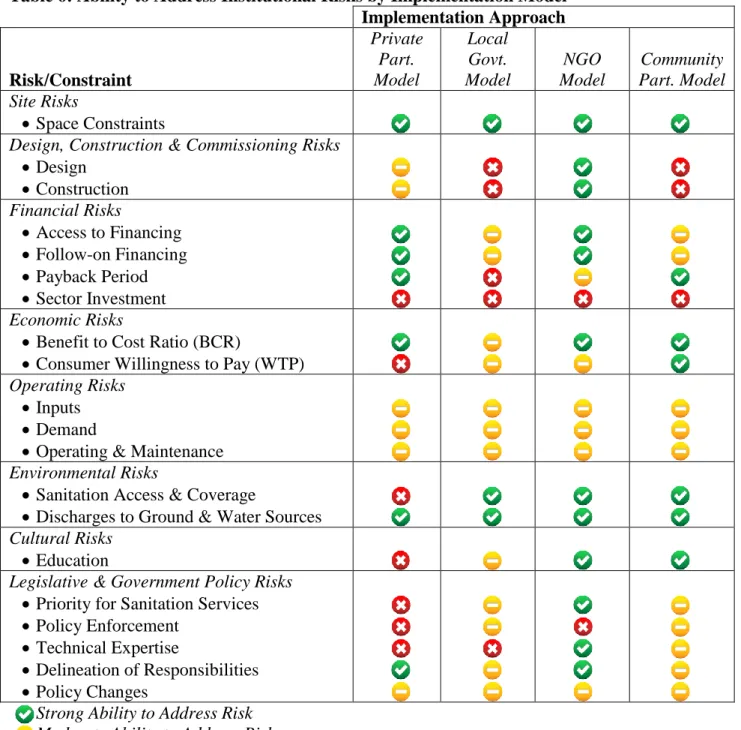
Comparison of Model Risks and Benefits
Each DEWATS model faces risks to implementation within the current Philippines operating environment. Given the risk factors identified in the landscape analysis and a study of lessons learned from the selected cases, a qualitative analysis of each approach is examined in Table 6 to compare the relative strengths and weaknesses of each implementation model.
20
Table 6: Ability to Address Institutional Risks by Implementation Model Implementation Approach Risk/Constraint Private Part. Model Local Govt. Model NGO Model Community Part. Model Site Risks Space Constraints
Design, Construction & Commissioning Risks
Design Construction Financial Risks Access to Financing Follow-on Financing Payback Period Sector Investment Economic Risks
Benefit to Cost Ratio (BCR)
Consumer Willingness to Pay (WTP)
Operating Risks
Inputs
Demand
Operating & Maintenance
Environmental Risks
Sanitation Access & Coverage
Discharges to Ground & Water Sources
Cultural Risks
Education
Legislative & Government Policy Risks
Priority for Sanitation Services
Policy Enforcement
Technical Expertise
Delineation of Responsibilities
Policy Changes
Strong Ability to Address Risk Moderate Ability to Address Risk Weak Ability to Address Risk
21
IV. ANALYSIS OF FINANCING MODELS FOR A COCOPEAT FILTER
COCOPEAT FILTER BASE CASE COST MODEL
In 2006, a DEWATS system was implemented for the Muntinlupa Public Market to collect and treat waste water containing organic material, suspended solids, fats, oils, grease, and excreta. Prior to system implementation, untreated waste water flowed directly from the market to rivers and lakes that are primary drinking water supply sources for Metro Manila. While the City of Muntinlupa was the main financing and implementation partner, USAID, the Muntinlupa Market Vendors Association, and other supporting agencies were integral to project success.68
This case study is significant because a cocopeat filter was used in the final selected DEWATS design allowing for a detailed breakdown of costs. A constructed wetland was also considered as a secondary waste water treatment option but a cocopeat filter was selected for due to space constraints, lower capital costs, and lower O&M costs.
I selected this case study to serve as a base case to compare a DEWATS implementation using a cocopeat filter and a constructed wetland (a comparable secondary treatment option in terms of waste water treatment efficiency). Additionally, this case is used to evaluate cost distributions under the 4 implementation models. A table of parameters and the base case financial cost analysis are detailed in Appendix 5 and 6.
Economic impacts of improved sanitation are estimated for health costs averted, productivity costs averted, mortality costs averted, water access cost savings, water reuse savings, water treatment cost savings, excreta reuse, and access time. These parameters are estimated based on a recent study by the World Bank assessing the economic benefits from improved sanitation services in urban settings using DEWATS.69 These key economic benefits are characterized below:
Health Cost Savings – the costs include the pain and burden due to illnesses associated
with poor sanitation. On average, these annual costs are estimated to be $34.90 per direct beneficiary.
Productivity Cost Savings – these costs include individual or household income losses from illnesses attributable to poor sanitation. On average, these annual costs are estimated to be $24.62 per direct beneficiary.
68 (Sacendoncillo & de Pano, 2007) 69 (Water and Santiation Program, 2011)
22
Water Access Cost Savings – these costs include the time required for individuals to seek out and transport clean water supply sources. On average, these annual costs are
estimated to be $8.06 per direct beneficiary.
Water Reuse Savings – these costs include the water savings due to repurposing treated
effluent water rather than discharging to ground sources. The annual costs vary depending on the treatment system.
Water Treatment Cost Savings – these costs include the time and resources required for
individuals to treat polluted water and make it safe for consumption. On average, these annual costs are estimated to be $1.70 per direct beneficiary.
Excreta Reuse – this includes the benefits associated with using urine and human excreta
as fertilizer following treatment. On average, these annual benefits are estimated to be $11.02 per direct beneficiary.
Access Time Savings – these costs include the travel and waiting time necessary for individuals to defecate in communities without toilets or improved sanitation systems. On average, these annual costs are estimated to be $34.00 per direct beneficiary. COCOPEAT FILTER VS A CONSTRUCTED WETLAND
A cocopeat filter is able to filter waste water with the same efficiency as a constructed wetland at a fraction of the cost and space requirements. Using data from the Muntinlupa Market case study, I conducted a quantitative net present value (NPV) analysis to assess the financial cost difference and value for each technology.
Assumptions
The Muntinlupa Market case study details many of the financial parameters necessary for a comprehensive NPV model; however, some assumptions were required to complete this analysis. Specifically, the following assumptions are built into this model:
The construction cost of a cocopeat filter is approximately 70% of cost of a constructed wetland70.
A cocopeat filter occupies one tenth of the land required for a constructed wetland71.
23
No additional land costs are required using the cocopeat filter configuration.
Economic benefits are approximately the same for a system using either a cocopeat filter or a constructed wetland with the exception of additional water reuse savings associated with cocopeat filter.
Economic benefits are based on the number of direct users (1448 market stall users).
Stall user fees are maintained constant at $0.11 per stall per month in each model. Analysis
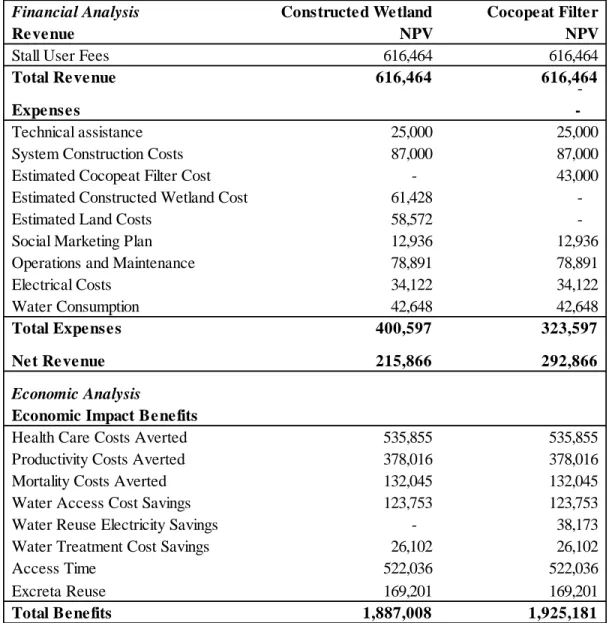
A financial and economic analysis of the benefits and costs of the DEWATS project for both a cocopeat filter and a constructed wetland is detailed in Table 7. These figures are based on 2006 pro-forma financial projections detailed in the Muntinlupa Market case study and an economic study conducted by the World Bank. From these initial figures, reasonable assumptions are included to project the financial and economic impact over a 20 year lifespan.
The financial analysis reveals a positive net present value (including stall user fees) of $216K for the constructed wetland system and $293K for the cocopeat filter system. The additional
economic benefits also support a positive overall impact on the local economy with a NPV of $1,887K for the constructed wetland and $1,925K for the cocopeat filter. Appendices 7 and 8 give a detailed year by analysis for each scenario.
Using a cocopeat filter in lieu of a constructed wetland is supported in terms of time savings, economic return, space constraints, and construction time. Table 8 details a comparison of a constructed wetland vs. a cocopeat filter.
71 (Sacendoncillo & de Pano, 2007)
24
Table 7: Cost Comparison of a Constructed Wetland vs. a Cocopeat Filter
Financial Analysis Constructed Wetland Cocopeat Filter
Revenue NPV NPV
Stall User Fees 616,464 616,464
Total Revenue 616,464 616,464
Expenses
-Technical assistance 25,000 25,000
System Construction Costs 87,000 87,000
Estimated Cocopeat Filter Cost - 43,000 Estimated Constructed Wetland Cost 61,428
-Estimated Land Costs 58,572
-Social Marketing Plan 12,936 12,936
Operations and Maintenance 78,891 78,891
Electrical Costs 34,122 34,122
Water Consumption 42,648 42,648
Total Expenses 400,597 323,597
Net Revenue 215,866 292,866
Economic Analysis
Economic Impact Benefits
Health Care Costs Averted 535,855 535,855
Productivity Costs Averted 378,016 378,016
Mortality Costs Averted 132,045 132,045
Water Access Cost Savings 123,753 123,753
Water Reuse Electricity Savings - 38,173
Water Treatment Cost Savings 26,102 26,102
Access Time 522,036 522,036
Excreta Reuse 169,201 169,201
25
Table 8: Comparison of Secondary Treatment Options for Muntinlupa Market
Cocopeat Filter Constructed Wetland
Construction Costs $43,000 $61,000
Incremental Land Cost - $59,000
Operation & Maintenance Costs $175 $175
Land Requirement 150 m3 1,500 m3
Benefit to Cost Ratio (BCR) 5.8 4.7
Time to Recoup Investment Costs 3.5 years 6 years
User Fee Required to Recoup
Investment Costs in 3.5 Years $0.11 per stall per month $0.17 per stall per month
Estimated Economic Benefits (NPV) $1,887,000 $1,887,000
Estimated Time to Build 2-4 weeks 8-12 weeks
COCOPEAT FILTER FINANCED UNDER DIFFERENT MODELS
Using the base case financial costs from the base case Muntinlupa Market case study, I created cost distribution models to analyze the costs under the various implementation models.
Assumptions
To ensure comparability among the 4 implementation models, I made the additional following assumptions:
Total economic benefits to the end users are held constant ($1.9M) for each model with
constant distribution of externalities across key stakeholder. Table 9 details these economic benefit allocations.
26
Table 9: Allocation of Externalities to Key Stakeholders for a Cocopeat Filter
Analysis
Using the Private Participation Model, the private sector bears 88% of the financial costs. Given the structure of Muntinlupa Market, these costs would likely be borne by the vendors association. This structure is detailed in Table 10.
Table 10: Cost Allocation Using the Private Participation Model
Using the NGO Model, the implementing NGO bears 52% of the overall cost. After the construction phase, the LGU would assume remaining maintenance and operation costs as detailed in Table 11.
Allocation of Externalities
Externalities Stall Owners Market Users City Residents Local Gov
Benefits
Health Care Costs Averted 535,855 - - 535,855 -Productivity Costs Averted 378,016 - 378,016 -Mortality Costs Averted 132,045 - - 132,045 -Water Access Cost Savings 123,753 123,753 - - -Water Reuse Electricity Savings 38,173 38,173 - - -Water Treatment Cost Savings 26,102 - 26,102 - -Access Time 522,036 - 522,036 - -Excreta Reuse 169,201 - - - 169,201
Total Benefits 1,925,181 161,926 926,154 667,900 169,201
Economic PV Financial PV Financial PV Financial PV Financial PV EV - FV (Private Sector) (NGO) (Local Gov) (Stall Owners) (Externalities) Costs
Technical Assistance Costs 25,000 - 25,000 - - -System Construction Costs 87,000 87,000 - - - -Estimated Cocopeat Filter Costs 43,000 43,000 - - - -Social Marketing Plan 12,936 - 9,055 3,881 - -Operations and Maintenance 78,891 78,891 - - - -Electrical Costs 34,122 34,122 - - - -Water Consumption 42,648 42,648 - - - -Total Costs 323,597 285,661 34,055 3,881 -
-27 Table 11: Cost Allocation Using the NGO Model
Using the Local Government Model, the LGU bears 89% of the costs including construction and O&M. The remaining 11% is borne by a partner NGO related to financing technical assistance and social marketing support. This cost distribution is detailed in Table 12.
Table 12: Cost Allocation Using the Local Government Model
Using the Community Participation Model, the resident market stall owners bear 88% of the costs with the remaining costs absorbed by the LGU and partner NGO. This cost distribution is detailed in Table 13.
Table 13: Cost Allocation Using the Community Participation Model
Economic PV Financial PV Financial PV Financial PV Financial PV EV - FV (Private Sector) (NGO) (Local Gov) (Stall Owners) (Externalities) Costs
Technical Assistance Costs 25,000 - 25,000 - - -System Construction Costs 87,000 - 87,000 - - -Estimated Cocopeat Filter Costs 43,000 - 43,000 - - -Social Marketing Plan 12,936 - 12,936 - - -Operations and Maintenance 78,891 - - 78,891 - -Electrical Costs 34,122 - - 34,122 - -Water Consumption 42,648 - - 42,648 - -Total Costs 323,597 - 167,936 155,661 -
-Economic PV Financial PV Financial PV Financial PV Financial PV EV - FV (Private Sector) (NGO) (Local Gov) (Stall Owners) (Externalities) Costs
Technical Assistance Costs 25,000 - 25,000 - - -System Construction Costs 87,000 - - 87,000 - -Estimated Cocopeat Filter Costs 43,000 - - 43,000 - -Social Marketing Plan 12,936 - 9,055 3,881 - -Operations and Maintenance 78,891 - - 78,891 - -Electrical Costs 34,122 - - 34,122 - -Water Consumption 42,648 - - 42,648 - -Total Costs 323,597 - 34,055 289,542 -
-Economic PV Financial PV Financial PV Financial PV Financial PV EV - FV (Private Sector) (NGO) (Local Gov) (Stall Owners) (Externalities) Costs
Technical Assistance Costs 25,000 - 25,000 - - -System Construction Costs 87,000 - - - 87,000 -Estimated Cocopeat Filter Costs 43,000 - - - 43,000 -Social Marketing Plan 12,936 - 9,055 3,881 - -Operations and Maintenance 78,891 - - - 78,891 -Electrical Costs 34,122 - - - 34,122 -Water Consumption 42,648 - - - 42,648 -Total Costs 323,597 - 34,055 3,881 285,661