Boston University
OpenBU http://open.bu.edu
Theses & Dissertations Boston University Theses & Dissertations
2019
Split-ticket voting: causes and
consequences
https://hdl.handle.net/2144/39564
GRADUATE SCHOOL OF ARTS AND SCIENCES
Dissertation
SPLIT-TICKET VOTING: CAUSES AND CONSEQUENCES
by
LILIAN DENISSE JAIMES ARELLANO
B.A., Centro de Investigación y Docencia Económicas, 2006 M.A., Instituto Tecnológico Autónomo de México, 2012
M.A., Boston University, 2013
Submitted in partial fulfillment of the requirements for the degree of
Doctor of Philosophy 2019
© 2019
LILIAN DENISSE JAIMES ARELLANO All rights reserved
First Reader _________________________________________________________ Taylor C. Boas, Ph.D.
Associate Professor of Political Science
Second Reader _________________________________________________________ Douglas L. Kriner, Ph.D.
Professor of Government
Cornell University, College of Arts and Sciences
Third Reader _________________________________________________________ Steven Rosenzweig, Ph.D.
Assistant Professor of Political Science
Fourth Reader _________________________________________________________ Guillermo M. Cejudo, Ph.D.
Provost
iv
DEDICATION
This thesis is dedicated to my wonderful husband Raúl who has always been a constant source of support and encouragement. Together we reach for the stars. This work is also dedicated to my parents, Alfredo y Socorro for encourage me to
v
ACKNOWLEDGMENTS
To my life partner and accomplice in every adventure Raul Galicia. Many thanks! I am also grateful to my professor Taylor Boas for his unfailing support and assistance though all these years. It has been an honor to be your Ph.D. student. For this dissertation I would like to thank my reading committee members: Douglas Kriner, Steven Rosenzweig and Guillermo Cejudo, for their time, interest, and helpful comments.
With a special mention to professor David S. Palmer, I wish you could have been here to see this work finished. I will be forever grateful for your kindness and hospitality to me as a Latin student in the cold land of New England.
I gratefully acknowledge the funding sources that made my Ph.D. work possible. I was funded by Fulbright and CONACYT for three years. My work was also supported by the Graduate School of Arts and Sciences of Boston University. Lastly, I would like to thank my family for all their love and encouragement.
vi
SPLIT-TICKET VOTING: CAUSES AND CONSEQUENCES
LILIAN DENISSE JAIMES ARELLANO
Boston University, Graduate School of Arts and Sciences, 2019 Major Professor: Taylor C. Boas, Associate Professor of Political Science
ABSTRACT
This thesis uses a public policy perspective to examine the individual and institutional factors that lead to, and the consequences of, split-ticket voting.
Chapter 1 uses a new methodology to identify the individual-level variables that influence the levels of split-ticket voting, using Mexico as an example. I find that 25% of Mexican citizens split their ticket, an intermediate level in comparison with other countries such as the United States or Brazil. I also find evidence that the hypotheses of party identification and candidate appeal are viable explanations for split-ticket voting in Mexico. In addition to testing existing hypotheses, I also study and find differences in vertical and horizontal split-ticket voting.
Chapter 2 focuses on the institutional factors that influence voters to split their ballots. I review previously-reported institutional variables and test them in
vii
13 countries using the CSES Module 3 dataset. I use a probit model to test the effect of institutional variables—political alliances, type of electoral formula, number and magnitude of electoral districts, institutionalization of democracy, and type of executive. To complement the econometric analysis, I conduct an experiment to test how the number of parties on a ballot affects split-ticket voting. I find evidence that institutions play a relevant role in this phenomenon and that increasing the number of parties in a ballot increases the probability of a split-ticket vote.
Chapter 3 describes the policy effects of split-ticket voting by examining the allocation of federal transfers between subnational levels governed by different political parties. I use Mexico as a case study and the difference-in-differences methodology to test whether state governors favor municipalities governed by their same political party by granting more funding and projects of public works. Interviews with political actors suggest that governors’ influence to allocate resources at will have diminished as new actors have appeared. The results of the analysis of 2025 municipalities, during the period of 2014 and 2015, indicate that there is no partisan bias in the allocation of funds of the Ramo 23.
viii
TABLE OF CONTENTS
DEDICATION ... iv
ACKNOWLEDGMENTS ... v
ABSTRACT ... vi
TABLE OF CONTENTS ... viii
LIST OF TABLES ... xi
LIST OF FIGURES ... xiii
LIST OF ABBREVIATIONS ... xv
GLOSSARY ... xvi
CHAPTER ONE - ANALYZING SPLIT - TICKET VOTING IN MEXICO’S 2012 ELECTIONS ... 1
Abstract... 1
Introduction ... 3
Literature Review on Split-Ticket Voting ... 6
Split-Ticket Voting in Mexico ... 14
Estimation Methods on Split-Ticket Voting ... 21
Descriptive Analysis ... 25
Estimation of the Levels of Split-Ticket Voting in Mexico ... 29
ix
Conclusions ... 49
CHAPTER TWO - SPLIT-TICKET VOTING: A COMPARATIVE ANALYSIS OF INSTITUTIONS ACROSS 13 COUNTRIES ... 53
Abstract... 53
Introduction ... 54
Case and Cross-National Based Studies, Identified Institutional Variables ... 57
Comparing Across Institutional Variables ... 62
1. Majority, proportional, and mixed electoral systems... 63
2. Parliamentary systems vs. presidential systems... 65
3. New versus established democracies ... 66
Cross-National Analysis ... 67
A Ballot Experiment ... 76
Conclusions ... 91
CHAPTER THREE – PARTY POLITICS AND THE ALLOCATION OF RESOURCES: THE CASE OF MEXICO’S RAMO 23 FUND ... 93
Abstract... 93
Introduction ... 95
The Link Between Political Parties and Budgetary Decisions ... 100
x
Mexican Governors’ Political Power ... 112
Sources of Funding for Political Actors in Mexico, Rules Explained ... 115
Interviews and the demise of Governor’s influence ... 124
Formal analysis of the Ramo 23 disbursements ... 128
Conclusions ... 141
APPENDIX ... 144
BIBLIOGRAPHY ... 157
xi
LIST OF TABLES
Table 1. Ticket splitting types ... 7
Table 2. Voting Decision for City Mayor in the Municipality of Palizada, in the State of Campeche ... 22
Table 3. Election 2012 Results (Vote %) ... 26
Table 4. Number of municipalities where each party received more votes in the presidential race than in the congressional and local elections ... 29
Table 5. Results of the logit method for ecological inference ... 31
Table 6. Ticket splitting voting in the 2012 election ... 33
Table 7. Ballot splitting in federal and local elections (2012) ... 34
Table 8. Results of the ecological inference and the individual data analysis ... 35
Table 9. Split-ticket voting for all election races (President, Deputies, Senators, State governor) ... 44
Table 10. Vertical vs Horizontal split-ticket voting (President, Deputies, Senators, State Governors) ... 48
Table 11. Countries Analyzed by Type of Election and Percentage of Split-Ticket Voting ... 68
Table 12. Multilevel Logistic Model of Split Ticket Voting, Random Intercept Model ... 75
xii
Table 13. Probit model of split-ticket voting as the dependent variable ... 87
Table 14. Distribution of municipalities and state governments by political party ... 131
Table 16. OLS Model outcomes ... 136
Appendix 1. Multilevel Logistic Model of Split Ticket Voting, Random Intercept Model for Institutional Variables ... 144
Appendix 2. Characteristics of the participants by type of vote ... 146
Appendix 3. Description of the electoral institutions of the 13 countries analyzed ... 148
Table 18. Breusch-Pagan test ... 155
Table 19. White test ... 155
xiii
LIST OF FIGURES
Figure 1. Split-Ticket Voting Explanations... 13 Figure 2. An example of vertical ticket-splitting. Percentage of votes each party
received in both the presidential (x axis) and the municipalities’ race (y axis) ... 27 Figure 3. An example of horizontal split- ticket voting. Percentage of votes each
party coalition received in both the Deputies PR (x axis) and the Deputies MR race (y axis). ... 28 Figure 4. Original Ballot and Ballots Used for the Experiment ... 77 Figure 5. Comparison Between Participants and the Mexican Population by
Gender ... 79 Figure 6. Participants and Mexican Population by Party Identification ... 80 Figure 7. Participants and Mexican Population by Political Ideology ... 80 Figure 8. Distribution on the Left-Right Spectrum of Participants, by Type of Vote ... 81 Figure 9. Percentage of Participants by Type of Ballot ... 83 Figure 10. Percentage of Participants that Split their Vote (Voter’s Choice for the
Federal Deputies) by Party and Type of Ballot... 84 Figure 11. Percentage of votes by party in the Ballot with 10 parties ... 89
xiv
Figure 12. Vote percentage by party and type of vote in the Ballot with 10 parties
... 90
Figure 13. Process to obtain the funds from the Ramo 23 ... 109
Figure 14. Sources of Funding for Municipalities in Mexico. ... 118
Figure 15. Federal Transfers to States ... 120
Figure 16. Ramo 23 Funds ... 123
Figure 17. State Governorships by Political Party in 2014 ... 125
xv
LIST OF ABBREVIATIONS
CSES ... The Comparative Study of Electoral Systems INEGI ... National Institute of Statistics MMP... Mixed Member Proportional MR ... Majoritarian Representation PAN ... Partido Acción Nacional PR ... Proportional Representation PRD ...Partido de la Revolución Democrática PRI ... Partido Revolucionario Institucional
xvi GLOSSARY
Concurrent: Refers to elections at different levels of government (i.e.: Federal and Municipal level) happening at the same date.
Election: In this document, “election” refers to a general election season.
Governor: In all cases, “governor” is used to refer to the head of the executive branch of a state level of government.
Mayor: “Mayor” is used in this document to refer to the equivalent of “municipal president”, or the head of the executive branch at a local level of government. While “mayor” is typically used for cities, it is possible for a municipal president to govern a rural area.
Race: In this document, “race” is used to refer to a specific contest or vote for a specific position, in contrast to “election”, which is used to refer to a collective season of races.
Split-ticket voting: Also “ticket splitting” or “splitting a ballot”. Refers to when a voter votes for candidates from different political parties in different races during a same election, as opposed to straight-ticket voting, where a voter chooses candidates from the same political party for every office up for election.
xvii
Split, Vertical: When votes are cast for different political parties at different government levels, for example, when a voter chooses presidential and gubernatorial candidates from different parties.
Split, Horizontal: When a citizen votes for different parties in similar seats, for example, when voting for two congressional representatives (possible in mixed electoral systems, such as Mexico).
1 CHAPTER ONE - ANALYZING SPLIT - TICKET VOTING IN MEXICO’S
2012 ELECTIONS Abstract
While the factors that lead citizens to split their ballots between different parties have been analyzed in different countries with increasingly sophisticated methods, this phenomenon has not yet been comprehensively explored in Mexico. The analysis of split-ticket voting in Mexico’s case sheds light of this phenomenon in second wave democracies and at the same time, allows to compare the results to other countries. In this paper, I use these new methods on aggregate data to measure the levels of split-ticket voting in Mexico, and the most recent data to test the individual level hypotheses that explain this phenomenon. My research found that in 2012, 25 percent of Mexican citizens voted for different parties, an intermediate level of split-ticket voting compared to other countries such as the United States or Brazil. I found evidence suggesting that the hypotheses of party identification and candidate appeal are contributing factors to split-ticket voting. The hypothesis of policy balancing, prevalent in the American literature, surprisingly lacked strength in the Mexican context. In addition to testing existing previously-published hypotheses, I analyzed vertical and horizontal split-ticket voting, finding differences in them across Mexico. The split-ticket voting rate is
larger for the presidential and congressional representation elections, and even more between presidential and mayoral elections. This work implements an updated quantitative approach to the study of split-ticket voting in Mexico and contributes to the literature by presenting evidence of the factors behind vertical and horizontal split-ticket voting.
3 Introduction
Although the literature on split-ticket voting is vast in the United States, in other countries this is still unexplored territory. The study of this phenomenon in other countries represents an opportunity to understand more about the individual and institutional factors that influence it. For example, studies in Germany and New Zealand have shown that institutional settings such as a mixed electoral system increases the likelihood of a person casting her vote for different parties (See Karp et al 2002 and Gschwend, 2007). Also, research in countries such as Brazil helps to understand the phenomenon in contexts where candidate-centered campaigns dominate or where voters choose among multiple parties (Ames et al., 2008). Studying the phenomenon of split-ticket voting in other countries has contributed to testing the hypotheses that originated in the United States.
The study of Mexico adds to the existing literature on split-ticket voting in mixed electoral systems, allowing comparisons with countries such as Germany and New Zealand. At the same time, it allows for exploring this phenomenon in a context of a recent democracy, as Mexico has witnessed a transition from a hegemonic regime to a democracy. In this regard, the results of this study can be compared to those countries such as Brazil, where old and new parties are
adapting to the electoral competition. In this way, Mexico’s characteristics allow to test four hypotheses, that explain the levels of split-ticket voting, found in the literature of different countries.
In Mexico, the causes of split-ticket voting have not been studied in depth because of the type of data available to researchers. First of all, the rate of split-ticket voting is not recorded at the electoral posts so is not possible to track the individual´s voting decisions as in other countries such as New Zealand. As a consequence, some studies have extrapolated conclusions from the analysis of aggregate data (Crow, 2005; Ochoa and Saracho, 2006) or have recurred to individual level data available the Mexico Panel Data for the 2000 election.
The surge of new methodologies to address aggregate data problems as well as new individual data on a different election (the 2012 Mexico Panel Survey) allows for a revision of what we know on split ticket voting in Mexico and to test for existing hypothesis on the factors that cause it. In particular, I will test three existing theories in the literature on the individual factors that influence citizens’ decision to split their vote. This is possible due to the characteristic of Mexico. I will argue that by using the 2012 election it is possible to better assess not only the levels of split-ticket voting but also to add to the literature on voting behavior in
5 Mexico by adding evidence on differences between vertical and horizontal ticket splitting.
As a first step, this paper measures the levels of split-ticket voting in Mexico using both individual and aggregate level data. I find that compared to other countries, the levels of split-ticket voting in Mexico lie in the middle of the spectrum. If we consider a strict approach on split-ticket voting and count the percentage of voters who split their vote at least in one electoral race (in the 2012 elections, voters received four ballots for different elections) then the split-ticket voting rate reaches up to 25%. But if we look across specific races, the rates of ticket voting can vary from 14.8% in President-Deputies ballots (vertical split-ticket voting) to 9.8% in the President-State governor ballots (horizontal split-split-ticket voting), which suggests that vertical splitting is more frequent than horizontal splitting. The analysis using aggregate data shows that the Democratic Revolutionary Party (Partido de la Revolución Democrática, PRD) is the party that is most affected by the split-ticket voting since in 67% of the municipalities that had concurrent elections, the PRD presidential candidate received more votes than the PRD mayor candidate.
Analyzing aggregate data with the Thomsen method for ecological inference (1987) allows us to estimate the percentage of voting transferred from
one party to another.1 In this regard, I found that Josefina Vazquez Mota, the PAN
presidential candidate, lost 28% votes to the PRI deputies. There is also a frequent split-ticket voting across the PAN (right) and the PRI (center), while there are few splitters across the PAN and the PRD (left). While this could suggest that ideology influences the levels of split-ticket voting I didn’t find evidence of this when using individual level data.
In a second step, I tested three hypotheses found in the prevailing literature that characterize citizens’ motivation to split their vote. By running a multivariate statistical analysis of the 2012 Panel Survey I found evidence that supports two of the three hypotheses. Surprisingly, the policy balancing hypothesis that emerged in the U.S. electoral context was not supported by the data. This finding might suggest that electoral institutions, beyond individual motivations, play also an important role in the level of split-ticket voting. The role of institutions is analyzed in Chapter 2.
Literature Review on Split-Ticket Voting
While split-ticket voting commonly refers to a citizen voting for one party in presidential elections and a different one in congressional elections, the concept
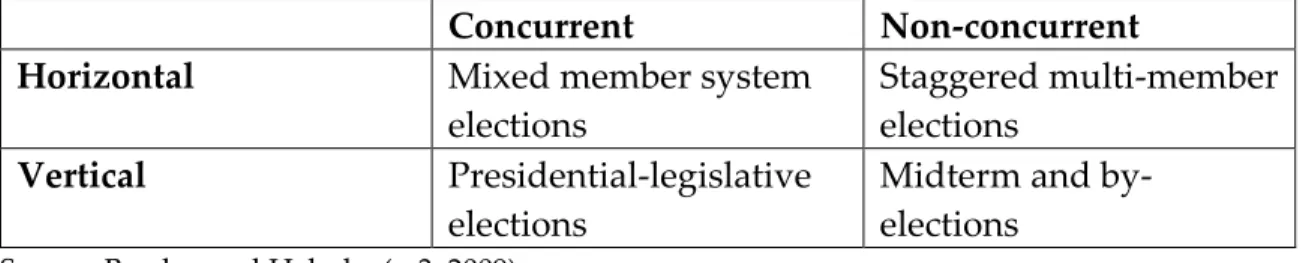
7 is wider and can be applied to all electoral races. Burden and Helmke state that “a ticket is split if voter i votes for party j in contest r and votes for party ~ j in some other contest” (p. 2, 2009), highlighting the variability inherent in defining a split -ticket vote. According to these authors’ definition, there are two classes of split-ticket voting: vertical and horizontal. Horizontal split-split-ticket voting is when a citizen votes for different parties in similar positions, for example, when voting for two congressional representatives (possible in mixed electoral systems, such as Mexico). Vertical splitting is when votes are cast for different political parties at different government levels, for example, when a voter chooses presidential and gubernatorial candidates from different parties.
Table 1. Ticket splitting types
Concurrent Non-concurrent
Horizontal Mixed member system
elections
Staggered multi-member elections
Vertical Presidential-legislative
elections
Midterm and by-elections
Source: Burden and Helmke (p.3, 2009)
Yet, why does split-ticket voting occur? And why should it be studied? This phenomenon first drew interest in the United States, as divided government became more frequent. The idea that a divided government was the cause of legislative deadlock led researchers to look into split-ticket voting. Since then, the study of split-ticket voting has extended to other countries, each with their own
party systems and electoral rules, demonstrating that split-ticket voting has different causes and consequences.
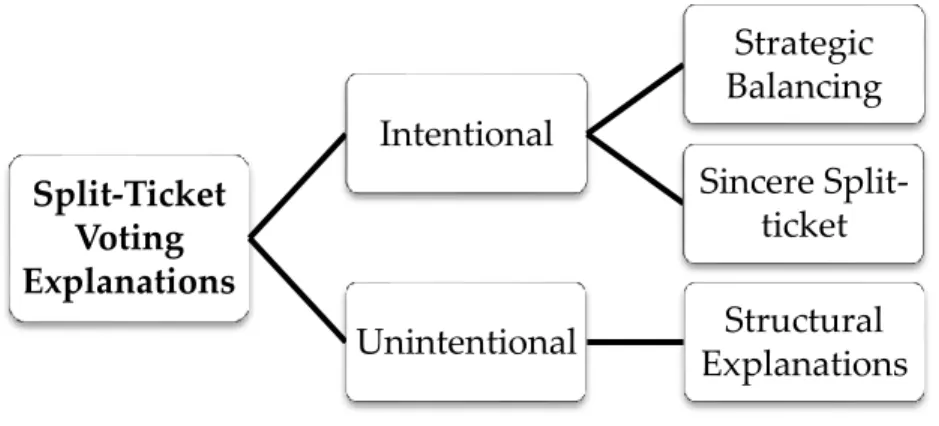
The existing literature classifies split-ticket voting in two categories: intentional or unintentional split-ticket voting. Intentional split-ticket voting refers to people making strategic voting decisions based on available information (Gschwend, 2007; Karp et al 2002; Helmke 2009; Arian and Weiss, 1969; Fiorina 1996; Kedar, 2005, 2006) whereas unintentional split-ticket voting is commonly related to structural explanations such as ballot design or electoral institutions (Campbell and Miller, 1957; McAllister and Darcy, 1992; Shugart, 1995; Calvo et al 2008; Burden 2009).
Structural explanations of unintentional split-ticket voting are elements intrinsic to the electoral or political system. Ballot design is the first element that determines whether voters are given the option to split their ballot or not. In one of the first studies on split-ticket voting in the United States, Campbell and Miller (1957) found that differences in ballot design across states influence levels of split-ticket voting. These authors describe how states with a single ballot for all electoral races tend to have higher straight ticket voting levels than those states with multiple ballots. McAllister and Darcy’s (1992) study of the 1988 elections in the United States also supports Campbell and Miller’s findings that differences in
9 ballot designs across states account for split-ticket voting levels. Ballot design is also relevant to the topic in terms of the information presented to voters. For example, Calvo et al. (p. 202, 2008), in an experiment conducted in Argentina, finds that “ballots that highlight candidate-centric information induced higher split ticket rates than ballots reinforcing party-centric information.”
Another structural factor that favors unintentional split-ticket voting is the absence of candidates. In Japan’s case, Burden (2009) argues that it is common for some parties to not have representatives contending for all open positions. Candidates’ absence increases split-ticket voting levels because voters are forced to choose representatives from other parties. In a different argument, Shugart (1995) finds that the existence of staggered elections increases the chance of ticket voting. In both cases, institutional constraints play a relevant role in split-ticket voting.
Intentional split-ticket voting is described in the literature as when people either choose different parties due to strategic considerations (an example is policy balancing theory) or due to sincere preference voting (for example when a local party does not have a represent at the national level). Intentional split-ticket voting motivated by strategic considerations is often associated with individual factors, which is the object of study in this paper. The most explored current of this theory
refers to the idea that people, by splitting their vote, aim for a balanced policy outcome (Alesina and Rosenthal, 1989, 1995; Fiorina 1994, 1996; Ingberman and Villani, 1993; Lacy and Niou, 1998; Lacy and Paolino, 1998; Mebane, 2000; Scheve and Tomz, 1999; Lewis-Beck and Nadeau, 2004; Smith et al., 1999; Tarrance and DeVries, 1998; Kedar, 2005, 2006). The policy-balancing theory has its origins in Downs (1957), who argues that people prefer the polices that are nearest to their ideal points. This theory has been extensively studied in the setting of the United States, where two parties dominate the political arena, and it is based on the assumption that actors are rational and fully informed by the parties’ policy positions (Downs, 1957). Under this view, split-ticket voting could be understood as voters’ efforts to moderate policies by choosing opposing parties.
Several studies on divided government in the United States support the theory of strategic balancing. Alesina and Rosenthal (1989, 1995) and Fiorina (1994) are the main scholars who argue that a consequence of policy divergences is the motivation for Americans splitting their votes. Alesina and Rosenthal (1989, 1995) claim that Americans favor opposition in Congress during midterm elections in an attempt to counterbalance the presidents’ policies. Fiorina (1994) asserts that parties at the local level adopt different policy approaches, which has contributed to the rise of divided government in different states of the U.S. Other studies used
11 varied research methods to provide evidence in favor of the theory of strategic balancing. For example, Carsey and Layman’s (2004) study using a new data set supports the theory that voters’ final goal when voting a split ticket is a divided government. Using game theory, Ingberman and Villani (1993) argue that parties adopt divergent policies that promote split-ticket voting. Finally, Grofman et al. (2000) analyze median voter preferences in each district and also find that divergence in policy positions favors split-ticket voting. It is important to note that these studies are based on evidence gathered from U.S. elections and dated in the 1990s, a period characterized by the rise of hyper-partisanship.
Other studies can be defined as derivations of the theory of strategic balancing. Lacy and Paolino (1998) argue that split-ticket voting is the result of voters taking policy outcomes into account instead of candidates’ policy positions. In a different approach, Mebane’s (2000) research shows that a divided government is the result of voters splitting their tickets in a coordinated manner and not as a random decision. Finally, Chhibber and Kollman’s (2004) comparative research suggests that the strategic balancing theory can also be fueled by differences in policy agendas across government levels, as in the cases of India and Canada, where the national and local party systems are not comparable. These
studies have shown that policy balancing theory can find support in contexts outside the United States.
Intentional split-ticketing can also describe situations when voters split their votes by voting for parties that are not their first choice or when they split their votes because they genuinely want to vote for specific candidates even if they are from different parties. Helmke (2009) and Saunders et al. (2005) argue that when there is a paucity of information on how a party in a new democracy will perform, people tend to minimize risks by splitting their votes. According to these authors, split-ticket voting works as an insurance policy for electoral results. Other studies suggest that voters follow their true preferences, even when that means voting a split ticket. In particular, this has proven to be the case in mixed electoral systems where the proportional representation (PR) votes are considered to be based on true preferences while votes for single member district (SMD) representatives respond to other considerations, such as coalition expectations (Gschwend, 2007; Bawn, 1999; Karp et al., 2002). There is evidence that this is the case in countries such as Germany (Bawn, 1999) and New Zealand (Karp et al., 2002). Another situation in which split-ticket voting is due to sincere preferences
13 is when there is a clear distinction between local and national party systems, as in Israel (Arian and Weiss, 1969) or Denmark (Elkit and Kjaer, 2005).2
Figure 1. Split-Ticket Voting Explanations
Source: Own analysis and elaboration.
Beyond explanations about intentional or unintentional reasoning, researchers have also focused on other elements that influence voters to split their ballots. Alternative explanations include those that focus on campaign effects (Burden and Kimball, 1998; Calvo, Escolar and Pomares, 2008; Karp and Garland, 2007), candidate quality (Roscoe, 2003; Burden, 2009), party organization strength (Karp, et al., 2002; Gschwend, Johnston and Pattie, 2003; Helmke, 2009; Ames, Baker and Renno, 2008; McAllister and White, 2000), or voter sophistication
2 This differs from the cases of India and Canada describes above as the intention is not balancing public policy. Split-Ticket Voting Explanations Intentional Strategic Balancing Sincere Split-ticket Unintentional Structural Explanations
(Takahashi, 2007). These factors are also considered in the analysis of split-ticket voting in Mexico in the sections that follow.
It is clear thatthere is extensive literature on split-ticket voting in the United States; yet, there is a paucity of published literature on this subject in other countries. Studying this phenomenon in other countries offers a richness of experiences that allows for deeper understanding of the individual and institutional factors that influence split-ticket voting. For example, studies in Germany and New Zealand have shown that institutional settings—such as a mixed electoral system—increase the likelihood of a person casting their vote for different parties (See Karp et al 2002 and Gschwend, 2007). Studies, such as that done by Ames et al. (2008) in Brazil, have also lent greater understanding to this phenomenon in countries where candidate-centered campaigns dominate or where voters choose from multiple parties. In this sense, the study of the Mexican case is relevant as this country has the political conditions to test for an ample variety of institutional settings.
Split-Ticket Voting in Mexico
The particularities of the party and electoral systems in Mexico make it an interesting case study for testing the individual factors involved in split-ticket voting. Mexico is a federation, and its government is divided into three branches:
15 executive, legislative, and judicial. The president and the state governors are elected every six years, while city mayors are elected every three years. Congress is bicameral; representatives from the upper chamber (senators) are elected every six years, and representatives from the lower chamber (deputies) are elected every three years. Lower chamber representatives are elected through a mixed electoral system in which 300 deputies are elected under majority rule (first-past-the-post method) and 200 under proportional representation rule. The Senate is made up of 128 senators who are elected every six years, running concurrently with the president. Federal and state elections are not all concurrent. At the local level, states have their own electoral calendars, and some state elections are scheduled at the same time as federal elections.
Mexico’s party system is dominated by three major parties that draw a large percentage of the votes: the PRI, the PAN, and the PRD.3 While minor parties may
run candidates for the presidency, they typically form alliances with larger parties. The effectiveness of the multiparty system is relatively new. The PRI was hegemonic for over 70 years, with opposition parties only beginning to gain terrain in local and state elections in the mid-1980s and a PAN president being elected
only recently, in 2000. At the time of the 2012 elections, the period this paper focuses on, the PAN occupied the presidency and governed in seven states while the PRD governed in three states. At that same moment, the PRI held 47 percent of the deputy seats in Congress, the PAN, 28 percent, and the PRD, 14 percent.
In comparison to other countries, research on split-ticket voting in Mexico is scarce, and there have been few studies on this phenomenon. Crow’s research (2005) shows that split-ticket voting in the 2000 presidential election was 16.2 percent—13.56 percent split their votes between president and federal deputy, 16.23 percent between president and senator, and 8.99 percent between deputy and senator. According to Crow, Mexicans intentionally split their vote in order to have a divided government, suggesting that policy balancing is the prevalent hypothesis that explains this phenomenon in Mexico. He also found that all sectors of Mexican society were equally likely to split their tickets in the 2000 election.
Takahashi (2007) explores split-ticket voting between the Mexican congressional and presidential election in 2000. Although this author does not measure the levels of split-ticket voting, he does focus on the factors that influence voters. This author argues that voters’ levels of political sophistication explain current levels of ballot splitting. As socioeconomic levels decrease, the probability
17 of split-ticket voting increases (Takahashi, 2007). Weak partisanship also contributes to an increased likelihood that voters will split their ballots.
Helmke (2009) also studies split-ticket voting in Mexico. She used the first iteration of the Mexico Panel Study—carried out in 2000— instead of aggregate data to measure the levels of split-ticket voting. She argues that ballot splitting works as voters’ insurance policy in a political context of uncertainty. Finally, Laborde et. al (2012) explored the possibility that clientelism could propitiate split-ticket voting in Mexico, but they did not find evidence to support the claim that gifts from parties during election campaigns caused voters to split their ballot.
While the existing studies on split-ticket voting in Mexico represent a step forward in understanding individual factors relevant to the phenomenon, their conclusions lack consistency. Indeed, certain authors report contradicting findings. For example, some authors argue that socioeconomic factors influence voters’ decisions to choose different parties (Takahashi, 2007) while others reject this theory (Crow, 2005).
It is important to note that the majority of studies on split-ticket voting in Mexico use the 2000 iteration of the Mexico Panel Study as the main data source. The Mexico Panel Study is a survey research project on Mexico’s election campaigns that has been in operation since the 2000 general elections; the 2012
Mexico Panel Study is the third iteration of the general election series. It is a face-to-face survey that asks a series of questions about voting patterns and political preferences to a random stratified sample of eligible Mexican voters who are interviewed in person before and after the elections. In the post-election wave, the survey asks for people’s voting decisions during the electoral races for the president, governors, senators, and federal deputies. This wave includes more than 800 observations and is a statistically representative sample of those who report casting a valid vote on Election Day. The data gathered is intended to be a resource for scholars working on campaigns, public opinion, voting behavior, and political communication. Data is gathered in separate surveys over the course of the campaign and following the election using a hybrid panel/cross-sectional design.
While the Mexico Panel Study has always been useful, it can justifiably be argued that the 2000 and 2006 elections were atypical, as in the first one the country completed its transition to an electoral democracy and the second one was marked by post-electoral conflicts. It therefore follows that a reanalysis of the split-ticket voting phenomenon in Mexico using a new data set on a different election as well as other statistical methodologies is necessary. This new analysis will not only allow for assessing the validity of the hypotheses found in the literature in other
19 countries but also for reviewing previous findings in Mexican literature. Additionally, this paper will add to the literature by exploring other types of split-ticket voting, such as the differences between vertical and horizontal split-split-ticket voting.
As existing literature in Mexico is based on the 2000 Mexico Panel Study, it is relevant to reflect on the unique context of that election process. It was during this election year that the PRI lost the presidency for the first time in over 70 years. Several explanations point to a singular convergence of factors that led to the PRI’s electoral defeat, suggesting this election was atypical (Green, 2007; Chand, 2001; Magaloni, 2006; Klesner, 2005). During this electoral process, the PAN candidate portrayed himself as the only one capable of defeating the PRI; his campaign slogan was “the vote for change.” The PAN candidate was able to get support from other parties’ voters because they felt he had a chance at beating the PRI. Within this context, split-ticket voting rates would have been atypical in this election, since there was an element of voting for or against the regime and any attempt at generalizing the results of the analysis surrounding the motivations behind voters’ decisions to split their ballots will lack external validity.
The 2006 election can be characterized by an unusual ideological polarization. In addition, this election was highly controversial, to such an extent
that the results were disputed in courts and there was a post-electoral social unrest. The electoral court ruled that the PAN won the presidency and defeated the PRD by a margin of less than 1 percent of the votes. Researchers link the close election results to a major ideological polarization during the presidential campaign (Moreno, 2009). This election was characterized by the use of negative campaigns. The PAN candidate launched a media campaign portraying the PRD candidate as “a danger to Mexico,” polarizing voters to the left and right of the political spectrum and leading to a close election. As a result, the levels of split-ticket voting were as unusual in the 2006 elections as they were in 2000. For example, only 10 percent of the PAN voters split their ballots. This differs from other elections where vote-splitters came from all parties.
Therefore, when compared to the 2000 and 2006 elections, an analysis of the 2012 election will provide an understanding of the split-ticket phenomenon under a more stable political context. On July 1, 2012, the president, 128 senators, 500 deputies, 6 governors, and nearly 900 mayors were elected. In this election, the PRI won the presidency by a difference of 7 percent of the votes over the PRD. While there were claims of vote-buying practices, the electoral court ruled in favor of the PRI, and no major protest followed the court’s decision. It is also important to mention that the three main parties obtained almost 97 percent of the valid votes.
21 In these elections, 50,143,616 Mexicans voted, representing 63 percent of registered voters, a typical level of participation by international standards.
Estimation Methods on Split-Ticket Voting
While international literature has allowed for a wider vision on nuances in split-ticket voting, researchers around the world face the same difficulty when trying to measure this phenomenon. The main issue is the fact that few electoral systems record each person’s vote for different races; they only record aggregate results. This leaves researchers with the option of either using aggregate level data or individual survey data.
When there is no official public recorded data on how each individual voted, individual survey data becomes a great tool for researchers. However, in some countries, this type of data is not available and even when it is, researchers must take bias into account (Abramson and Claggett, 1991; Silver, Anderson and Abramson, 1986; Wright, 1990). It is well-documented that there is a tendency for people to misreport their voting decisions in post-electoral surveys (Belli et al., 1999; Presser, 1990). While aggregate data might seem like a feasible option to at least measure the magnitude of the split-ticket voting in a country, it definitely has disadvantages.
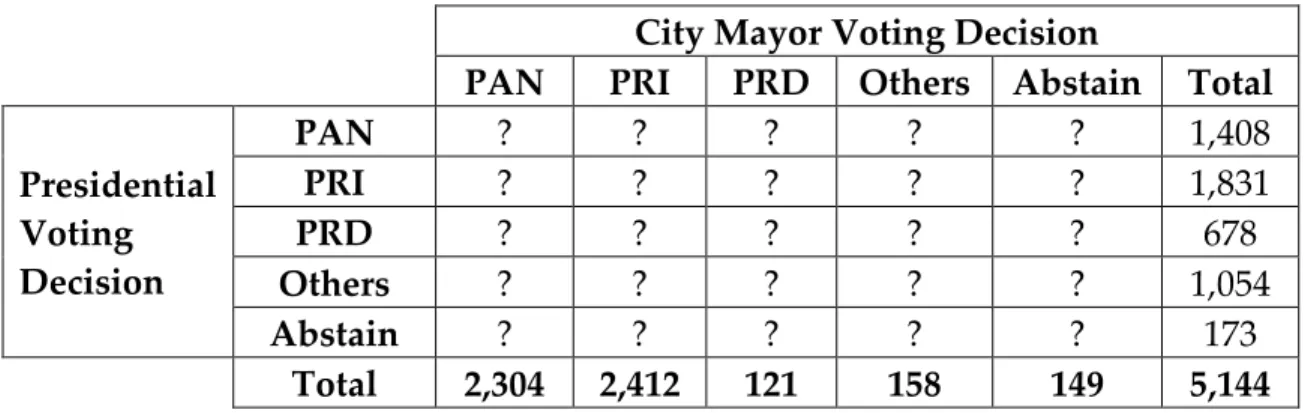
Measuring split-ticket voting using aggregate data has proven to be a challenge (King, 1997; Burden and Helmke, 2009) due to the ecological fallacy (Selvin, 1958). The way in which each vote is counted and recorded represents a challenge for researchers looking to explain individual electoral behavior. As only aggregate data is recorded, it is not possible to measure the proportion of those who voted a split ticket. For example, in the 2012 elections in Mexico, it is possible to know how many people voted for each presidential candidate and for each party in the local races, but it is not possible to measure the differences in votes and to calculate the number of people who casted a straight-ticket vote (See Table 2 below).
Table 2. Voting Decision for City Mayor in the Municipality of Palizada, in the State of Campeche
City Mayor Voting Decision
PAN PRI PRD Others Abstain Total Presidential Voting Decision PAN ? ? ? ? ? 1,408 PRI ? ? ? ? ? 1,831 PRD ? ? ? ? ? 678 Others ? ? ? ? ? 1,054 Abstain ? ? ? ? ? 173 Total 2,304 2,412 121 158 149 5,144
Source: INE historical dataset
Different methods have been developed to address the problem posed by the ecological fallacy. Numerous previously-published articles outline a wide variety of approaches: the method of bounds (Duncan and Davis, 1953);
23 Goodman’s ecological regression (1953, 1959); King’s ecological inference method (1997); Thomsen’s method (1987); and the entropy-maximizing estimation method (Johnston et al., 1982; Johnston and Pattie, 2000; Elff, Gschwend and Johnston, 2007). Each of these methodologies has its strengths and weaknesses.
The method of bounds uses available information to estimate an interval of possible cell frequencies that must be true. However, while informative, this method is not useful, as the range could be too wide to draw conclusions. Therefore, Goodman (1959) adapted this methodology using a regression to estimate all possible proportions from the known aggregate results. The assumption behind this is that the unknown parameters are constant across all observations. The downside of Goodman’s ecological regression is that it tends to overestimate the proportions, showing intervals beyond 100 percent of the votes cast (see Burden and Kimball, 2002, p. 48). King’s ecological inference method was, therefore, designed to improve on both the method of bounds and Goodman’s ecological regression. While King’s method uses a probabilistic approach to counter some of the weaknesses of previous methods, it also relies on several assumptions that are difficult to satisfy (Cho, 1998; Freedman et al. 1998; McCue, 2001; Rivers 1998). Thomsen’s method attempts to generate a model with simpler assumptions and uses a logit approach instead of a linear regression. While the
assumptions of this model are simple, the logit model results in overestimation of voter stability (Thomsen et al., 1991). Finally, the entropy-maximizing estimation method uses a mathematical procedure—instead of a statistical one—to identify the most likely result, and it uses both an individual level survey as well as aggregate data (Johnston and Pattie, 2000). One of the criticisms about it is that this method requires additional individual level data, which could introduce bias or sampling error problems (Cleave, Brown and Payne, 1995).
Burden and Helmke (p. 4, 2009) summarize the existing forms to analyze split-ticket voting in three branches: survey data, aggregate data results, and ecological inference methods. As each method has both positive and negative aspects, researchers should use all three of them to describe the split-ticket phenomenon more accurately. Following Burden and Helmke’s recommendation, I will take advantage of the survey and aggregate data gathered from the 2012 election. For the ecological inference method, I will analyze the existing aggregate data using Thomsen’s method, which has proven to be quite stable across different settings and contexts (Thomsen et al., 1991; Cleave et al., 1995; Park et.al., 2014) and with estimates closer to the true vote proportions than other strategies such as s King’s (1997) ecological inference method (Park, 2008a), which does not
25 recover important patters in the data. This paper uses Thomsen’s (1987) estimator implemented via his ECOL software.
Descriptive Analysis
A general election was held in July 2012 in Mexico where voters received four ballots, one for each position in dispute (president, PR deputies, majority deputies, and senators). In addition, citizens of the states of Chiapas, Guanajuato, Jalisco, Morelos, Tabasco, and Yucatán voted for state governor and city mayors. The differences in the percentage of votes received by each party in the election indicate the presence of split-ticket voting.
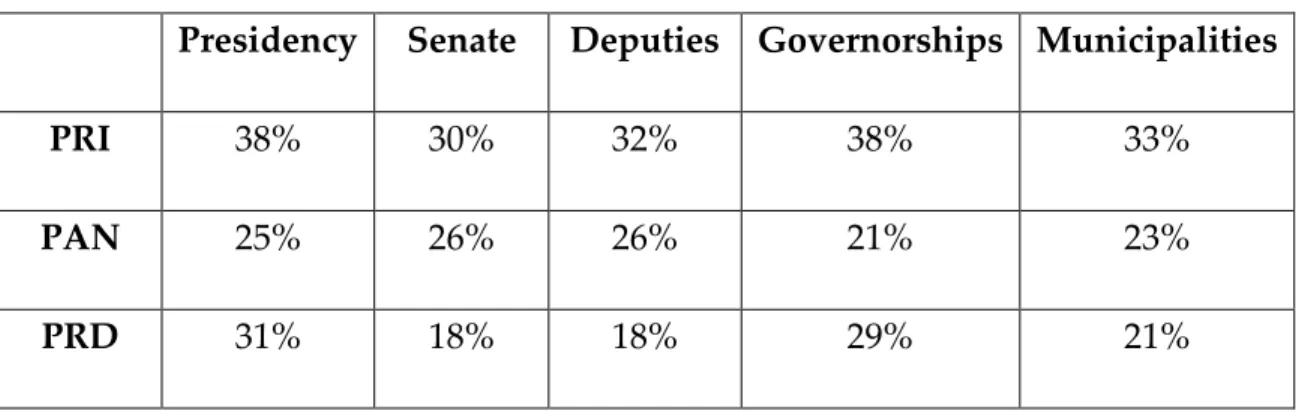
Even though the PRI won the majority of the elections, there are still differences in the voting results that might indicate the presence of split-ticket voting (see Table 3). For example, the PRD finished a close second to the PRI in the presidential election but lacked voters’ support at the municipal level and in Congress. At the same time, the PAN’s candidates did well in congressional elections (winning 114 seats of 500) but only won one governorship out of the six in dispute (obtaining only 21 percent of all the votes across the six gubernatorial races).
Table 3. Election 2012 Results (Vote %)
Presidency Senate Deputies Governorships Municipalities
PRI 38% 30% 32% 38% 33%
PAN 25% 26% 26% 21% 23%
PRD 31% 18% 18% 29% 21%
Source: INE historical dataset, State Electoral Institutes and CIDAC Electoral data set
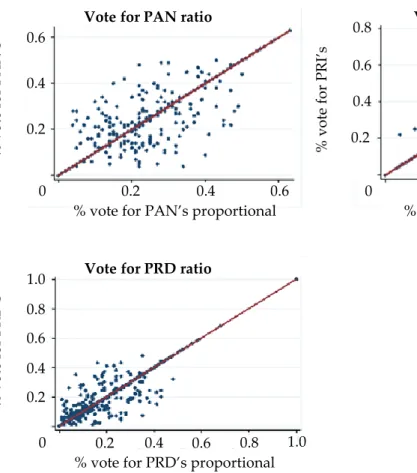
Figures 2 and 3, on the next page, illustrate how the difference in the percentage of voting varied in the 2012 election, not only across parties but also according to the type of race. Certain trends emerged from a closer analysis of the election results from these 2,457 municipalities. For example, in terms of parties, the PRD appeared to be the party that displayed a larger difference in terms of the votes it received for the presidential and municipal races. Additionally, the PRI is the party with the tightest fit between municipal and presidential vote. The aggregate electoral results in figures 2 and 3 also show that vertical split-ticket voting appeared to be larger than horizontal split-ticket voting. The differences in voting percentages are smaller between proportional representation and majority deputies than between presidential and municipal elections
In the case of the PRD, in 67 percent of all municipalities that held elections, the percentage of votes for its presidential candidate exceeded the percentage of
27 votes cast for its city mayoral candidate. A similar situation occurred with the PRI: its congressional candidates received a larger percentage of the vote than its presidential candidate in 99 percent of the municipalities (see Table 4). This suggests that Mexican voters split their ballots differently depending on the political parties involved.
Figure 2. An example of vertical ticket-splitting. Percentage of votes each party received in both the presidential (x axis) and the municipalities’ race (y axis)
Source: INE historical dataset, State Electoral Institutes Vote for PAN ratio
% vot e fo r PA N’s m un icipa l ca n d ida te 0.2 0.4 0.6 0 0.2 0.4 0.6
% vote for PAN’s presidential candidate
Vote for PRI ratio
% vot e fo r PR I’s m un icipa l ca n d ida te 0.2 0.6 0.8 0 0.2 0.6 0.8
% vote for PRI’s presidential candidate
0.4
0.4
Vote for PRD ratio
% vot e fo r PR D’ s m un icipa l ca n d ida te 0.2 0.6 1.0 0 0.2 0.6 1.0
% vote for PRD’s presidential candidate
0.4
0.4 0.8
Figure 3. An example of horizontal split- ticket voting. Percentage of votes each party coalition received in both the Deputies PR (x axis) and the Deputies MR race (y axis).
Source: INE historical dataset Vote for PAN ratio
% vot e fo r PA N’s m aj o ri ty d ep uti es 0.2 0.4 0.6 0 0.2 0.4 0.6
% vote for PAN’s proportional representation deputies
Vote for PRI ratio
% vot e fo r PR I’s m aj o ri ty d ep uti es 0.2 0.6 0.8 0 0.2 0.6 0.8
% vote for PRI’s proportional representation deputies 0.4
0.4
Vote for PRD ratio
% vot e fo r PR D’ s m aj o ri ty d ep uti es 0.2 0.6 1.0 0 0.2 0.6 1.0
% vote for PRD’s proportional representation deputies 0.4
0.4 0.8
29 Table 4. Number of municipalities where each party received more votes in the presidential race than in the congressional and local elections
Congressional election City Mayor Election # Municipalities % # Municipalities %
Vazquez- PAN 1,059 43 393 53
Peña- PRI 29 1 284 39
AMLO- PRD 1,193 49 491 67
Source: INE historical dataset, State Electoral Institutes
While aggregate data suggest the existence of split-ticket voting in Mexico, a method of ecological inference is necessary to measure its magnitude. Thomsen’s method makes it possible to estimate the levels of split-ticket voting and the voter mobility between parties. The Thomsen estimator exhibits certain characteristics that permit it to generate estimates from aggregate data that are close to the individual-level estimates.
Estimation of the Levels of Split-Ticket Voting in Mexico
As mentioned above, the logit method of ecological inference has its assumptions, advantages and shortcomings. In terms of assumptions, this method is based on two: isomorphism (which means that the variation between individuals has the same structure as the variation between districts), and the assumption of a very high ratio of individual variance to ecological variance. In terms of advantages, the estimates of this method have been found to be very close
to true vote proportion when tested in different countries (Thomsen et al., 1991; Cleave et al., 1995; Park et.al., 2014). This method has been criticized for producing conflicting estimates when comparing them with survey results. However, these differences have been linked to social desirability issues of poll respondents rather than to the method itself.
The logit method for ecological inference equates the individual level fourfold correlation with the ecological logit Pearson correlations. The logit method for ecological inference is an effort to develop a new technique for ecological inference based on the latent structure theory. The latent structure theory assumes that the probability of a certain choice is a function of a latent variable associated with each individual (Thomsen, 1987). The latent structure theory argues that there exist a number of latent factors that explain electoral behavior in the first election as well as electoral behavior in the second election. Table 5 shows the results of the logit method for ecological inference.
31 Table 5. Results of the logit method for ecological inference
President and Congress President and Mayor Senate and Deputies PR Deputies and MR Deputies Straight voting PAN and PAN 56.6% 46.3% 60.0% 94.0% PRI and PRI 53.8% 41.3% 63.9% 93.8% PRD and PRD 45.1% 32.7% 70.6% 93.8% Split-ticket voting PAN and PRI 28.8% 27.3% 22.6% 3.8% PAN and PRD 1.8% 9.5% 1.2% 0.1% PRI and PAN 25.0% 25.8% 20.9% 3.4% PRI and PRD 5.7% 14.8% 3.4% 0.5% PRD and PAN 6.4% 10.5% 2.0% 0.2% PRD and PRI 16.1% 31.9% 6.6% 1.0%
Source: Own analysis and elaboration
Thomsen’s method suggests that the highest party loyalty rates appear in horizontal elections, meaning when choosing between PR deputies and MR deputies or between senators and deputies. For example, more than 90 percent of voters from the three main parties in Mexico cast a straight ticket when selecting between PR deputies and MR deputies despite having filled out different physical ballots. The opposite occurred between presidential and local elections when 67
percent of voters divided their ballot by choosing the PRD presidential candidate and a mayoral candidate from another party.
When comparing across parties in the presidential and congressional electoral races, Figure 3 shows an almost equal transfer of votes between the PRI and the PAN. 28 percent of the people who voted in favor of Josefina Vazquez Mota (PAN’s presidential candidate) voted for the PRI’s candidate for Congress, while 25 percent of those who cast a ballot in favor of Peña Nieto (PRI’s presidential candidate) also chose a PAN candidate for Congress. On the PRD side, the phenomenon of split-ticket voting between the PRD and the PAN was rather small (only 6 percent), which might reflect their ideological distance. Similar conclusions could be drawn when looking at split-ticket voting in presidential and city mayoral elections. The presence of split-ticket voting was larger between the PRI and PAN voters, while PRD voters were reluctant to split their ballots in favor of the PAN. These results suggest that split-ticket voting could have been motivated by party identification and ideology since fewer votes were transferred between a left-wing party (the PRD) and a right-wing party (the PAN).
Despite the fact that aggregate level data offered important information about voters’ behavior, it was important to complement the analysis using individual level data to compensate for estimation biases. In particular, Thomsen’s
33 method tends to overestimate the amount of split-ticket voting (Cleave et.al. 1995). It was possible to complement the results obtained through ecological inference estimation by taking advantage of the individual survey data that was gathered during the 2012 Mexico Panel Study.
Voters’ answers to the survey (Table 6) showed that levels of split-ticket voting in Mexico are rather low, compared to countries such as Brazil where it is around 70 percent (Ames et al., 2008). The individual data that showed the lowest rates of split-ticket voting were for the seats in Congress. This data suggested that there are differences between vertical and horizontal split-ticket voting. For example, levels of split-ticket voting are higher between president and governor (10.3 percent) than between senators and federal deputies (7.4 percent). This conclusion on differences across horizontal and vertical split-ticket voting was similar to what the analysis with aggregate data showed.
Table 6. Ticket splitting voting in the 2012 election
Senators vs Federal Deputies 7.4%
President vs Governor 10.3%
Source: 2012 Mexico Panel Data
The 2012 Mexico Panel Study Data also shows that among the three largest parties (see Table 7), the PRD is the party with more vote-splitters. In terms of specific races, it appears that split-ticket voting levels are smallest when
comparing deputy and senator races. This finding adds to the argument that horizontal split-ticket voting is less prevalent than vertical split-ticket voting. It is also important to notice that split-ticket voting for small parties is the norm. This makes sense, considering that many of these parties did not run a presidential or gubernatorial candidate, which explains why there is a 100 percent split vote when looking at the presidential or gubernatorial elections for small parties.
Table 7. Ballot splitting in federal and local elections (2012)
President - Deputy Deputy - Senator President - Governor Straight Split Straight Split Straight Split
PAN 91% 9% 93% 7% 86% 14%
PRI 89% 11% 94% 6% 87% 13%
PRD 79% 21% 89% 11% 86% 14%
Others 7% 93% 53% 47% 0% 100%
TOTAL 85% 15% 90% 10% 86% 14%
Number of Observations: President- Deputy: 843; Deputy- Senator: 829; President- State governor: 284 Source: 2012 Mexico’s Panel Survey
Source: Own analysis and elaboration
Comparing the ecological inference results to the 2012 Mexico Panel Study, it is possible to find differences in magnitude across vertical and horizontal splitting in all elections. However, in both analyses, vertical splitting is more frequent than horizontal splitting (see Table 8).
Table 8. Results of the ecological inference and the individual data analysis Deputies - Senator PR Deputies - MR Deputies* President - Deputies President – State governor* President – Municipal president* Thomsen’s method PAN 24% 4% 30% - 37% PRI 25% 4% 31% - 41% PRD 9% 1% 23% - 42% 2012 Mexico Panel Survey PAN 7% - 9% 14% - PRI 6% - 11% 13% - PRD 11% - 21% 14% -
* Not all elections were registered in the data bases, so it is not possible compare all the analyses results. Source: Own analysis and elaboration
Table 8 not only shows that there were differences across vertical and horizontal split-ticket voting, it also suggests that the results obtained through aggregate data could be overestimated. This analysis shows that the percentage of split-ticket voting was larger when looking at aggregate results than when using surveys. However, in both methods, the conclusions were the same: the percentage of horizontal splitting was smaller than vertical splitting. Of note in Table 7 is that the percentage of split-ticket varied, not only in magnitude but also across parties. For example, the PRD’s percentage was lower that the PRI’s and PAN’s when using Thomsen’s method, but it was higher than the rest of the parties in the Mexico Panel Study. A possible explanation for these differences is that, in a survey, people tend to say that they have voted for the winner, which would increase the percentage of split-ticket voting in this case. For example, if someone cast a straight ticket and voted for the PRD presidential candidate, it is likely that, when interviewed, this person will report having voted for the winning party (not the PRD, because the PRD lost the presidency). This is reported in the survey as a split-ticket vote, explaining why the percentage of PRD split-ticket voting was higher in the survey than in the aggregate results.
In summary, I found that the levels of split-ticket voting in Mexico lie in the middle of the spectrum when compared to other countries. When considering a
37 strict approach to split-ticket voting and counting the percentage of voters who split their vote in at least one electoral race (in the 2012 elections, voters received a separate ballot for each of the four races), the proportion of split-ticket votes reached up to 25 percent. However, the rates of split-ticket voting can vary when we compare specific races. For example, there was a 14.8 percent difference between split-tickets in presidential and congressional races and only a 9.8 percent difference between presidential and gubernatorial races, which suggests that vertical splitting is more frequent than horizontal splitting. The analysis using aggregate data shows that the Democratic Revolutionary Party (Partido de la
Revolución Democrática, PRD) was the party that was most affected by split-ticket
voting: in 67 percent of the municipalities with concurrent elections, the PRD presidential candidate received more votes than the PRD mayoral candidate.
Thomsen’s method for ecological inference (1987) was used to analyze aggregate data and estimate the percentage of voting transferred from one party to another. In this regard, I found that Josefina Vazquez Mota, the PAN presidential candidate in 2012, lost 28 percent of her votes to the PRI deputies (representatives from the lower house of Mexico’s Congress). Split-ticket voting between the PAN (right) and the PRI (center) was common, while it was less so between the PAN and the PRD (left). While this could suggest that ideology
influences the levels of split-ticket voting, I did not find evidence of this in individual level data.
Analysis of Explanatory Variables
While the aggregate and individual analysis shows the magnitude of the phenomenon, it does not explain the motivation for splitting ballots. The existing literature offers multiple hypotheses as to why this phenomenon takes place. In the following section, I have tested three explanations based on people’s motivations to vote for different parties in an election.
The question of why people choose one party over another has long vexed researchers. Some have argued that there are certain factors that influence people’s voting decision. Yet, the question remains: Why would voters choose candidates from different parties? As reviewed in the first part of this paper, there are multiple hypotheses to explain split-ticket voting. This section presents three of those explanations that I have tested using logistic regressions where the dependent variable takes the value of 1 or 0 depending on whether the individual stated to have voted for different parties or not (across all four ballots: president, governor, senator, and federal deputies). In this model, vote splitting was dichotomized as “0” for a straight party vote for all four positions and “1” for any form of split -ticket voting. Using this classification, there were 690 observations of straight
39 party voting and 177 of split-ticket voting. I began this analysis by running separate regressions to test each theory and then combining them to confirm the strength of the findings. I have analyzed vertical and horizontal split-ticket voting later on in this paper.
The three main hypotheses found in the literature that explain individual factors that motivate split-ticket voting are:
Hypothesis 1 (Policy Balancing): The policy balancing theory has its origins in the work of Alesina and Rosenthal (1989), who argued that moderate voters are looking for a middle ground policy and that they can obtain this by choosing candidates from parties with opposing ideologies. The idea behind this is that, under a divided government, the president and the congress will have to negotiate a policy that rests in the middle of their ideological positions. This theoretical framework is based on the U.S. model, where two major parties with different views compete. While there is evidence that supports the policy balancing theory in a bipartisan system where parties’ policy stances are divergent, this theory might be more difficult to prove in the case of Mexico. In a bipartisan system, moderate voters are the ones who split their tickets. Since Mexico has three major parties, moderate voters might find themselves lost in a context of multiple policy platforms, which might not be that clearly differentiated from each other. For
example, in 2012, both the PRD and the PAN offered similar goals on economic growth (the PRD candidate promised 6 percent growth and the PAN candidate, a 5 percent increase) despite the fact that they are on opposite sides of the political spectrum. The same often occurs with topics such as education, where most parties propose to increase government expenditure. To operationalize this hypothesis in the model, I have used people’s responses about their self-placement on the political spectrum; I expected that those who self-reported themselves as moderates would split their vote more than others. This variable had three values: “0” for individuals who placed themselves in the center, center-left, or center-right of the political spectrum; “1” for individuals who identified themselves on the right or left of the spectrum; and “2” for individuals on the far right or far left.
Hypothesis 2 (Candidate-Centered): In addition to the effect of factors surrounding parties’ policy platforms, the occurrence of split-ticket voting can also be influenced by candidate traits. If a certain party has a candidate who is more attractive to voters than the party in and of itself, it is possible that this candidate will draw voters from other parties. Campbell and Miller denominate this the “conflicting motives” argument (1957) and describe it as when “conflicted motivation reduces the pressure toward a party-oriented vote and opens the way to a divided ballot” (p. 311). In Mexico’s case, the 2012 presidential election was
41 the first time that a woman was a candidate for a major party; the PAN nominated Josefina Vázquez Mota. As a consequence, it is possible that some people voted for the PAN candidate based solely on her gender. At the same time, the PRI candidate was portrayed by the media as a young and handsome statesman (Serra, 2013), factors that could be attractive to female voters. To test this hypothesis, I measured the difference between the evaluation of the most-favored candidate and the evaluation of that candidate’s party.
Hypothesis 3: Parties are the labels that voters follow to cast their votes, and, therefore, the stronger voters identify with a party, the less likely they are to vote for another party. “A straight ticket is, after all, a straight party ticket, not a candidate ticket or an issue ticket” (Campbell and Miller, 1957:305). Party identification has also proven to be one of the most stable political attitudes in Mexicans’ voting behavior (Moreno, 2003). To test this hypothesis, I looked at voters’ self-positioning as strong, weak or lean partisans. I expect that those who consider themselves strongly aligned with a party will split their ballot less frequently if any.
These three hypotheses were tested using data from the 2012 Mexico Panel. The dependent variable was assigned a “0” or “1” value depending on whether the voter split their ticket or not. I used socioeconomic variables, including age,
gender, and education, as independent variables. I ran the three models on different types of elections to test each model independently. This allowed me to not only test for multiple explanations of why people split their vote, but also to see if these factors vary depending on the type of election (either vertical or horizontal). To test hypothesis 1 (policy balancing), I used the variable of ideology, where it was expected that moderates would have an increased probability of vote-splitting. Moderates were assigned a value of “0,” while people who placed themselves on the right or left of the scale were assigned “1,” and those on the far -left or far-right were assigned “2.” In the case of the candidate-centered hypothesis, this variable measures the difference between the evaluation of the most-favored candidate and the evaluation of that candidate’s party. This variables minimum is -7 and its maximum is 10, with a mean of 0.80. For the third hypothesis, the variables used to test the hypothesis of the strength of party identification was on a scale of “0” to “3,” depending on voters’ self-identification on the scale of party strength. For example, this variable was assigned the value of “3” when voters classified themselvesas “strongly PRI partisan,” a “2” when they declared themselves “weak PRI partisans” and a “1” when they “leaned PRI.” When voters declared themselves to be nonpartisan, the value of the variable was “0”.