On the Study of the Indoor Environment in Private Residences
Dorizas P.V.#1, Assimakopoulos M.N.#2, Santamouris M.#3#
Faculty of Physics, Department of Environmental Physics and Meteorology, University of Athens, University Campus, Athens, 157 84, Greece
1 [email protected] 2 [email protected] 3[email protected] Abstract
Epidemiological research has shown that exposure to particulate matter has been linked to adverse health effects. The present study aims at reporting the initial findings of an experimental campaign that was held in private residences in Athens with different degree of urbanization and environmental conditions. Measurements include particulate matter concentrations (TSP, PM10, PM2.5, PM1) and Ultrafine Particles (UFP). The experimental campaign was performed for more than one month in a typical urban apartment and a suburban detached house under normally occupied conditions. First results indicate that PM concentrations at the urban area significantly exceeded those of the suburban case under all operating and environmental conditions. In many cases where thresholds exist, particulate matter concentrations in the apartment exceeded the limit values. Occupants’ presence and indoor activities such as smoking, cooking cleaning etc. influenced the diurnal variation of particle concentrations. For certain particle sizes, indoor concentrations during the night where the indoor pollutant sources stopped functioning, the concentrations decreased. Power spectrum analysis was used to identify periodicities and trends of particulate matter concentrations. Spectral density comparison was also performed for particles of different size ranges as well as for particles of the same size in the studied residences. This is a preliminary study on the indoor environment in private residences in which process of initial data is presented. However measurements are ongoing and several additional parameters are being recorded.
Keywords – Indoor Air Quality; Particulate Matter; Ultrafine particulate matter; residences; indoor sources; Power Spectal Dencity
1. Introduction
Numerous epidemiological studies have documented that exposure to indoor air pollutants such as particulate matter (PM) of several sizes and especially those in the ultrafine size range (UFP) is related to human health effects. Some of these effects include allergies, asthma symptoms, cardiovascular and respiratory morbidity and even mortality [1].
Studying the degradation of indoor air quality (IAQ) in residences is of exceptional importance as people spend approximately 60% of their day in their homes [2]. Infants, young children, elderly and bedridden people spend even greater proportion of their day in their dwellings, being more susceptible to the adverse health effects from the exposure to indoor air pollutants [3].
Indoor household activities such as cooking and onion frying, tobacco smoking, wood burning, vacuuming, candle and incense stick burning have a large impact on indoor particle concentrations and variability [4, 5, 6, 7, 8]. Indoor particulate matter concentration levels are also affected by characteristics of the building’s envelope, ventilation airflow rates, meteorological conditions as well as outdoor pollutant concentration levels [9, 10].
Numerous studies have been carried out in Greek residences with regard to IAQ [10, 11, 12]. In the majority of these studies indoor pollutant concentration levels such as PM10, PM2.5, TVOCs and carbon dioxide (CO2) have been examined. Despite the adverse health effects from the exposure to UFP, to the best of our knowledge there are only two papers documenting UFP measurements in Greek residences [13, 8].
The present study aims at investigating the IAQ in two residences with different degree of urbanization in the greater area of Attika, Greece. In particular the main objectives are: 1. to report and compare the concentration levels of PM of several size ranges, CO2 and carbon monoxide (CO), in the two residences, 2. to investigate how and which indoor activities affect pollutant concentrations, 3. to identify periodicities and trends of PM time series through their power spectral densities (PSD) while comparing the PSD of PM of different sizes in the two residences.
2. Methodology
2.1 Sampling Sites and Measurement Period
The experimental campaign was performed in two residences of Attika in areas of different degree of urbanization. The first residence is a medium sized typical apartment on the 4th floor of a 6 storey building very near (approx. 4km) the city centre of Athens, hereafter denoted by U (urban site). The second dwelling is a detached mezzanine consisting of four floors in the eastern suburbs of Attica (approx. 20 km from the city centre of Athens), away from traffic emissions, hereafter denoted by S (suburban site). Both residences have double glazing windows installed and are naturally ventilated.
Measurements were conducted during July, August 2011 in the mezzanine of the suburban area (S) and during October, November, and December 2011 in the apartment of the urban area (U).
2.2 Instrumentation- Sampling Protocol & Data Analysis Tools
TSP, PM10, PM2.5,PM1 were measured using an airborne particulate monitor, Osiris (Turnkey Instruments Ltd). UFP concentrations were measured in real time using a portable particle counter, P-Trak (TSI, Model 8525). CO2, and CO were monitored using a photo acoustic multi-gas monitor, Innova type 1312 (AirTech Instruments).
The sampling devices in both houses were placed at 0.8 m height from the floor in the living room where the occupants considered spending most of their time (Fig.1, red dot). The occupants were asked to fill in a daily diary noting the exact time at the beginning, the duration and the ending time of any activity conducted that could possibly affect pollutant concentrations such as cooking, smoking, cleaning the house etc. The daily diaries will contribute to the determination and the verification of potential indoor PM production sources. The sampling interval of TSP, PM10, PM2.5, PM1 and UFP was 15 min. and of CO2 and CO was 5 min. For the better processing of data, the measured variables were interpolated to the same time and sampling step so as create a sample of the same length of simultaneous measurements. Statistical analyses were performed using Microsoft Office Excel 2007 and SPSS (SPSS Inc PASW Statistics 18). Interpolation and time series analysis were performed using MATLAB 2008 (MATLAB R2008a).
Fig. 1 Floor plans of the ground floor of the mezzanize, S (left) and of the apartment, U (right) (not to scale)
3. Results and Discussion
3.1 Particulate Matter Concentrations
Fig. 2 presents the distribution of PM (TSP, PM10, PM2.5 and PM1) concentrations in box plots in the residences of the suburban, S (blue, dotted) and the urban, U (red, striped) areas for the entire period of measurement. The upper quartiles (75th percentile) of PM10 and PM2.5 for both residences
are below their corresponding limit values recommended by the World Health Organization (WHO) [14]. The concentrations of all size classes of the apartment in the urban area are greater than the ones of the suburban area and are also present a stronger dispersion around the mean value.
Fig. 2 Box plots of TSP, PM10, PM2.5 and PM1 concentrations of the residences in the Suburban (blue) and the Urban (red) areas
Fig. 3 illustrates the corresponding distribution of UFP concentrations in box plots, in the two residences presented on a logarithmic scale for the entire period of measurement. Concentrations at the U site are by far greater than the ones at the S site. The increased indoor concentrations at the apartment at the U site are mainly affected by the increased indoor activities and are also possibly influenced by the outdoor vehicle emissions from the adjoining streets.
Fig. 3 Box plots of UFP concentrations of the residences in the Suburban (blue) and the Urban (red) areas
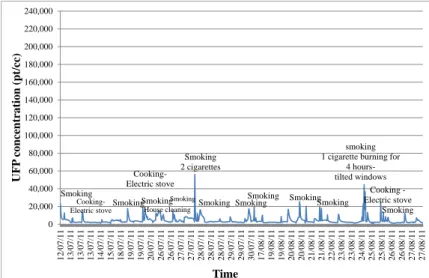
Fig. 4 and 5 indicate the UFP concentration variation at the two residences. The activities that took place in the houses are noted in the fluctuation diagrams, according to the information given by the indoor activity diaries. In most of the cases the peaks in the concentrations are explained by certain activities. The concentrations seem to decrease after the activities- sources stopped functioning.
The background levels of UFP concentrations in the S site were about 3,000 pt/cm3 (Fig. 4). Smoking is the major UFP source in the S site. When smoking occurred, from a single cigarette the concentrations increased by approximately six times reaching 20,000 pt/cm3. Cooking also increased UFP concentrations, however, it did not take place at the S site that often.
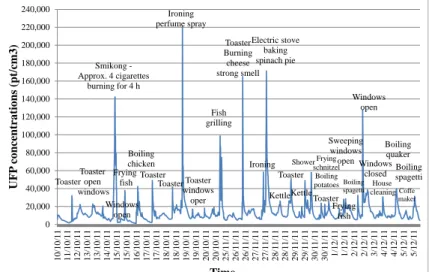
There is a greater fluctuation in the UFP concentrations of the U site compared to the S site (Fig. 5). This can be attributed to the prolonged presence of people as well as the increased indoor activities that took place in the apartment. The background levels at the residence in the urban area were about 10,000 pt/cm3. The major source of UFP production in the U site was cooking. In particular, the use of the electric toaster increased the background concentrations by four to five times. Boiling water in a kettle as well as cooking by boiling, lead to concentrations that ranged between 25,000 and 60,000 pt/cc. Baking and grilling using the electric stove resulted in greater UFP concentrations between 105,000 and 182,000 pt/cc. The extreme peak of 223,000 pt/cc of UFP concentrations occurred when ironing with a steam iron took place and body perfume was sprayed on the clothes.
Smoking
Cooking-Electric stoveSmoking
Cooking-Electric stove Smoking House cleaning Smoking Smoking 2 cigarettes
Smoking SmokingSmoking SmokingSmoking smoking 1 cigarette burning for
4 hours-tilted windows Cooking -Electric stove Smoking 0 20,000 40,000 60,000 80,000 100,000 120,000 140,000 160,000 180,000 200,000 220,000 240,000 1 2 /07/ 1 1 1 3 /07/ 1 1 1 3 /07/ 1 1 1 3 /07/ 1 1 1 4 /07/ 1 1 1 5 /07/ 1 1 1 8 /07/ 1 1 1 9 /07/ 1 1 1 9 /07/ 1 1 2 0 /07/ 1 1 2 6 /07/ 1 1 2 6 /07/ 1 1 2 7 /07/ 1 1 2 7 /07/ 1 1 2 8 /07/ 1 1 2 8 /07/ 1 1 2 8 /07/ 1 1 2 9 /07/ 1 1 2 9 /07/ 1 1 3 0 /07/ 1 1 1 7 /08/ 1 1 1 9 /08/ 1 1 1 9 /08/ 1 1 2 0 /08/ 1 1 2 0 /08/ 1 1 2 1 /08/ 1 1 2 1 /0 8 /1 1 2 2 /08/ 1 1 2 3 /0 8 /1 1 2 3 /08/ 1 1 2 4 /0 8 /1 1 2 5 /08/ 1 1 2 5 /0 8 /1 1 2 6 /08/ 1 1 2 6 /08/ 1 1 2 7 /08/ 1 1 2 7 /08/ 1 1 U FP co ncen tra tion ( pt /cc) Time
Toaster Toaster open windows Smikong -Approx. 4 cigarettes burning for 4 h Windows open Frying fish Boiling chicken Toaster Toaster Ironing perfume spray Toaster windows oper Fish grilling Toaster Burning cheese strong smell Ironing Electric stove baking spinach pie KettleKettle Toaster Shower Toaster Frying schnitzel Boiling potatoes Sweeping windows open Frying fish Boiling spagetti Windows open Windows closed House cleaning Boiling quaker Coffe maker Boiling spagetti 0 20,000 40,000 60,000 80,000 100,000 120,000 140,000 160,000 180,000 200,000 220,000 240,000 1 0 /10/ 1 1 1 1 /10/ 1 1 1 2 /10/ 1 1 1 3 /10/ 1 1 1 3 /10/ 1 1 1 4 /10/ 1 1 1 5 /10/ 1 1 1 5 /10/ 1 1 1 6 /10/ 1 1 1 7 /10/ 1 1 1 7 /10/ 1 1 1 8 /10/ 1 1 1 8 /10/ 1 1 1 9 /10/ 1 1 1 9 /10/ 1 1 2 0 /10/ 1 1 2 0 /10/ 1 1 2 5 /1 1 /1 1 2 6 /11/ 1 1 2 6 /11/ 1 1 2 7 /11/ 1 1 2 7 /11/ 1 1 2 8 /1 1 /1 1 2 8 /11/ 1 1 2 9 /11/ 1 1 2 9 /11/ 1 1 3 0 /11/ 1 1 3 0 /11/ 1 1 1 /1 2 /11 1 /1 2 /11 2 /1 2 /11 2 /1 2 /11 3 /1 2 /11 4 /1 2 /11 4 /1 2 /11 5 /1 2 /11 5 /1 2 /11 U FP co ncen tra tion s (pt /cm3) Time
Fig. 5 UFP concentration variation in the residence of the U site
Fig. 6 presents the indoor versus the outdoor PM10 concentrations distribution in the residence at the U site of a randomly selected day of the measurement period. The indoor concentrations are greater than the corresponding outdoor ones throughout the day. In particular, the indoor concentrations are increasing from 8.00 a.m. until 9.00 a.m. when the occupants are preparing breakfast (Coffee maker, toaster functioning). From 16.00 p.m. until 16.30 p.m. cooking performed were frying and boiling took place. This justifies the intense peak of PM10 concentrations at 16.35 p.m. During the night the indoor concentrations decrease and even reach the outdoor concentrations at about 4.00 a.m. The outdoor concentrations remain rather stable throughout day and night, however they seem to slightly increase in the afternoon from 18.00 p.m. until midnight.
Windows open for 10 min kettle boiling water Toaster Frying schnitzel boiling potatoes Washing dishes sweeping 0 20 40 60 80 100 120 140 160 180 0 :0 5 0 :4 5 1 :2 5 2 :0 5 2 :4 5 3 :2 5 4 :0 5 4 :4 5 5 :2 5 6 :0 5 6 :4 5 7 :2 5 8 :0 5 8 :4 5 9 :2 5 1 0 :05 1 0 :45 1 1 :2 5 1 2 :05 1 2 :45 1 3 :25 1 4 :05 1 4 :45 1 5 :25 1 6 :05 1 6 :45 1 7 :25 1 8 :05 1 8 :45 1 9 :25 2 0 :0 5 2 0 :45 2 1 :25 2 2 :05 2 2 :45 2 3 :25 PM 10 concent rat io ns (μ g/m 3) Time Indoor Outdoor
Fig. 6 Indoor versus outdoor PM10 concentration distribution at the U site on a randomply selected day (October 30th, 2011)
3.2 CO2 and CO concentrations
Fig. 7 presents the distribution of CO2 (left) and CO (right) concentrations in box plots at the two residences. The concentrations at the residence of the urban area (red, stripped) are greater than the corresponding ones of the suburban area (blue, dotted). The concentrations of CO2 at the dwelling of the urban area in many cases also exceeded the recommended by the WHO, threshold limit value. The great indoor CO2 concentrations of the site in the U area can be linked to the prolonged presence of the occupants within the apartment.
Fig. 7 Box plots of CO2 (left) and CO (right) concentrations of the residences in Suburban (blue dotted) and the Urban (red stripped) areas
3.3 Power Spectrum Analysis
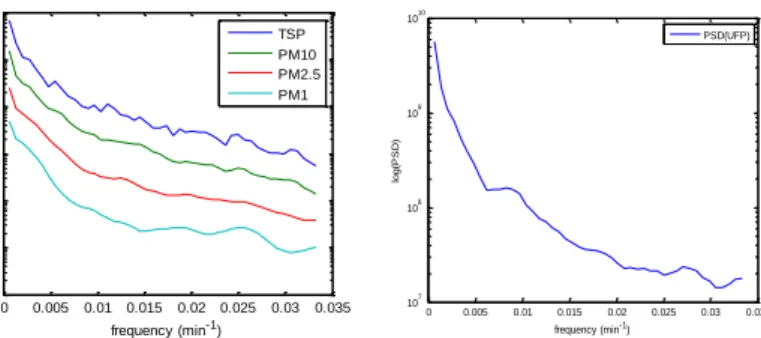
TSP, PM10, PM2.5, PM1 and UFP time series were converted over the frequency domain to spectral power densities through an algorithm called the ‘Fast Fourier Transform’ or FFT. FFT analysis was used to produce the power density spectrum so as to identify periodic oscillations and trends of the time series of the measured variables. Fig. 8 and 9 illustrate the distribution of spectral power density of the time series of particulate matter concentrations of all the measured size ranges in the two residences. The log Power spectral density (PSD) is presented in the vertical axis on a logarithmic scale. The horizontal axis shows the frequencies expressed in units of counts per minute (min-1). The power below the spectra is the density of the measurement for a certain frequency. Each spectral peak represents the corresponding prevalent frequency. Time series of particulate matter in both residences tend to have lower spectral power at higher frequencies. The PSD curves of TSP, PM10, PM2.5 and PM1 in both residences are similar and their trend lines are almost parallel (Fig 8 and 9 left). However, the larger the particle size the greater the power spectrum it contains. The power spectrum of greater frequencies (>0.01 min-1) is rather flat, containing equal power at different frequency bands, meaning that the fluctuations are random and can be considered as white noise processes. The slopes of the PSD curves of the UFP time series are steeper compared to lager particles and peak close to zero frequency bands in both cases (Fig. 8 and 9, right graphs).
0 0.005 0.01 0.015 0.02 0.025 0.03 0.035 10-1 100 101 102 103 104 105 frequency (min-1) lo g (P S D ) TSP PM10 PM2.5 PM1 0 0.005 0.01 0.015 0.02 0.025 0.03 0.035 105 106 107 108 109 frequency (min-1) lo g (P S D ) PSD(UFP)
Fig. 8 PSD of PM10, PM2.5, PM1 (left) and UFP concentrations (right) at the residence of the suburban area
0 0.005 0.01 0.015 0.02 0.025 0.03 0.035 10-1 100 101 102 103 104 105 frequency (min-1) lo g (P S D ) TSP PM10 PM2.5 PM1 0 0.005 0.01 0.015 0.02 0.025 0.03 0.035 107 108 109 1010 frequency (min-1) lo g (P S D ) PSD(UFP)
Fig. 9 PSD of PM10, PM2.5, PM1 (left) and UFP concentrations (right) at the residence of the urban area
4. Conclusions
This paper reports pollutant concentration levels in two residences of Attika of different degree of urbanization. In particular TSP, PM10, PM2.5, PM1, UFP, CO2 and CO were measured in a typical apartment near the city centre of Athens and in a detached mezzanine at a suburban area of the greater Attika area. Results indicate that the pollutant concentrations in the residence of the urban area exceed by far the corresponding concentrations of the residence in the suburban area and in many cases they also exceeded the recommended thresholds. The operation of indoor sources as well as the occupants’ indoor activities seemed to influence by far the indoor concentrations of both residences; and especially those of the apartment in the urban area in which more pollutant sources were present. The indoor PM concentrations seemed to decrease during the night right after the end of operation of indoor sources such as cooking. However, in the absence of activities the concentrations did not fell below 3,000 pt/cc at the residence of the suburban area and below 9,000 pt/cc at the house of the urban area. Power density spectrum of PM time series was produced using the FFT analysis. PSD curves of TSP, PM10, PM2.5, and PM1 in both residences were similar. Time series had larger spectral power at lower frequencies in all size ranges. However, for greater frequencies the power spectrum was rather flat indicating an equally distributed power density. In was also observed that the coarser the particles, the greater the spectral power they contain. The slope of the power spectrum curves of the UFP for both residences was greater compared to larger particles, meaning that the spectral power of particles in the ultrafine size range is diminishing by far as we move to greater frequency bands.
Acknowledgments
This research has been co-financed by the European Union (European Social Fund – ESF) and Greek national funds through the Operational Program "Education and Lifelong Learning" of the National Strategic Reference Framework (NSRF) - Research Funding Program: Heracleitus II. Investing in knowledge society through the European Social Fund.
References
[1] D. W. Dockery, C.A. Pope Iii, et al. An association between air pollution and mortality in six U.S. cities. New England Journal of Medicine. 329 (24) (1993) 1753-1759.
[2] J. D. Spenglerand and K. Sexton. Indoor air pollution: A public health perspective. Science. 221 (4605) (1983) 9-17.
[3] N. E. Klepeis, W. C. Nelson, et al. The National Human Activity Pattern Survey (NHAPS): A resource for assessing exposure to environmental pollutants. Journal of Exposure Analysis and Environmental Epidemiology. 11(3) (2001) 231-252.
[4] A. R. Ferro, R. J. Kopperud, et al. Source Strengths for Indoor Human Activities that Resuspend Particulate Matter. Environmental Science and Technology. 38(6) (2004) 1759-1764.
[5] A. Afshari, U. Matson, et al. Characterization of indoor sources of fine and ultrafine particles: A study conducted in a full-scale chamber. Indoor Air. 15(2) (2005) 141-150. [6] B. Wang, S. C. Lee, et al. Characteristics of emissions of air pollutants from burning of incense in temples, Hong Kong. Science of the Total Environment. 377(1) (2007) 52-60. [7] L. Wallace, F. Wang, et al. Contribution of gas and electric stoves to residential ultrafine particle concentrations between 2 and 64 nm: Size distributions and emission and coagulation rates. Environmental Science and Technology 42(23) (2008) 8641-8647.
[8] T. Glytsos, J. Ondráček, et al. Characterization of particulate matter concentrations during controlled indoor activities. Atmospheric Environment. 44(12) (2010) 1539-1549.
[9] O. O. Hänninen, E. Lebret, et al. Infiltration of ambient PM2.5 and levels of indoor generated non-ETS PM2.5 in residences of four European cities. Atmospheric Environment. 38(37) (2004) 6411-6423.
[10] M. Santamouris, A. K. Georgiou M. et. a. Indoor Air Quality in Fifty Residences in Athens. International Journal of Ventilation. 5(4)(2007) Pages 367-380.
[11] C. C. Halios, C. G. Helmis, et al. A comparative study of the main mechanisms controlling indoor air pollution in residential flats. Water, Air, and Soil Pollution. 204(1-4) (2009) 333-350.
[12] D. E. Saraga, T. Maggos, et al. PM 1 and PM 2.5 ionic composition and VOCs measurements in two typical apartments in Athens, Greece: Investigation of smoking contribution to indoor air concentrations. Environmental Monitoring and Assessment. 167(1-4) (2010) 321-331.
[13] E. Diapouli, A. Chaloulakou, et al. Levels of ultrafine particles in different
microenvironments--implications to children exposure. The Science of the total environment. 388(1-3) (2007) 128-136.
[14] WHO, World Health Organization. Air quality guidelines- global update. World Health Organization Regional Office for Europe, Copenhagen, Denmark 2005