Submitted to: Steve Skerlos University of Michigan
Team 881-5:
Matthew Knoth ([email protected]) Ying Tan ([email protected]) Adelchi Tiboni ([email protected]) Hector Valerio ([email protected])
Table of Contents
Executive summary: ... 3
1. Introduction ... 4
2. Description of Baseline Product Being Improved ... 7
3. Design Ethnography ... 8
4. Persona Description ... 11
5. Product Requirements and Specifications ... 11
6. EvaluLIGHT Sustainability Evaluation ... 13
7. Sustainability Evaluation of Baseline ... 16
8. Concept Generation for Environmental/Social Improvement of Baseline ... 17
9. Concept Selection Process ... 17
10. Alpha Design Concept Description ... 18
11. Alpha Design Feedback ... 21
12. Final Concept Description ... 23
BUSINESS PLAN ... 25
13. Company Description ... 25
14. Market Analysis ... 25
15. Product Description ... 26
16. Marketing and Sales Strategy ... 27
17. Corporate Financing of Product ... 29
ADDITIONAL REFLECTIONS ON PROJECT OUTCOME ... 30
18. Why is the project likely to be consistent with an eco-efficient or sustainable design? ... 30
19. Design Critique ... 31
20. Recommendations ... 32
21. Acknowledgements ... 33
22. References:... 34
Appendix I: Team Introduction... 35
Appendix II: Design Ethnography ... 37
Appendix III: Additional Concepts ... 44
Appendix IV: Alpha Design Persona Survey ... 45
Executive Summary:
There are many lighting technologies in residential, commercial, industrial, and outdoor consumer sectors. With all the choices available, the lighting products impact Economic, Social, and Environmental (the triple bottom line), while there isn’t a tool available which allows inexperienced general users to evaluate their needs and lighting options as they relate to the triple bottom line of sustainability. Additionally, the tools which do exist, predominantly economic analysis tools, are usually too complicated for users to use quickly and effectively. Essentially, the marketplace complexity coupled with the inexperience of customers leads to inaction.
Based on our research we were able to identify several baseline tools which had some desirable features. While reviewing those baseline tools we were able to identify shortcomings with respect to each aspect of sustainability. The business as usual approach (existing limited tools) impact on environmental and social sustainability are limited as evidenced by the low adoption rates of newer more sustainable lighting options The main underlying common theme is that there is not a single tool which is simple to use and allows a user to evaluate all aspects of sustainability. We used these baseline tools and information gained through our research to develop a set of specifications and requirements which should allow more users to obtain a more comprehensive analysis on their lighting choices. The end result was a comprehensive tool called EvaluLIGHT. Unique to EvaluLIGHT is the ability to evaluate all aspects of the triple bottom line, far more comprehensively than existing tools.
Although there are numerous tools available which are similar to EvaluLIGHT, none approach sustainability with the comprehensive approach employed by EvaluLIGHT. In order to achieve a truly sustainable design one must consider all aspects of sustainability, this is exactly what EvaluLIGHT aims to do. EvaluLIGHT stands alone in the landscape of lighting analysis tools as it pertains to social impacts of lighting options. Additionally, it is also the only tool which quantifies hazardous waste impacts of various lighting options. Overall however, EvaluLIGHT makes significant improvements in eco-efficiency to the point where the tool crosses slightly into the realm of sustainability.
The process used to achieve the resulting final proof of concept design described herein was a PLAN, DO, Check, Act process. In the first phase we used ethnographic research to determine needs and identify a persona. From those needs and persona were able to perform technological research where we identified the advantages and disadvantages of existing tools. This research along with other information from the “PLAN” phase, allowed for the development of product requirements and specifications. Armed with the needs, product requirements and specifications, technological research, and persona description, the “DO” phase is where several concepts were generated then down selected. After down selecting the Alpha design of the tool was developed.
Upon completion of the Alpha design, the team moved into the CHECK” phase of the design process. Within this phase we gathered feedback, from members of the persona, on the effectiveness at meeting the design specifications and needs of the persona. Following the “CHECK” phase was the “ACT” phase where persona feedback was incorporated into product improvements.
1. Introduction
The goal in this project is to develop an intuitive and easy to use sustainability analysis tool for consumers. The current marketplace contains multiple tools which primarily focus on simplistic economic analysis such as return on investment. With an increasing focus on sustainability and a complex landscape of product choices, there is an ever increasing need for consumers to be able to evaluate their options. The current available tools are designed more for individuals with in depth knowledge of lighting technology, electricity generation, environmental considerations, and finance. A new tool is needed in order to provide a more comprehensive and standardized lighting sustainability analysis where all three aspects of sustainability can be evaluated with a single tool.
What problem is being addressed and what initiated the project?
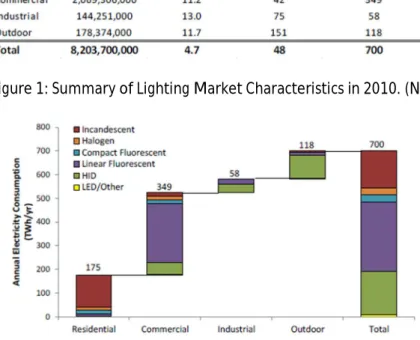
Approximately 700 TWh of electricity is consumed annually in the U.S. and can be divided into four sectors: residential, commercial, industrial, outdoor. As shown in Figure 1, the hours of use, number of lamps, and average lamp wattage varies quite drastically amongst the four sectors. Upon further analysis it can be seen that the bulb technology is quite different amongst industry sectors as shown in Figure 2. What is also clear when analyzing Figure 2 is that more efficient technologies such as CFL and LED are slow to be adopted. Among the outdoor lamps, high pressure sodium (HID) technology has the highest 83% of installed wattage in 2010, while LED luminaires are installed as low as 1.5%.
Figure 1: Summary of Lighting Market Characteristics in 2010. (Navigant 2010)
Figure 2: Lighting Electricity Consumption by Sector and Lamp Type in 2010. (Navigant 2010)
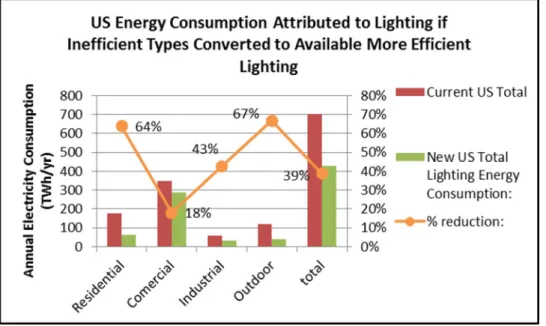
Interestingly enough there is significant potential for improvements to lighting sustainability if some of the newer lighting technologies were adopted in greater numbers. As indicated in Figure 3, if
each of the four industry sectors were to convert all of their lower efficient lighting types into currently available more efficient types there could be as much as 39% reduction in overall annual energy consumption (nearly 270 TWh/yr ) associated to lighting in the United States.
Figure 3: Electricity savings potential (by lighting sector) for converting to efficient lighting types.
LED luminaires are efficient, low wattage consumption, longer life, smart controlled tracking and it is available in the market now by quite a few lighting manufacturers , however, LED luminaires are not widely used (for example Figure 4 shows street lighting use).
and there are many factors why LED technology are not moving forward now in the outdoor lighting sector: 1) high initial LED cost and capital investment despite a recovery in the long term, 2) LED technology is constantly changing and the price keeps going down, the utility companies are not certain of the optimal time to invest. 3) The outdoor lighting are typically investor-owned utilities, municipally owned utilities or a cooperatively owned utilities. The utility companies have difficulty determining the cost benefit in continuing to provide the higher power levels to the light ensuring consistent revenue, vs. savings in fixed expenses such as electricity and maintenance. (Gabe 2012)
The key factor to change from less to more efficient and sustainable lighting technologies is the willingness to change, and it is a challenge due to many risks must be addressed. One successful case converting two-thirds of all outdoor lights to LED is the state of Vermont. (Gabe 2012) There were growing interests from the utility’s customers to convert to LED, however, proposals were all turned down by the utility companies. Until one of the three companies agreed to move forward because their desire as a customer focus and “green” company. Later all three utility companies signed up to move forward to LED conversion. By 2014, Vermont statewide will convert two thirds of streetlights to LED technology.
The learning from Vermont case is for the utility willing to convert to LED, the first step is to have the customers educated in the benefits in LED and their willingness to change. The customer’s strong willingness triggered the utility companies to change to be more sustainable. This is why Clinton Climate Initiative in 2010 promoted LED for outdoor lights and there was a cost benefit analytical EXCEL tool created by the Department of Energy (DOE) for small business and municipalities customers. In addition, there are many public resources annually published by different energy bureaus. However, the DOE tool required basic knowledge in engineering and financial accounting, also user might also need to research some additional information outside of the tool in order to the final analysis.
Despite the fact that consumers are becoming more aware of more sustainable lighting options, there are still low adoption rates. The complexity of the marketplace and sustainability as a whole make it difficult for consumers to evaluate their options. Although there are multiple tools available to assist in these evaluations, they typically only focus on the economic aspects of sustainability and they are difficult for the average consumer to use. Most people do not have the necessary expertise to be able to evaluate the triple bottom line of sustainability (Economic, Environmental, and Social) for various lighting options and therefore this leads to inaction. Hence, a more comprehensive, user friendly, zero cost evaluation tool is needed to assist consumers in quickly and accurately evaluating lighting sustainability.
Why is this problem relevant with regards to environmental and/or social perspectives?
Consumers lack a true picture of the impacts of their lighting choices. Most tools only evaluate economic aspects of sustainability but strictly look at ROI calculations. There are very few tools which attempt to estimate carbon dioxide emissions impacts; however there aren’t any tools which estimate nitrous oxide or sulfur dioxide emissions, two additional pollutants of concern. A second aspect of the environmental side of lighting sustainability is related to materials used in the production of the various lighting types. Certain types of lighting are constructed of or utilize hazardous materials in their production and many consumers are unaware of such information. Furthermore, there are no tools which evaluate or even mention the issue of hazardous material generation. Likewise, there are no tools which even acknowledge that there are social impacts as well. As an example; reduced maintenance has at least two considerations, one is reduce occupational hazard/liability but also reduction of work hours on light maintenance and improved worker efficiency for other maintenance tasks or additional job responsibilities. It is clear that a more comprehensive tool needs to be created such that consumers are better educated on the overall sustainability impacts of their lighting choices.
How have others tried to address this problem or similar problems?
There are several user tools as described later in this report, but they provide different results and they are not necessarily user friendly to allow an average consumer an easy to navigate system giving them functional data with which they can make a decision. If a user has the goal of reducing carbon emissions and not necessarily cost savings, the tool will allow them to evaluate this with reasonable accuracy and unless they are knowledgeable in the areas of engineering, financial accounting, social impacts, environmental impacts.
What ethnographic was done to supplement work done previously?
We created a detailed ethnographic research plan and also performed many benchmarking on the existing tools. Due to lack of awareness and existing easy energy saving tool usage, we can see there is a need to have a better tool for the end users to generate willing to energy saving in outdoor lighting.
Based on The research completed what was found was there isn’t a comprehensive simplistic tool which users can use evaluate the sustainability of their lighting. Most tools are too complicated for the average user to use and they don’t cover all aspects of sustainability. Additionally, the limited tools which are available aren’t well known or advertised.
In order for the project to be successful the following tasks need to be completed. Develop a tool with the following characteristics:
Simple to use (GUI) little to no functional knowledge in the areas of analysis (engineering, technical, financial accounting, social impact, environmental impact) allowing users to evaluate sustainability.
Useful for both commercial and residential analysis.
Application capable of running on smart phones and tablets.
Easy name to remember for ease of advertisement and user attraction. Easily marketed will lead to higher use. TV advertisement, monthly utility bills, home center advertisement, etc. The current proposed name is “EvauLIGHT”.
Keeps abreast with specifics of latest technology for up to date analysis.
Allows users to compare specifics of their use with peers and potentially collaborate with them for improvements. (social network and pressure)
Research the details on tools currently available for information on what works and what does not work. Research methods for environmental and social sustainability scoring (i.e. LEEDS, EPS, DOE, etc.) which can be incorporated into the tool.
Develop database of base lighting in order to allow users to perform analysis with little data entry.
There are multiple tools available for users to perform analysis with. They range from simple calculators to more complex GUI lead estimation tools. For example, one of the better tools (Con Edison’s lighting analysis tool) the user interface is fairly straight forward and the tool works fairly well however, as with most of the competitive tools there are areas where improvements are needed. For example, it requires the user to provide information such as cost of baseline and comparative bulbs, as well as determine which comparison bulb wattage will provide an equivalent amount of lighting. This makes it difficult as the users often are not able to determine the correct comparative wattage and using the incorrect comparison bulb flaws the analysis. Also, this tool focuses on reducing energy consumption and Carbon emissions. However, other environmental impacts such as hazardous materials or other emissions such as SO2 and NOx are not evaluated nor does it have the ability to compare or recommend LED lighting options. Furthermore, social impacts are almost entirely ignored in ever available tool. Most importantly however is that most every currently available tool primarily focuses on economic sustainability analysis and are typically designed for use by individuals with a reasonable amount of knowledge in the area of economics and finance.
3. Design Ethnography Step 1: Guiding Questions
Are new lighting technologies gaining acceptance?
How do people evaluate advantages and disadvantages of choices? How easy is it for users to evaluate sustainability?
Current Baseline Bulbs Related Questions:
What is your primary sector of interest in lighting, residential, commercial, or industrial? In the primary sector you selected, what is the type of bulbs used in majority?
What types of current light bulbs are used and the wattages, and how many hours used per day in average for spring/summer time and for fall/winter time?
Did you know that based on the sector, the utility rate is discounted differently? Do you know what renewable generation initiative is?
Are you aware if your municipality or electricity providers offer renewable generation incentive? Where do you shop for lighting equipment?
Do you consider yourself an energy conscious person? What are the ways you do to save energy in lighting? (Energy efficient, turn off lights, use less lights in one room, etc.)
What motivates you to minimize your light energy usage?
What deters you from minimizing your light energy usage?
Are you satisfied with the current bulb selection? If so, why, If not, why not?
Have you considered any alternative from the current bulbs?
What kind of technologies of bulbs in the market that you are aware of?
Did you know new light bulb technologies such as (but are not limited to) mercury vapor,
high pressure sodium, low pressure sodium, fluorescent, incandescent, metal halide,
induction, and LED?
Prior to this questionnaire, are you aware that every product in the market has different
levels of environmental impacts such as CO2 emissions, water waste, and hazardous
material generation?
Besides cost saving benefit the light bulb selection, would you consider environmental
and social impacts of manufacturing the light bulbs? How important are environmental
and social factors to you?
When buying replacement bulbs, do you consider more energy efficient bulbs?
Have you researched on tools that could improve your light energy usage? Have you
used these light energy usage saving tool? If so, where did you hear about the tool?
how did you access to the tool?
What do you like the most about the current tool? What do you dislike the most about
the current tool?
Would you be interested in a user friendly graphical tool that determines the better
replacement bulbs of your current bulbs with months of return on investment,
cumulative CO2 emissions comparison and cumulative hazardous material generation
comparison? If so, why this would interest you?
What other information would you like to see from this user friendly tool?
Step 2: Definition of Who - Users and Stakeholders
business or municipality which does not have the ability to hire an expert (or have one on staff) to perform lighting system analysis. This would typically be small to mid-size energy consumers; small cities, small businesses, shopping centers, residential, small commercial (warehouses), etc.
Manufacturers, retailers, and utility companies all have a stake in successful development of such a tool. For example, manufacturers and retailers would have a vested interest if the tool drives consumers to make choices to purchase higher margin products. Also a utility company will benefit by reduced base load mitigating the need for additional capacity as new plants are facing rapidly escalating regulatory and cost pressures.
Step 3: Existing information gathering
The current marketplace contains multiple tools which primarily focus on simplistic return on investment analysis as a means of determining benefits of different lighting technologies. These tools are designed more for individuals with in depth knowledge of lighting technology, electricity generation, environmental considerations and finance. Also, many of the tools are manufacturer specific tools which direct consumers to specific manufacturer products.
Step 4: Data collection Methods Observation –
Observe home improvement store and customers to determine preference and adoption of more efficient lighting technologies.
Literature Research –
Review existing sustainability evaluation tools.
Review adoption rates of more sustainable lighting technology. Interviews
-Interview consumers to get a sense of light types, use, and consumer awareness/sentiment.
Interview to know the motives of the exchange of lamps, in addition to whether the person used tools to evaluate.
Interview utility companies with efficient lighting programs to understand consumer acceptance, motivation for company, financial justification, etc.
The observations will be made in electrical supply stores, small businesses, apartment complexes, small shops and malls. This observation will be made before the development and application of this tool, so that the collected data is recovered. Thus we can identify the main needs of our clients. Interviews will also follow the observations in order to further define the user requirements and understand their behaviors.
4. Persona Description
Two personas have been identified as possible users of this tool. The primary persona will be a technically advanced user looking for a way to analyze and improve the sustainability of their lighting options. This persona could be a sole individual or acting on behalf of a company. In the latter case, the user would typically be employed by a company which emphasizes “green” or “sustainable” business practices. In the instance of the lone individual, this person would typically be an early adopter and of emerging energy technologies and sustainable living. This persona was considered our primary persona as the team felt that by developing a tool to meet this persona’s needs we could easily de-content it in order to meet the needs our our secondary persona described below.
The secondary persona can be described as
a novice, inexperienced, and non-technical
consumer. The typical user which falls into this category would be an individual whom seeks to
evaluate lighting options primarily for economic sustainability and may or may not be aware of
impacts on the other two categories of sustainability. This individual would typically not
possess the working knowledge necessary to perform the analysis and be employed by a small
to midsize businesses as they usually don’t have the resources to hire a lighting expert in order
to perform a sustainability analysis.
5. Product Requirements and Specifications Requirements
-The tool shall calculate the capital investment for different lighting types and compare the baseline capital investment to the proposed lighting type capital investment.
-The tool shall calculate the ROI period of the optional bulb.
-The tool shall calculate the emissions attributed to the electricity used in the lighting analysis.
-The tool shall allow the user to evaluate participation in their utility company’s renewable generation portfolio. (i.e. many utility companies offer their customers the option to obtain a portion of their electricity from renewable generation sources as a means of emissions reduction).
-The tool shall recommend a bulb wattage for the type of optional lighting being analyzed by matching the light output to the baseline bulb.
-The tool shall calculate the amount of hazardous waste generated and contained within the bulb based on the bulb types analyzed.
-The tool shall estimate the reduction in maintenance hours and expense.
-Ability to run a system analysis with multiple bulbs and obtain a cumulative summary.
-The tool shall generate a report comparing the baseline and optional bulb based on the calculations required above. The report shall be easy to read with graphs and data where appropriate.
-User selectable replacement bulb type for evaluation against the baseline. The tool shall auto-select a suggested bulb power to meet similar light output.
-Utilize the user inputs of state and type of electricity customer to determine: The mix and ratios of generation technologies used in their state as well as the cost of electricity in their state. This data must be pulled from the EIA @ http://www.eia.gov/.
-Help menus and/or mouse overs describing various data entry fields where user input is required. The descriptions shall describe the data which is required as well as a brief description of how the input impacts the overall output of the tool. There should also be information on the assumptions made where applicable.
Specifications/Targets
-Calculate emission and output results in lbs/year. -Calculate hazardous materials waste in lbs/year. -Calculate costs in USD.
-Calculate ROI in months.
-User selectable common bulb types:
Residential: Incandescent, halogen, CFL, LED
Commercial/Industrial: Florescent Tube Light, halogen, High Pressure sodium, low pressure sodium, Metal Halide, mercury vapor.
-Give pictorial representations of bulb types as well as written descriptions for assist in user selection. -Selectable power consumption for bulb based on selection of bulb type. The user shall be able to select the wattage of bulb which will depend dynamically on the type of bulb chosen to analyze.
-User shall be able to select the state which they live in and type of electricity customer they are (commercial or residential).
-Web based tool capable of being utilized on portable computing platforms such as tables, smart phones, etc. (HTML script)
-Summarize and calculate hazardous material use/waste of bulbs which will need to be disposed of at end of life in terms user identifiable units.
-Quantify social impacts (reduced maintenance, lower work hours for maintenance, safety impact, etc.) This information will be based on user inputs such as labor rate and hours of maintenance performed.
6. EvaluLIGHT Sustainability Evaluation Step 1: Use Context
What should the product be used for? - The central focus of the tool is assist consumers in evaluating the sustainability of various lighting options. This includes economic, environmental, and social aspects of sustainability.
What should the product do? – The tool shall possess several key characteristics; ease of use for consumers (i.e. intuitive user interface and use), radially available, outputs shall be in units of significance to the user, perform comparative sustainability analysis for evaluating various lighting options, transparency on how analysis’s are performed and what assumptions are made.
Who will use the product? – The target user of this tool will be consumers in residential application or small business applications who seek improvements in lighting sustainability but do not have access to the resources required to perform the analysis with the current available tools. Additional stake holders will include lighting manufacturers, distributors, and installation technicians.
What is the frequency of use and length of life for the product? – It is expected that the tool will be continually updated with the latest information and be readily available for users. In most instances the tool will be used when doing larger lighting projects/conversions however it would also allow users to evaluate each purchase very quickly and easily.
What is the target geographic location? – The initial scope of this tool is to develop it for the US market. However, the concept is modular in that, provided the right information is input into the tool, the concept could be expanded into other markets.
Step 2: Environmental Impacts Overview
Impacts of EvaluLIGHT alone - The tool itself will have minimal environmental impacts. Since the tool will be software based, there is no direct use of raw material. However, the initial development of the tool will require a modest amount of computing capability. Additionally, ongoing tool maintenance and updating will aslo require processing and server resources. Additionally, distribution of EvaluLIGHT will be virtual, thereby reducing the environmental impact of traditional product distribution.
Impacts EvaluLIGHT may have on the lighting industry - The primary goal is to provide an easy to use tool that can give users a comprehensive analysis of their lighting sustainability. With that users will be more apt to choose different lighting options in order to meet their sustainability goals. Depending on each individual user’s goals, there may be changes in environmental impacts. For example, if a user is focused on improving their economic sustainability they may find it best for them to convert from incandescent to CFL lighting. This would certainly improve the variable costs associated with lighting as well as the reduce harmful emissions associated with electricity generation, however it would increase the amount of hazardous waste generated by that user. One aspect however is the tool can help educate consumers and identify proper disposal methods for technologies such as CFL’s once they reach their end of life. Essentially, EvaluLIGHT will allow the user to evaluate these aspects and make value judgments based on their individual goals.
Step 3: Environmental Profile
The environmental impacts are split into four categories so they can be compared. Additionally the categories can be sub-divided in order to evaluate them with regards to EvaluLIGHT itself as well as EvaluLIGHT’s impacts on the lighting industry as a whole.
Materials
EvaluLIGHT - The materials used are related to the stage of development, namely computers, tablets and smart phones. Print materials will also be used for development and marketing. Lighting Industry – As mentioned previously, EvaluLIGHT will likely cause shifts in the material composition of lighting. For example, a couple of changes could be lighting industry increase use of polymers (LED technologies) and increases in hazardous materials (CFL lighting). These changes could potentially have adverse impacts on the environment if they are not properly handled.
Energy
EvaluLIGHT – The tool will be capable of running on various computing platforms therefore the primary source of energy used will be electrical energy. It is not expected that the use of this toll will create an appreciable increase in electric power consumption relative to the base load of society.
Lighting Industry – One aspect of the tool is to allow users to evaluate the emissions and economic aspects of their lighting options. The analysis will generate transparency and encourage users to choose lighting which consumes less energy. This will also have the effect of decreasing the emissions that are associated with fossil based electricity generation technologies.
Chemicals
Lighting Industry – Some of the lighting technologies which may prove favorable in one dimension, economic, will be unfavorable in the realm of hazardous materials. It may be critical to improve disposal processes to handle the increased use of these types of lighting.
Others
EvaluLIGHT – We will use a small office to keep the tool updated and ready for use in new devices.
Lighting Industry – Safety may be improved by causing a shift to longer lasting and more efficient lighting technologies which leads to less maintenance. The reduction in maintenance reduces the chances for accidents as some lighting can be installed in locations which are difficult to service.
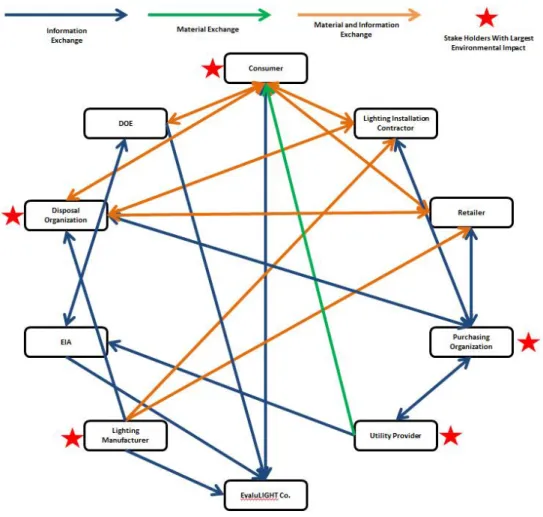
Step 4: Stakeholder Network
The stake holder network identified in Figure 5 below shows the material and information exchanges between various stakeholders. Additionally, key stake holders have been identified showing those who have the potential for the largest environmental impact.
As seen in the stakeholder network map above, there are several stake holders involved with a lighting analysis tool. Of the various stake holders there are five main groups which have the largest influence over the resulting environmental impacts of the lighting used. Generally speaking these key contributors are where material is exchanged or key decisions are made. Ultimately however, the key stakeholder for bringing EvaluLIGHT from concept to adoption would be the consumer. In smaller organizations the consumer will fill various roles identified but most importantly the purchasing decisions. Being able to alter those purchasing decisions is ultimately what is needed in order to improve the sustainability of the lighting industry.
7. Sustainability Evaluation of Baseline
EvaluLIGHT seeks to better the currently available tools which are limited in their scope and purpose. For example, in one of the better tools (Con Edison’s lighting analysis tool) the user interface is fairly straight forward but it requires the user to provide information such as cost of baseline and comparative bulbs, as well as determine which comparison bulb wattage will provide an equivalent amount of lighting. This makes it difficult as the users often are not able to determine the correct comparative wattage and using the incorrect comparison bulb flaws the analysis. Also, this tool focuses on reducing energy consumption and Carbon emissions. However, other environmental impacts such as hazardous materials were not taken into account with this baseline. (For example, CFL bulbs are more efficient than incandescent bulbs, but it have higher levels of hazardous materials such as mercury). Furthermore, other emissions such as SO2 and NOx are not evaluated nor does it have the ability to compare or recommend LED lighting options. Finally, business as usual does not evaluate social implications of the lighting chosen.
This narrowly focused tool which is also not well marketed and certainly not a comprehensive industry standard tool. Like many of the tools available, it provides limited capability. What this leads to are the following characteristics in the lighting industry:
-Low adoption rates of new lighting technologies, as seen in Figure 5 above.
-Inability to accurately quantify emissions related to the use of electricity means that users are unaware of the emissions they are generating by using lighting. Each geographic location has a different mix of electricity generation types.
-Inability to accurately quantify the potential hazardous waste generation. This means users are left uninformed of the implications of their lighting choices. Additionally, users are left ill-informed on the issues which may surround the use of traditional disposal practices for various lighting types.
-Minimal consideration of the social impacts associated with reduced maintenance (improved safety but reduced work hours) and use/disposal of hazardous materials.
8. Concept Generation for Environmental/Social Improvement of Baseline
Brainstorming was a key factor in the concept selection. The group factored ideas based on our baseline and other benchmarked available solutions. We generated different flavors of concepts, the three major categories of our concepts are: Software type (website, MAC, PC, Mobile), auto populate versus user manual input bulb information, and a database pre-integrated to the tool versus user research data. We weighted the advantages and disadvantages of these methods, some more obvious than others, and we came up with the following:
*Concept 1: Standalone hardware bundled with Software for lighting assessment (like a multi-meter or other purpose built hardware device) in which the user will manually populate light bulb information. The users will not have information from electric supplier (electric cost and emissions) but a generic average will be added to the software strategy.
*Concept 2: A Website capable of Populating the different Light Bulb Information automatically based on real time data of product selected. It would match the best substitute solution based on comparable luminance; the website would include a database with information from local energy company which would include renewables, primary energy source and energy cost.
*Concept 3: An Excel sheet with a Macro interface for the GUI, capable of populating the different Light Bulb Information automatically based on real time data of product selected. It would match the best substitute solution based on comparable luminance; the excel MACRO would include a database with information from the power generation industry which would include renewables, primary energy source and energy cost.
Block diagrams comparing the basic input and outputs of the baseline tool and the concepts discussed herein is included in Appendix V.
9. Concept Selection Process
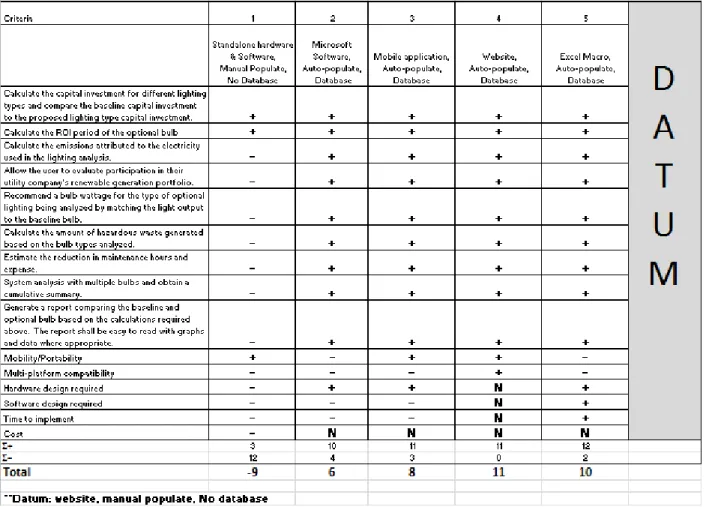
This section is similar to concept generation since the requirements and specifications of our tool are the requirements that concept must meet. This section correlates our specifications to suspected improvements in the Baseline tools. A Pugh Diagram shown below in Figure 6, was used to evaluate our concepts with the baseline. The diagram shows some significant improvements as well as some less favorable solutions. Although most of the concept surpass our baseline in specs and requirements (Except “standalone hardware tool”) the top three: Mobile application, website or excel Macro for Lighting Assessment will be our main focus. However, if we take into consideration multi-platform capability, we can see that a mobile application would not be ideal but its portability makes it a strong suit.
A Website would be ideal because of its compatibility across multiple platforms (can be accessed via phone, tablet, and computers). However it would require a longer lead time to implement
because of the Html and java programming required. The excel Macro application can be as intuitive and user friendly as a website, it would require a shorter amount of time to generate a descent excel application with the database and auto-population required per the product specifications. Its main down fall would be that it’s not compatible across different platforms.
Although the results of our PUGH diagram indicates that a website application is the most preferable final product configuration, for the initial alpha design and early product development phases we will use the Excel Macro based tool. We chose to utilize the close second runner up as it scores nearly identical to the website concept however it is more easily implemented and the basic structure can be used and migrated to a web-based/app-based application at a more appropriate phase of the product development process.
Figure 6: Concept selection PUGH Diagram
10. Alpha Design Concept Description
Our chosen Alpha concept is an Excel Macro with the ability to address our specifications and requirements (refer to section 6). The group created an excel sheet with integrated database of
commonly used light bulbs within our target persona, state specifics information regarding energy generation mix, as well as state specific electric utility rates. The tool references this database information in order to meet some of the specifications identified previously. After the successful database and content population, macros were utilized to generate a user friendly GUI (graphical user interface). Once the user opens the software, it prompts the user to select a customer classification (Figure 7). A help window was also created to guide the user in selecting the correct type (Figure 8).
Figure 7
Figure 8
Once the user has selected the proper user type, the software would prompt a window with options typical to that specific user type. In the example shown here, we selected Residential. As you can see (figure 9) enables the user to select the state; the baseline bulb with wattage; the option the user wants to consider (compare to the baseline); and the number of bulbs, fixtures and hours of
complex analysis, an advance button is also available. The advance option is capable of allowing the user to evaluate details regarding renewables and the NPV of a project (Figure 10).
Figure 9
Finally, a report card with key outputs of the analysis will be generated after the user selects the inputs they wish to analyze. Figure 11 shows a sample of what the report would look like. The report card contains key graphs that show information regarding CO2 emissions, hazardous material generation, NPV and cumulative expenses. Additions such as SO2 & NOx emissions will be added.
Figure 11
11. Alpha Design Feedback
Once the alpha design prototype was complete, the team sent a survey and the alpha design
prototype to a member of the persona group (see Appendix IV - Alpha Design Persona Survey). The goal was to learn more about the persona with regards to their lighting usage and gather pertinent feedback about the alpha design. While the users were evaluating the Alpha design and taking the survey, they were also interviewed. From this we were able to collect any verbal observations and questions the user had in addition to the survey (in person or telephone plus WebEx). All this information provided helpful insights and potential improvements on the alpha design. The survey process used is described below:
Create questions prior to the survey: we have a clear hypothesis, which is the surveyor will find this tool useful, unique and somewhat user-friendly. The survey focuses on this hypothesis and is started with a general question for the users to describe if they are an energy conscious person. Then we ask about the users’ knowledge about light bulb technologies and their current light bulb selection. Next, we ask users if they have used any light bulb energy saving tools, and have they experienced “EvaluLIGHT” alpha design prototype. After that we gathered their feedback on the tool such as if they find it helpful, what they liked about the tool, and where
they would like to improve the tool, etc. This survey was sent to our primary persona, as described in section 4.
Select survey instrument method and format of the interview: Investigator-administered questionnaires (multiple choices) included verbal observations and interviews to capture questions and feedback. (in person or telephone plus WebEx)
Team reviewed the questions, the sequencing of the questions and refinement on the questions. Administering the survey: We describe to the surveyors the purpose of the survey, instructions, and conduct the interviews in person or telephone plus WebEx.
Analyze data and determine the frequencies and percentages of the responses and write down the questions and feedback on alpha design.
The survey was effective and the surveyors found “EvaluLIGHT” alpha design helpful and user-friendly however there were suggestions for improvement. Additionally, the observations of the persona using the tool also provided insight on potential improvements. Figure 12 below indicates users found the tool to be helpful at providing the necessary outputs to evaluate sustainability.
Figure 12
As mentioned earlier, there were suggestions of improvements from the surveyors. Some of the verbatim comments are listed below and based on their comments; we made subsequent design changes to the alpha design.
“Can you provide a link that shows the base assumption values used in the calculation? An advanced tab could let people modify the assumptions.”
“I think it may need some appropriate use of "hide" feature, simplified with a few inputs maybe even remove time input make a few assumptions and then highlight a few key outputs. (Unless this tool is oriented to engineers).”
“Help menu is not clear it is a "help" menu on first window. Other windows could use similar help explanations.” Suggestion was updated in alpha design
“Some of the button functions could be clearer. Instead of ‘close’ maybe use ‘enter’ or ‘ok’.” Suggestion was updated in alpha design
“Ability to evaluate multiple install locations simultaneously. Different number of bulbs wattages, etc.”
“Consider having additional advanced user features to allow users a means to input bulb parameters manually, for example cost.”
“When I hit ‘Close’ button, I would like the whole GUI closed and get to the results” Suggestion was updated in alpha design
“The ‘Advance’ button was confusing.” Suggestion was updated in alpha design
All of the feedback was reviewed as a team and determine which ones should be updated in alpha design. We considered all the suggestions; however, we did not implement some of
suggestions due to the amount of time it required. We focused on updating the user-friendliness on the alpha design and the suggestions related to this aspect the most were implemented. Section 12 describes the updated alpha design in detail.
12. Final Concept Description
Based on the feedback that we acquired from a survey that we created for our tool, we were able to accommodate some changes on the alpha design. Figure 13 shows some the visual changes implemented to facilitate our users to navigate our tool. Since our alpha design is robust and able to calculate cost savings and emissions (the nature of excel program), most of our changes were made to address visual deficiencies. Some suggestions which came from our surveyors were subjective but we took into consideration any opinion that was provided. Establishing the connection with the
stakeholder was important.
Comparing figure 7 and 8 to figure13 we can see that we added a help button for users who would be unsure of what the Classification of electricity consumer selection was and whom they should select. We added bulb wattage; renamed “advance “to “more options” to avoid confusion and also moved it to a secluded location in the window so it would stand out as another option. In addition we also color coded our master buttons. Although this alpha design was built as an excel based tool, we would like to emphasis that our main goal is to have a web application as the production solution. A web application would facilitate use because it would be compatible for mobile and PC use (Please refer to the Pugh Chart). The only reason we selected a macro based application was because of time
restrictions, our main goal was to deliver a proof of concept functional product which cold simulate the intended final design.
BUSINESS PLAN
13. Company Description
The Evalulight is a company founded in 2013 by four partners, Adelchi Tiboni, Hector Valerio, Matthew Knoth, and Ying Tan. These founders have the dream of enabling a greener world for future generations. Based on this dream, a tool was developed to meet the needs of our primary persona, a technically advanced user looking for a way to analyze and improve the sustainability of their lighting.
Through research performed by the group it became clear that although there are more sustainable lighting options available in the marketplace, they are slow to be adopted into use. Upon further investigation it became clear that consumers are confused and burdened by trying to manually perform sustainability analyses and a tool with increased capability and user friendliness was needed. The tool needed to provide a more comprehensive and standardized lighting sustainability analysis where all three aspects of sustainability can be evaluated with a single tool; economic, environmental, and social. The result of a complete Alpha product design and development process EvaluLIGHT was developed. EvaluLIGHT is the only tool which is comprehensive in its approach and encourages users to evaluate all aspects of sustainability by automatically performing the analysis.
Targeted customers will initially include; individual households, small businesses, and bulb manufacturers. The main customers will be individuals which can be categorized by our primary persona. These customers could be small businesses and individual households with the technical expertise. Furthermore, a secondary source of customers would come from the class of our secondary persona which would be
a novice, inexperienced, and non-technical consumer. The typical user
which falls into this category would be an individual whom seeks to evaluate lighting options
primarily for economic sustainability and may or may not be aware of impacts on the other two
categories of sustainability.
14. Market Analysis Target Market
Approximately 700 TWh of electricity is consumed annually in the U.S. and can be divided into four sectors: residential, commercial, industrial, outdoor. As shown in Figure 1, the hours of use, number of lamps, and average lamp wattage varies quite drastically amongst the four sectors. Upon further analysis it can be seen that the bulb technology is quite different amongst industry sectors as shown in Figure 2. What is also clear when analyzing Figure 2 is that more efficient technologies such as CFL and LED are slow to be adopted. Among the outdoor lamps, high pressure sodium (HID) technology has the highest 83% of installed wattage in 2010, while LED luminaires are installed as low as 1.5%.
Interestingly enough there is significant potential for improvements to lighting sustainability if some of the newer lighting technologies were adopted in greater numbers. As indicated in Figure 3, if each of the four industry sectors were to convert all of their lower efficient lighting types into currently available more efficient types there could be as much as 39% reduction in overall annual energy consumption (nearly 270 TWh/yr ) associated to lighting in the United States.
This market can grow over time in two ways, first by modifying the tool, adapted to specific markets or larger. The other way to grow, is the frequent maintenance and updating of the database, thus generating a constant demand.
Product Competitiveness
Our application is free, so the end user will have no expense in acquiring it. Our source of income will occur in several other forms, written below.
• Advertising in the application, a very common and well accepted practice in free apps. • Government funding.
• Label recommendation to purchase approved lamps, producing companies pay to use that label on their products.
• Manufacturer payments for maintaining their specific bulb information in the EvaluLIGHT database. • Commission for directed online sales of light bulbs. After the final result of the query tool, we suggest a link to an online store with the analyzed bulb available for purchase, where the customer can now order the purchase of the lamp that the tool just evaluated.
The main advantage of EvaluLIGHT is its comprehensive approach to sustainability evaluations. Our competitors focus their efforts in the economic sphere and often with complex tools requiring heavy user input of difficult to obtain data such as utility pricing. One weakness is the EvaluLIGHT large amount of options, the large database, which if not well managed can lead to errors in the evaluations and subsequently customer dissatisfaction.
Product Barriers
There are several barriers which the product faces. First and foremost is obtaining wide use of the tool, advertising and marketing can be a challenge. There are nearly unlimited avenues that the tool could be marketed through: smartphone and tablet applications, social media, kiosks within home centers, as well as posting on industry leaders web pages (i.e. LEEDS, DOE, EPA, EIA), etc. Future research on marketing strategies and the trade studies can help the team to understand each marketing strategy and the associated cost, prioritize the advertising strategy based on effectiveness, update revenue generation focus, refine business plan, and possible development collaboration with government bureaus
A second barrier that will be encountered is obtaining revenue. Although there are several sources which revenue can be generated from, more research is needed to determine the viability of each source. Furthermore there may also be additional sources identified which can also be worth exploring.
15. Product Description
Currently the product is just past the first Alpha design phase. At this time the product has been updated to incorporate all of the feedback resulting from our survey up to what the current excel based tool is capable of. The next phase would be to continue development by migrating to a closer version of
the final desired product, a web based application. This will allow the tool to be improved by incorporating all of the user suggestions.
Generally speaking, the tool contains a user friendly GUI (graphical user interface) with customer prompts for data entry. Additionally, there will also be help menus available for users to obtain further descriptions on what types of data is required in each field if they are unsure. There will also be advanced user options where a customer can input additional information for a more detailed and complex analysis such as NPV (Net Present Value) and impacts of renewable generation sources.
Finally, a report card with key outputs of the analysis will be generated after the user selects the inputs they wish to analyze. Figure 11 above shows a sample of what the report would look like. The report card contains key graphs that show information regarding CO2, SO2, and NOx emissions, hazardous material generation, NPV and cumulative expenses.
Unbiased User feedback - See section 11
16. Marketing and Sales Strategy A. Market Penetration Strategy
First Target market - The first targeted market would be smartphone apps sell to primary persona, which will be a technically advanced user looking for a way to analyze and improve the sustainability of their lighting options. This persona could be a sole individual or acting on behalf of a company.
Expenses, Capital Investment - Research on typical app development and maintenance costs
indicates the following expenses would be reasonable for an application of the type describe
herein.
Figure 14
A secondary option to reduce development costs would be to employ University students to assist in the development of the product as part of a design project. Although the development costs would be significantly lower, there may be reoccurring royalty fees that could affect the profitability. Revenue - Our application is free, so the end user will have no expense in acquiring it. Our source of
Time* 6 weeks
Head Count* 2
Man Hours 480
Burden Rate** $ 80
Total Capital Investment $ 38,400
*based on similar apps
**based on similar apps developer costs
Maintenance Monthly Annually
Time 20 240 hours
Head Count 2 24
Man Hours 40 480
Burden Rate $ 60 $ 60
Total Maintenance Costs $ 2,400 $ 28,800
Development
Ex
pe
ns
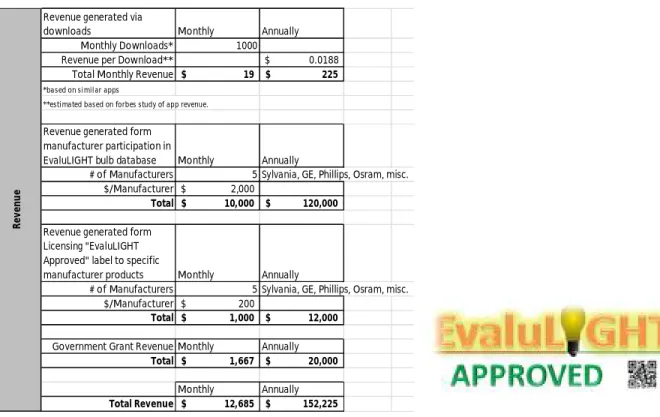
purchase approved lamps, light manufacturers would pay to use that label on their products; Commission for online sales of light bulbs via EvaluLIGHT. Table below presents each revenue numbers in detail.
Figure 15 Figure 16
One additional potential source of revenue is related to the label recommendation to buy the lamps, where manufacturers pay a use fee to use the label on suggested products as shown in Figure 16. Profitability - The monthly ($10K/yr) and annually ($123K/yr) profitability was calculated by expense subtract from the revenue. This is shown in table below.
Figure 17 B. Communication Strategy (Promotion)
There are many ways to promote EvaluLIGHT to broad the customer usage. Below was some ways which we find most effective:
• We can collaborate with government bureaus, utility companies and light bulb
manufacturers and they can promote a link to our tool since these parties already have a customer base.
Revenue generated via
downloads Monthly Annually
Monthly Downloads* 1000
Revenue per Download** $ 0.0188 Total Monthly Revenue $ 19 $ 225
*based on similar apps
**estimated based on forbes study of app revenue.
Revenue generated form manufacturer participation in
EvaluLIGHT bulb database Monthly Annually
# of Manufacturers 5 Sylvania, GE, Phillips, Osram, misc. $/Manufacturer $ 2,000
Total $ 10,000 $ 120,000
Revenue generated form Licensing "EvaluLIGHT Approved" label to specific
manufacturer products Monthly Annually
# of Manufacturers 5 Sylvania, GE, Phillips, Osram, misc. $/Manufacturer $ 200
Total $ 1,000 $ 12,000
Government Grant Revenue Monthly Annually
Total $ 1,667 $ 20,000 Monthly Annually Total Revenue $ 12,685 $ 152,225 Re ve nu e
Profitability Monthly Annually
Revenue $ 12,685 $ 152,225 Expenses $ 2,400 $ 28,800 Total Profit $ 10,285 $ 123,425
• We will use 2D codes to invite people to download our App, these 2D codes will be printed
in advertisements and packaging lamps.
• We will make advertisements in home improvement stores like Home Depot and Lowe’s. • We can use monthly utility bills to advertise the tool.
C. Channels of Distribution Strategy
EvaluLIGHT will be downloaded through Google Play, Apple APP store for mobile phone application. The web site distribution can be download the tool through utility companies websites, and the secondary channel would be retail stores like Home Depot and Lowe’s which provides a 2D code visible to customers to scan and download to their phones.
D. A Growth Strategy
EvaluLIGHT’s alpha design currently focus on primary persona, which will be a technically advanced user looking for a way to analyze and improve the sustainability of their lighting options. This persona could be a sole individual or acting on behalf of a company. We could modify original EvaluLIGHT to a less complex tool “LITE” version to target our secondary persona, which would be a business or municipality which does not have the ability to hire an expert (or have one on staff) to perform lighting system analysis. This would typically be small to mid-size energy consumers; small cities, small businesses, shopping centers, residential, small commercial (warehouses), etc. With the expansion of the secondary persona, we can definitely grow the business. We can also collaborate with each individual light bulb manufacture to create a light bulb brand focused tool which can obtain a larger amount of revenue since EvaluLIGHT would become more commercial focus. All these revenue potential would lead to possible increase of head counts.
17. Corporate Financing of Product
Prototyping, further validation, and launch cost - This is the development cost $38K mentioned in Section 16 a) – “Expense”.
Profitability and Breakeven Time - Considering the initial investments in the development cost from Section 16 part a) – “Profitability”, the return on investment (ROI) of EvaluLIGHT is estimated to be approximately 4 months. This is shown in table below.
Figure 18
ROI Period Monthly
Capital Investment $ 38,400 Profit $ 10,285
ADDITIONAL REFLECTIONS ON PROJECT OUTCOME
18. Why is the project likely to be consistent with an eco-efficient or sustainable design?
Although there are numerous tools available which are similar to EvaluLIGHT, none approach sustainability with the comprehensive approach employed by EvaluLIGHT. It is this comprehensive approach which allows users to consider multiple aspects of sustainability and it can be done with less effort than other tools require to get less of a comprehensive evaluation. EvaluLIGHT possesses the following key aspects of evaluation:
• Economic – Estimates ROI and NPV of options.
• Environmental – Estimates emissions when user selects renewable generation.
• Environmental - Estimates CO2, NO, and SO2 emissions based on recognized data
collected by the EIA.
• Environmental - Estimates hazardous material generation attributed to various lighting
choices.
• Environmental - Estimate the effect on emissions when participation in a utility
company’s renewable generation program.
• Social - The only tool which recognizes social impacts attributed to lighting choices and
provides a window into estimating those impacts.
Combining the sustainability evaluations above allows EvaluLIGHT to achieve a more realistic and comprehensive result. Figure 17 below clearly illustrates where EvaluLIGHT lies on the triple bottom line map of sustainability as well as where most of the currently available products rank.
Figure 17
-EvaluLIGHT
-other tools
A successful launch and scale up of EvaluLIGHT could have significant impacts on the environmental aspects of the lighting industry. By accounting for and identifying environmental concerns such as hazardous material, it may cause certain users to bypass CFL light altogether and go straight towards LED lighting. Or, conversely, it may spur additional demand for proper disposal facilities or legislation aimed to reduce the use of the hazardous materials. There could also be improvements in the environmental impacts related to electricity generation emissions as consumers will be more aware of the various emissions which are generated which way sway their lighting choices, particularly in the presence of emissions related taxes. Also, the tool allows users to evaluate renewable generation sources, which in turn could spur growth in those sectors.
Social impacts for EvaluLIGHT are more difficult to comprehend and anticipate. One thing which has been identified is the possible reduction in maintenance when longer life lighting technologies are chosen. This can be both good and bad as the less maintenance which is required the safer individuals will become. However, the reduction in maintenance will also reduce wages for those workers. Another area where there may be adverse social implications is related to the hazardous materials environmental impacts. The increased use of hazardous materials may create issues with refuse workers for example as they are exposed to increasing levels of those materials.
It is our belief that this product could be successfully scaled up with overwhelmingly positive implications. Although there are risks that should not be ignored, it is believed that the various industries involved will meet the challenges. For example, with regards to hazardous waste, it is not inconceivable that improved recycling and disposal practices will be developed as the use of the materials is more prevalent. Overall however, EvaluLIGHT makes significant improvements in eco-efficiency to the point where the tool crosses slightly into the realm of sustainability.
19. Design Critique
Early on in the development of EvaluLIGHT, the team identified that the product hazardous material database would be a critical and challenging aspect of this product development. We were able to look at various manufacturer products and take industry averages for the critical parameters that are fed into the analysis. Fortunately, in most instances there was not much variation between
manufacturers for the basic lighting types. Since the goal of EvaluLIGHT is to provide a generic yet all-encompassing view of lighting sustainability the decision was made to initially create the lighting database with the most commonly used lighting types. This added validity to our generic database. However, this database can be improved by using each light bulb manufacturers’ specific bulb information, and the user can select the actual brand names, wattage, and model of their bulb from future concept of “EvaluLIGHT”.
The Alpha design was a proof of concept; we were able to get the information of electricity cost of different states using data collected monthly by the EIA. Additionally, EIA data on state specific electricity generation type was also used to determine emissions for the user. This information gives a
generic end result for “EvaluLIGHT”, however the alpha design cannot update any of this information as updates are made to the source information. Future versions of “EvaluLIGHT” could include links to this information using complex background software and IT support. There would however be costs
associated with this and those are included in the “maintenance costs” section of the business plan In addition, some states are beginning to enact carbon taxes, future versions of “EvaluLIGHT” could also be made to include this as an option allowing the user to calculate the CO2 emission cost. Future “EvaluLIGHT” could also incorporate other changes from Section 11 – Alpha Design feedback, such as an advanced user function where a user can supply some of their own data. For example, bulb costs, utility rates, etc.
Another shortcoming of the Alpha design was that it has been developed to analyze a single bulb A-B comparison. Some users expressed interest in the ability to analyze a more complex system or property by being able to sum multiple A-B comparisons on a single evaluation. This can be
implemented fairly easily but was omitted in the Alpha design do to the purpose of the design (proof of concept) and time constraints.
We also need future research on marketing strategies and the trade studies. In order to obtain wide use of the tool, advertising and marketing would be a challenge. There are nearly unlimited avenues that the tool could be marketed through: smartphone and tablet applications, social media, kiosks within home centers, as well as posting on industry leaders web pages (i.e. LEEDS, DOE, EPA, EIA), etc. Future research on marketing strategies and the trade studies can help the team to understand each marketing strategy and the associated cost, prioritize the advertising strategy based on
effectiveness, update revenue generation focus, refine business plan, and possible development collaboration with government bureaus.
20. Recommendations
There are multiple recommendations for future progress on this project. The main
recommendation would be to pursue the idea of a web based application. A web based application would mobile usability and allow multiple hardware compatibilities. We believe that the project would be most cost effective and time efficient if it were a student driven senior/ graduate project. A student driven project would benefit the university, the student and the company. It is recommended for the website to be created with Java and PHP programming language environment. Most web based applications use these software protocols so compatibility is ideal. Having the stakeholders to
constantly contribute feedback can help with the development of the final design. An example would be our tool survey which led to major changes to the product; this is not limited to surveys so other alternatives for feedback could also be explored.
Once the tool is well established we can place emphasis on including the modifications that are mentioned in section 19. These modifications are but are not limited to: a dynamic database, Carbon Tax cost, and multiple lighting system assessment. A dynamic database can improved the tool by using each light bulb manufacturers’ specific bulb information, wattage, and model of their bulb and asses in real time. Since some states are beginning to enact carbon taxes, future versions of “EvaluLIGHT” could
also be made to include options allowing the user to calculate the CO2 emission cost. The ability to analyze a more complex system or property by being able to sum multiple A-B comparisons on a single evaluation would greatly benefit the tool as well.
21. Acknowledgements
The following individuals were instrumental in supporting the realization of a functioning product which met the goals described herein.
Group Members: Matthew Knoth Ying Tan Adelchi Tiboni Hector Valerio
MECHENG 589 Faculty Advisors: Steve Skerlos
Siddharth Kale Alexander Hillbrand Others:
22. References:
DTE Energy. 2013.Web. 12 Oct. 2013 <https://www2.dteenergy.com>.
Indianapolis Power & Light Company. 2011.Web. 12 Oct. 2013 <http://www.iplpower.com/>. Commerical Lighting Calculator.Web. Consolidated Edison, INC. 11 Oct. 2013
<http://www.coned.com/customercentral/calculators/EC_bus_Lighting_Calc.html>. CFL Lighting.Web. Consolidated Edison, INC. 11 Oct. 2013 .
<http://www.coned.com/customercentral/calculators/EC_res_CFL.html>.
Solid-State Lighting Retrofit Financial Analysis Tool. 12 Aug. 2013 2013.Web. Energy Efficiency &
Renewable Energy. 12 Oct. 2013 <http://www1.eere.energy.gov/buildings/ssl/financial-tool.html>. 2013.Web. LED Lighting Facts. 12 Oct. 2013 <http://www.lightingfacts.com/>.
GE Lighting Tools.Web. 10 Oct. 2013 <http://www.gelighting.com/LightingWeb/na/resources/tools/>. Space by Space Calculator.Web. 10 Oct. 2013
<http://www.sylvania.com/en-us/sustainability/regulations-legislation/Pages/space-by-space-calculator.aspx>. Lighting Design Assistant.Web. 10 Oct. 2013 <http://ldt.sylvania.com/>.
Building Energy Software Tools Direct. 2011.Web. Energy Efficiency & Renewable Energy, DOE. 10 Oct. 2013
<http://apps1.eere.energy.gov/buildings/tools_directory/subjects.cfm/pagename=subjects/pagen ame_menu=materials_components/pagename_submenu=lighting_systems>.
Home Energy Score. 15 July, 2013 2013.Web. Energy Efficiency & Renewable Energy, DOE. 10 Oct. 2013 <http://www1.eere.energy.gov/buildings/residential/hes_index.html?utm_source=HES%2Bredirec t&utm_medium=redirect&utm_campaign=HES%2Bredire>.
Gabe Arnold, Dan Mellinger, Paul Markowitz, Mike Burke, Dave Lahar. A Win-Win-Win for Municipal Street Lighting: Converting Two-Thirds of Vermont’s Street Lights to LED by 2014. American Council for an Energy-Efficient Economy, 2012. Print.
Http://www.Aceee.org/files/proceedings/2012/data/papers/0193-000144.Pdf .
Navigant Consulting Inc. 2010 U.S. Lighting Market Characterization. Office of Energy Efficiency & Renewable Energy, 2012. Print.
Appendix I: Team Introduction
Matt Knoth
I received a Bachelor’s of Science in mechanical engineering
with a concentration in biomedical engineering from
Kettering University in Flint, Michigan. My background
consists of 7 years in manufacturing engineering in both the
automotive and medical device industries. Additionally I
have 6 years in product design and development experience
in powertrain systems for hybrid and electric vehicles. My
work in alternative powertrain vehicles got me interested in
energy use and infrastructure as well as sustainable design.
Specifically, I believe that humans can have the same or
better quality of life without incurring significant burden
either social, economic, or functional with minimal effort.
Ying Tan
I grew up in Asia and moved to Michigan to start high
school. I graduated from Michigan State University with
electrical engineering in Bachelor’s of Science. Since
graduation, I worked at Robert Bosch LLC for 2 year
professional development program and then 1.5 years as
hardware and test engineer. During this time, I also got to
move to Germany with a 6 month international training in
manufacturing. Currently I work for General Motors as
design release engineer for next general electric vehicle
on-board charger.
This course has broad my views on sustainability, despite
the fact that I recycle, and live with a minimal waste
lifestyle. For this project, I would like to see the maximum impacts with optimized
materials design for the project. I can bring in project management experience and
research to the project.
Adelchi Tiboni
I graduated in FAAP, located in Brazil. Always worked
with new product development, in American companies
such as Goodyear, Motorola and GM.
I am interested in learning and practicing a sustainable
engineering, and always seek for innovations. With this
project, I want to achieve a dream to create something new
and never seen in the current market. My best skill is never
give up, whenever I encounter a problem or difficulty, seeks
solutions and I’m able to generate a lot of ideas, mainly
technical.
Hector Valerio
I Graduated From The City College of New York With a
Bachelors of Engineering in Electrical Engineering. I have 3
year of work experience. The automotive industry has been
my primary work spac