Politecnico di Torino
Porto Institutional Repository
[Article] Modeling and Analysis of Wireless "Charge While Driving"
Operations for Fully Electric Vehicles
Original Citation:
F. Deflorio;P. Guglielmi;I. Pinna;L. Castello;S. Marfull (2015).
Modeling and Analysis of Wireless
"Charge While Driving" Operations for Fully Electric Vehicles.
In:
TRANSPORTATION RESEARCH
PROCEDIA
, vol. 5, pp. 161-174. - ISSN 2352-1465
Availability:
This version is available at :
http://porto.polito.it/2588274/
since: February 2015
Publisher:
Elsevier
Published version:
DOI:
10.1016/j.trpro.2015.01.008
Terms of use:
This article is made available under terms and conditions applicable to Open Access Policy Article
("Creative Commons: Attribution-Noncommercial-No Derivative Works 3.0") , as described at
http:
//porto.polito.it/terms_and_conditions.html
Porto, the institutional repository of the Politecnico di Torino, is provided by the University Library
and the IT-Services. The aim is to enable open access to all the world. Please
share with us
how
this access benefits you. Your story matters.
Transportation Research Procedia 5 ( 2015 ) 161 – 174
2352-1465 © 2015 The Authors. Published by Elsevier B.V. This is an open access article under the CC BY-NC-ND license (http://creativecommons.org/licenses/by-nc-nd/4.0/).
Peer-review under responsibility of the Società Italiana dei Docenti di Trasporti (SIDT). doi: 10.1016/j.trpro.2015.01.008
ScienceDirect
SIDT Scientific Seminar 2013
Modeling and analysis of wireless “Charge While Driving”
operations for fully electric vehicles
Francesco Deflorio
a,*, Paolo Guglielmi
b, Ivano Pinna
a, Luca Castello
a, Sergio Marfull
aaPolitecnico di Torino, Dept. DIATI – C.so Duca degli Abruzzi 24, Turin 10129, Italy bPolitecnico di Torino, Dept. DENERG – C.so Duca degli Abruzzi 24, Turin 10129, Italy
Abstract
This study presents a method for analysing the traffic and electric performance of wireless Charge While Driving (CWD) systems for two types of electric vehicle: a light-van for freight distribution and a city car. After performing a preliminary design of the CWD system, a simplified traffic simulation, including an energy assessment for vehicles, is presented to test the design settings, such as the travelling speed on CWD and the percentage of equipped lanes.
The speed range explored refers to quite low values because the design layout of the EVSE should be a compromise between the need to minimize the installation and maintenance costs and users’ acceptance of the time required to obtain a proper recharge. The choice of the traffic modelling approach derives from the specific requirements of the CWD system defined in the eCo-FEV project, which may be assumed as having been installed along a low speed lane of a motorway. The simplified traffic model simulates the vehicles time series along the road, introducing their energy needs as an influencing factor of drivers’ behaviour. The simulated scenarios involve electric light-vans travelling along a 5-km highway that have the opportunity to charge in motion if their State of Charge (SOC) is under an established threshold.
© 2014 The Authors. Published by Elsevier B.V.
Selection and peer-review under responsibility of SIDT2013 Scientific Committee.
Keywords: traffic simulation; electric vehicle; charge while driving; inductive charging; cooperative driving; electric freight distribution.
* Corresponding author. Tel.: *+39-011-090-5601;
E-mail address: francesco.deflorio@polito.it
© 2015 The Authors. Published by Elsevier B.V. This is an open access article under the CC BY-NC-ND license (http://creativecommons.org/licenses/by-nc-nd/4.0/).
1.Introduction
Electric vehicles are becoming a viable alternative for future motorized mobility due to their high efficiency and non-existent local emissions, although their diffusion is currently limited by some drawbacks with respect to classical internal combustion engine (ICE) vehicles. The vehicle autonomy, in fact, is the main critical issue for EV, together with the lack of widely distributed recharging infrastructures with public access, the generally long time required by the charging process, the limited life of the batteries and their cost. In the end, these are all concepts concerning the on-board energy source.
The market acceptance of FEVs, travel needs and customer choices, especially for the first car in a household, were analysed by Kirsch (2000). Numerous research studies claimed that the challenges of battery inefficiency and large and wasted space in the FEVs can be overcome by Wireless Power Transfer (WPT), a technology that conducts energy from a source to the electric device without a direct electrical connection (Palakon et al., 2011). Another important element that supports a battery charging modality with frequent and low energy transfers while driving is that, to avoid an excessive shortening of the battery life cycle, the SOC must be managed carefully, and the batteries should never be fully discharged.
The non-contact power transfer mechanism of the On-Line Electric Vehicle (OLEV) system (Lee et al., 2010) was developed by Suh I. S. (2011). The OLEV is an electric transport system in which the vehicles absorb power from the power lines underneath the surface of the road. Ahn et al. (2010) proposed various techniques for the reduction of electromagnetic fields from the power line and the vehicle itself by applying a metallic plate shield.
In this study, a CWD WPT approach is followed, and the choice of the traffic modelling derives from the specific requirements of the CWD system defined in the context of the eCo-FEV project (2013), which has been assumed as installed only along the right-hand lane of the motorway, as it is usually used by slower vehicles. The charging lane can be used by different vehicle classes on the basis of their charging needs and related speeds. One of the possible approaches for modelling this type of problem is micro-simulation (Hoogendoorn and Bovy, 2001; Barceló et al., 2005), where single vehicle trajectories are modelled as well as their interactions on the road.
In the analysed case, the vehicles’ energy management affects the FEV behaviour itself, with direct consequences on the CWD lane occupancy. In particular, a vehicle with a low battery SOC that needs to recharge tries to enter the charging lane, while, when the SOC of a vehicle that is charging in the CWD lane reaches an adequate level, it tries to exit. For this reason, a specific model has been developed and implemented following a meso-scopic approach (Cascetta, 2001), where single vehicle trajectories have been modelled, updating the energy and positioning information of the vehicles at selected points along the road, where it is interesting to know the time series of the energy provided for the entire vehicle set detected in a defined time period. The developed traffic simulator, in fact, is not aimed at simulating instantaneous interactions between vehicles because, in the CWD lane, they are managed according to a cooperative behaviour that facilitate the entry of new vehicles and overtaking manoeuvres.
The aim of this research study is to present a method to analyse the performance of a wireless inductive Charge While Driving (CWD) system that can cope with the problems that EVs still show. In the first part, the paper presents the influence of different system components on the vehicle SOC along the charging lane, which is useful for a preliminary design of the infrastructure and the specific Electric Vehicle Supply Equipment (EVSE) implemented for a CWD approach. In the second part, a simplified traffic simulation is described. This developed model is used to evaluate the effects of an established design setting of the infrastructure on the charging state of the vehicles and how their SOC could affect the traffic behaviour.
2.Methodology to support the preliminary EVSE design
To provide a clear framework for possible applications of the presented analysis, the model developed in this paper could be applied, as an example, to a freight distribution service. Indeed, the FEV traffic flow simulated here is compatible with a flow of light-vans that could be generated by a logistics centre for multiple deliveries. Vehicles follow fixed routes that can be planned in advance, including the CWD usage, to allow vehicles to cover greater distances or to contain the battery mass, avoiding the wasting of time for a stationary recharge and increasing their level of service.
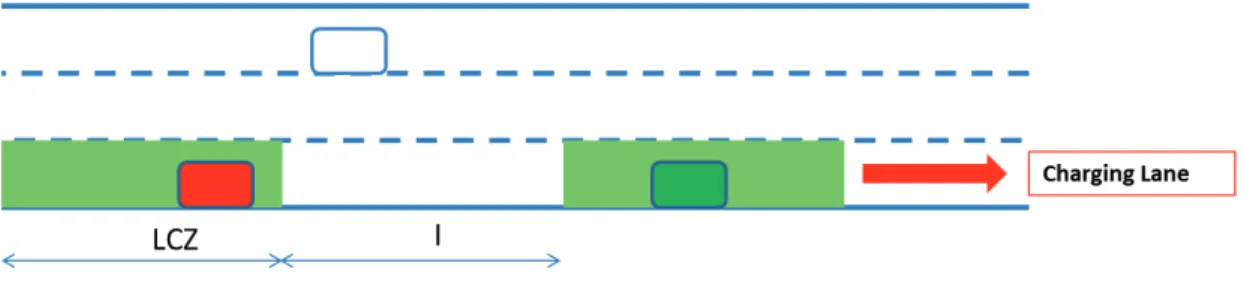
2.1.Layout for CWD charging lane
The analysis is applied to a multilane 5-km motorway scenario where the right-hand (lower speed) lane is reserved for the charging activities, as shown in Fig. 1. The EVSE is composed of inductive coils placed under the pavement surface, forming different Charging Zones (CZs) with an Inter-distance (I), which generates a high frequency alternating magnetic field to which the coil on the car couples and transfers the power to charge the battery.
Fig. 1. Example of a scenario layout for CWD operations
Considering that no similar system has ever been implemented in real traffic, and only a few experimental test sites have been developed, the first step consists of a preliminary design of the elements that guarantees a satisfactory recharge of the vehicles.
2.2.Data assumptions for the CWD system
Taking into account that the electric vehicle used in this analysis is a light-van, a provided power in the CZ (PCZ)
of 50 kW/m is assumed, which is quite in line with the on-going electrical power standards for EVSE, while the vehicle on-board device that receives the energy has been set with a longitudinal dimension (LCD) of 1 m. A system
efficiency (ηs) from grid distribution to EV battery in the 80-90% range at full power has been assumed. To properly
design the charging infrastructure, the EV battery SOC evolution has been analysed as a function of the basic design elements, such as the Length of the Charging Zone (LCZ), Inter-distance (I) and vehicle speed.
For electrical distribution efficiency, the strategy of minimizing the number of CZs along the charging lane, by increasing LCZ and I instead of realizing smaller and more frequent CZs, is generally preferred. However, the system should also be quite flexible to avoid vehicles covering relevant distances at low speeds on the CWD lane without recharging. Therefore, a trade-off analysis between the inter-distance and the vehicle SOC gain can provide interesting results.
Finally, considering the design goal of this first analysis, another assumption for the EVSEs is that they always deliver their maximum power.
2.3. Models for energy estimation
In the CWD lane, a balance between the energy consumed for vehicle motion and the energy provided by the CZs should be carried out to evaluate the SOC of the vehicle batteries along the road.
2.3.1.Energy consumption estimation
The model adopted for estimating the energy consumption is based on the vehicle’s resistance to motion. Assuming, for the sake of simplicity, that in the considered scenario, the road average slope is zero and taking into account that vehicles in the CWD lane are forced to drive at predetermined constant speeds, the resistance forces
due to slope and acceleration can be neglected. Therefore, the total resistance (Rtot) is given by the aerodynamic and
where: ρ: air density : drag coefficient A: cross sectional area
s: vehicle speed relative to the air
m: vehicle mass
: coefficient that considers the characteristics of the road surface
: coefficient
s: vehicle speed
After calculating the resistance to motion, the power instantaneously absorbed at the EV battery side is obtained according to the following relation:
where is the driveline efficiency and is the auxiliary power, which concerns all consumptions not related to
the vehicle motion, i.e., those of on-board electrical devices, such as lights, air conditioning, etc. The energy consumed by the vehicle during a time period is obtained by multiplying the power consumed by the time period duration.
All test vehicle parameters are reported in Table 1.
Table 1. Electrical light-van data used for design
Variable Value Unit
Length of the charging device (LCD) 1 m
Mass 2500 kg Frontal surface 4.9 m2 Cx 0.38 f0 0.12 m/s2 f2 0.000005 1/m Driveline efficiency () 0.75
2.3.2.Estimation of the energy received in CWD
The energy that the vehicle receives from a coil is related to the dimensions of the elements of the system (the coil and on-board device), the power provided and the occupancy time.
When a vehicle crosses a transmitting coil, it receives energy in accordance with the system efficiency (ηs),
which mainly depends on the distance between the coil(s) of the on-board device of the vehicle and the coil(s) of the CZ in the road pavement. A transition coefficient is introduced to account for the initial and final partial overlaps, thus creating a reduction in the total energy received from the CZ. The energy that the vehicle receives depends on the occupancy time, which is related to its speed on the CZ.
In detail, the CZ is itself subdivided into coils that are excited only if a receiving (and authorized) vehicle is above them. In this way, only the coils that are under the vehicle work, thus maintaining the emitted power inside a shielded zone, corresponding to the vehicle occupancy.
2.4.Setting of CWD design parameters
The indicator used to design the layout of the charging infrastructure is the difference between the final and the
starting EV battery SOC (ΔSOC) after 1 km in the CWD lane. Fig. 2 and Fig. 3 respectively show, for the
considered light-van, empty and full loaded conditions and how the ΔSOC changes with the changing of three main
parameters: LCZ (from 10 to 50 m); I (from 20 to 100 m); and the EV speed (from 20 to 80 km/h). A CWD system
efficiency of 85% is here assumed for any power level to simplify the analysis.
Fig. 2. Scenarios explored for the electrical light-van in EMPTY CONDITIONS (2500 kg)
Taking into account the results obtained by the developed analysis, a correct design procedure should consider, on the one hand, the service provider’s need to minimize the installation and maintenance costs and, on the other hand, users’ acceptance of the travel time required for a proper recharge in the CWD lane.
The speed has a relevant influence on the results. Considering the test vehicle in empty conditions, the design hypothesis on the speed in the CWD lane assumes two different allowed speeds in the CWD lane: the highest one allows the vehicle to maintain its entering SOC, while the second one is a compromise between the recharge need of vehicles with a low SOC and a minimum speed that can be accepted by the users. Assuming the highest speed is equal to 60 km/h, the equilibrium between the energy consumed and the energy provided by the coils is obtained
with a percentage of the equipped lane of 40% (LCZ = 20 m, I = 30m, ΔSOC = 11 Wh). In this layout, assuming the
lowest speed is equal to 30 km/h, after 1 km, the user obtains an increase of the battery SOC of 367 Wh, which means that to obtain an SOC increase of 1 kWh, the vehicle needs to cover approximately 2.7 km in the CWD lane.
Fig. 3. Scenarios explored for the electrical light-van in FULL LOADED CONDITIONS (3500 kg)
Considering the same test vehicle in full loaded conditions (Fig. 3) in the selected layout (LCZ = 20 m, I = 30 m),
after 1 km in the CWD lane, the ΔSOC obtained is equal to -40 Wh for the speed of 60 km/h and 321 Wh for the
speed of 30 km/h.
2.5.Verification of the CWD system for an electrical city car
The setting of the CWD system parameters previously described has been defined according to the characteristics of a light-van, as the charging system has been specifically designed for a freight distribution service connecting the city and the logistic centre. However, the same charging system may be used by different electric vehicles if they are equipped with a compatible on-board device. For instance, city cars have lower masses, and the energy balance between the consumption and the energy received from the road will consequently be different. Therefore, an
evaluation of the effects of the adopted CWD system on the ΔSOC of a city car will be carried out, considering a
Table 2. Electrical city car data
Variable Value Unit
Mass 1600 kg Frontal surface 2.229 m2 Cx 0.336 f0 0.12 m/s2 f2 0.000005 1/m Driveline efficiency () 0.75
Auxiliary power (Paux) 0.8 kW
Taking into account the smaller dimensions of the city car, perhaps an LCD of 1 m could not be adopted, although this issue should be addressed in the future by car manufacturers. For this reason, the analysis is developed
by individuating the trend of the ΔSOC with various options of LCD and different speeds (Fig. 4), according to the
EVSE settings previously defined (LCZ = 20 m, I = 30 m, Pcz = 50 kW/m).
Fig. 4. Influence of speed and LCD on the ΔSOC for an electrical city car for the adopted EVSE settings, after 1 km
Considering the higher design charging speed, which guarantees to the vehicle the maintaining of its SOC, as
previously defined, Fig. 4 shows that almost the same ΔSOC results of the light-van can also be obtained for the city
car, albeit driving at a higher speed.
In detail, adopting the same value of the LCD (1 m) as the light-van, a ΔSOC of 18 Wh is obtained for a speed of
80 km/h, while for the light-van, a ΔSOC of 11 Wh was obtained for 60 km/h.
However, considering the lower charging speed introduced for low SOC vehicles, a result for the ΔSOC
for a speed of 40 km/h and a ΔSOC of 426 Wh for a speed of 30 km/h, while for the light-van, a ΔSOC of 367 Wh was obtained for a speed of 30 km/h). In fact, as previously described, the relationship between the energy received by the vehicle and its speed is linear because it depends on the CZ occupancy time, while the energy consumed by the vehicle along the travel is proportional to the third power of its speed. In the case of this new test vehicle, a reduction of the mass and an improvement of the aerodynamic parameters (Cx and frontal surface) are introduced. Therefore, because of the non-linear relationship between the vehicle consumption and its speed, these three parameters influence sensibly the vehicle consumption for high speeds.
The non-linear relationship also affects the choice of different LCDs. If the same charging speeds defined for the light-van would be adopted for the city car, the LCD could be reduced to 0.5 m to maintain the SOC in the CWD lane driving at 60 km/h (ΔSOC = -4 Wh after 1 km). With this LCD value, however, after 1 km driving at 30 km/h, the ΔSOC obtained (164 Wh) is about half that obtained by the light-van equipped with an on-board device of 1 m (321 Wh). Alternatively, assuming, for example, an LCD of 0.9 m, the speeds can be increased up to 80 km/h to preserve the SOC (ΔSOC = -1 Wh) and 50 km/h (ΔSOC = 165 Wh) to obtain a relevant charge.
3.Simulation model for the EVSE design validation
After the design of the infrastructure and installations, a traffic simulation model has been implemented to evaluate the effects of the design assumptions on the vehicle SOC and on users’ behaviour. In the traffic model (Fig. 5), the arrival time of a vehicle at the node (i) is estimated, in a first step, on the basis of its arrival time at the node (i-1) and its design speed, which depends on its SOC, and it is then adjusted, in a second step, according to the feasible headways for vehicles in the lane. In fact, due to safety reasons, in the charging right-hand lane, the headway between two following vehicles of less than a threshold value may not be allowed. The battery SOC, monitored along the road at every node for consecutive sections, plays a crucial role because it is used by the drivers to choose if and when they have to get into the right-hand lane to recharge and to set the appropriate vehicle speed. The model manages the lane position according to a cooperative behaviour: each vehicle that needs to recharge is moved into the CWD lane at the node, creating the necessary gap in the vehicle flow by slowing down the following vehicles. This assumption, which works at discrete space steps, may describe in a real scenario a vehicle behaviour that can be managed by drivers or by the cooperative system along the entire section before the node where the model acts.
The analysis considers even the overtaking cases: a cooperative overtaking model at constant speed is implemented, and the vehicle does not recharge during the manoeuvre outside the charging lane.
Fig. 5. Some trajectories in the time-space diagram for different vehicle types to trace their arrival time at consecutive nodes
3.1.Functions for CWD traffic modelling
At any node (i), the traffic simulator operates according to the following procedure:
• It calculates and corrects the vehicles’ headways and, consequently, the vehicles’ arrival times, at node (i-1);
• It calculates the SOC and the arrival time of the vehicles at node (i);
• On the basis of the SOC in section (i), it defines the position (“IN” or “OUT” of the charging lane) and the status
(“emergency” or “charge”) of each vehicle;
• It updates the vehicles’ SOC at node (i) due to the overtake manoeuvres performed between nodes (i-1) and (i).
This iterative process is performed by the following main functions:
1. The “Initial traffic state generation” function generates vehicles compatible with the input traffic flow,
defining their starting headways and times. Using a random algorithm, such as that reported by Daganzo (1995), which uses the mean value and the coefficient of variation or the standard deviation of the random distribution, the function assigns to each generated vehicle an initial SOC, conforming to the battery power limitations, and consequently defines its position and its speed in the road according to the assumed SOC thresholds. The values assumed for the mean and the coefficient of variation for the headway probability density function are reported in Table 3 and Table 4, while the values of the mean and the standard deviation for the initial SOC probability density function are reported in Table 5. Finally, the function distinguishes the vehicles that are overtaking at the entrance.
2. The “Headway estimation” function calculates the headways of the vehicles in the CWD lane and distinguishes their sequence, excluding the vehicles that are overtaking.
3. The “Headway adjustment” function compares the headways between the vehicles in the CWD lane to the minimum feasible headway. Unfeasible headways, such as those resulting from entering manoeuvres (i.e., an “out” to “in” vehicle in Fig. 5), for CWD can be generated: if the headway between two vehicles is less than the acceptable limit, the function adjusts the arrival time of the following vehicle at the detection point (i) by delaying it, as shown in the example in Fig. 5.
4. The “SOC and time estimation” function calculates, on the basis of the vehicle status at a certain node, the energy it will consume in the following section and, only for the vehicle in the CWD lane, the energy it will receive from the coils. This energy balance provides an evaluation of the final SOC for all of the vehicles. Then, the function estimates the arrival time of the vehicle at the node (i) using the speeds corresponding to the status at the node (i-1).
5. According to the SOC value previously estimated, the “Status estimation” function assigns each vehicle its status (“no charge”, “charge” or “emergency”), itslane position in the road (“OUT” or “IN” the CWD lane) and the speed.
6. The “SOC update for overtake” function calculates the number of overtaking manoeuvres along a section and updates the SOC by decreasing its value proportionally to the number of manoeuvres individuated. Then, it individuates the vehicles that are overtaking on the node.
3.2.Data setting for the simulated scenario
Table 3 and Table 4 report the main data related to basic traffic features and infrastructure layout parameters for the analysed scenario.
Table 3. Data related to traffic
Variable Value Unit
Average flow 1000 veh/h
Number of simulated vehicles 100 veh
Coefficient of variation of headway 0.2
Minimum traffic headway 1.5 s
Table 4. Data related to infrastructure
Infrastructure Value Unit
Total length of the road 5 km
Average slope 0
Section length 1 km
Chosen length of charging zones (LCZ) 20 m
Chosen inter-distance (I) 30 m
Transition coefficient 1
System efficiency ) 0.85
Power for unit length (PCZ) 50 kW/m
Minimum feasible headway in CWD lane 1.5 s
Table 5 reports the data related to vehicle motion performance, energy consumption and energy need. A vehicle with an SOC below 30% of its target is considered in an “emergency” situation, and its desired speed is set to 30 km/h, whereas if the charging level is in the range of 30% to 60% of the target value, then the vehicle is considered
in a “charge” situation, and its desired speed is set to 60 km/h. Vehicles with a level of charge above 60% of the SOC target do not need to recharge, and their position is set out of the charging lane where the maximum allowed speed is equal to 110 km/h.
Table 5. Data related to vehicle features
Vehicles Value Unit
Average starting SOC 15 kWh
Standard deviation 3
SOC target 20 kWh
SOC limit for "charge" vehicles 0.6 % of SOC target SOC limit for "emergency" vehicles 0.3 % of SOC target Speed of "charge" vehicles in the charging lane 60 km/h
Speed of "emergency" vehicles in the charging lane 30 km/h
Speed in other lanes 110 km/h
Overtake duration 10 s
4. Analysis of the main simulation results
The first aspect that should be verified after the implementation of the traffic model is the evaluation of the correctness of the traffic flow simulation. Fig. 6 reports the arrival times of all of the vehicles in the CWD lane at all of the considered nodes, where each trace in the space-time diagram describes the simulated behaviour of a different vehicle.
Considering the data reported in Fig. 6, the two different slopes of the vehicle trajectories represent the different speeds of the simulated vehicles in the CWD lane: slower vehicles, characterized by low SOC values that correspond to the “emergency” status, are individuated by the higher slope, while faster vehicles, which are the vehicles in the “charge” status, are represented by the lower slope value. The intersections of the vehicle trajectories individuate the overtaking manoeuvres simulated by the model. The fact that only two different slope values could be individuated in the chart means that in the scenario explored, the delays in the traffic flow due to the headway adjustments are quite small and do not reflect a sensible decrease in the vehicle speeds.
Furthermore, in Fig. 6, some vehicle trajectories vary their slope, individuating a change in the vehicle status from “emergency” to “charge” and consequently an increase in the vehicle speed. The trajectories that start after node 0 represent the entries in the CWD lane of “OUT” vehicles that during the simulation, decrease their SOC below the threshold that individuates charging needs.
The second parameter that should be considered to evaluate the simulation model is the trend of the vehicle SOC over the simulation time, which is reported in Fig. 7 for each vehicle in the CWD lane.
Fig. 7. SOC trend for all of the simulated vehicles in the CWD lane
Neglecting the first section, the one between nodes 0 and 1, which is only an entering section and is not equipped with the coils, the SOC trends correspond to the design assumptions: “emergency” vehicles, characterized by low SOC values, increase their SOC along the CWD lane, while “charge” vehicles maintain their SOC level along the road. Furthermore, there is also one vehicle (indicated by the arrow in Fig. 7) that enters at node 0 in “charge” status but with an SOC level next to the “emergency” threshold (6 kWh): considering the fact that the first section is not equipped, its SOC decreases below the “emergency” threshold at node 1. However, the model defines the energy balance of a vehicle along a section on the basis of the vehicle status at the previous node, and so it takes two sections to change the vehicle status to “emergency.” Therefore, the SOC of the considered vehicle increases only at node 3, reaching the “charge” threshold. For the same reason, even in this case, the model requires two nodes to detect the status change (from “emergency” to “charge”), and the vehicle status is updated only at node 4, maintaining its SOC level at node 5.
5.Conclusions
The aim of this work is to present a method for analysing the performance of the wireless inductive power transfer of electric vehicles while driving and the implications of an established Electric Vehicle Supply Equipment (EVSE) design setting on the charging state of the vehicles. Hence, a meso-scopic traffic simulator has been developed to introduce the recharge needs as a factor that influences the traffic behaviour.
The effects of the three main parameters of the system, the Length of the Charging Zone (LCZ), the Inter-distance (I) between consecutive charging zones and the vehicle speed, on the State Of Charge (SOC) of the reference vehicles have been assessed to obtain a preliminary design of the layout of the charging infrastructure. The design layout of the EVSE is a compromise between the need to minimize the installation and maintenance costs and users’ acceptance of the time required to obtain a proper recharge. For this reason, the range of speeds explored for the Charge While Driving (CWD) process is for rather low values because, for the assumed power provided by the system and the test vehicle considered, they are the most adequate with regard to a feasible expected SOC gain target.
The results depend on the power assumed for the EVSE and on the system efficiency and may be improved by increasing the on-board device dimension and the ratio between LCZ and I.
However, all of these aspects must be evaluated by considering different test vehicle characteristics: if a city car is adopted instead of a light-van, the energy balance between the energy consumed and received from the EVSE will be different because of its smaller resistance to motion at the same speed.
For this reason, to extend the service to other potential users, any possible layout individuated for freight vehicles should also be tested to adequately satisfy the design needs of the other vehicles. Because of the non-linear relationship between the vehicle consumption and its speed, if the charging speeds are high, then the advantages, in terms of ΔSOC, of lighter and more aerodynamic vehicles will increase. Further analyses could be carried out to apply the model to different scenarios, for example, by simulating traffic flows composed by different FEV types and, consequently, by individuating a more adequate EVSE design or by assuming a variable management of the power provided, also taking into account the specific features of the identified FEVs.
The results reported in section 4, “Analysis of the main simulation results,” mainly focus on the vehicle trajectories, to show the vehicle movements for the two charging types on the CWD lane, and the related SOC variation along the route. This provides a synthetic idea of the energy received and consumed by vehicles. The SOC variation, as estimated in simulation, confirms that the two speed values selected in the design phase are consistent with the ΔSOC estimated in the ideal case, where constant speed and a complete usage of the CWD lane are assumed. Indeed, in the simulated traffic scenario, the analysis considers even the overtaking cases: a cooperative overtaking model at constant speed is implemented, and vehicles do not recharge during the manoeuvre outside the charging lane.
The variation of the vehicle SOC simulated along the road is consistent with the design hypothesis, maintaining constant the SOC level for “charge” vehicles and increasing the value for “emergency” vehicles. Because the purpose of the simulation model was to introduce the energy need in the traffic behaviour and to test the EVSE design setting, the simulation has been developed on a test road equipped with a CWD system for 5 km. Longer distances could be investigated in further studies, monitoring the charging operations along the road and analysing the local and total electric energy that should be provided by the grid to satisfy the energy needs of the vehicles. More development can be performed to improve the realism of the simulator with respect to the traffic behaviour. For example, the vehicle speed in the other lanes, here assumed constant because the focus is on the CWD lane, could also be estimated according to a traffic model that relates the speed to the traffic density. Moreover, the SOC of the vehicles along the road is estimated according to the charging speeds (30 km/h and 60 km/h) assuming that the vehicle speeds are almost constant along a section. This assumption is reasonable for low traffic, but it could not be for high traffic levels, where the entry of new vehicles to the CWD lane may cause frequent disturbances in the traffic flow. This effect is important for the simulation results because it leads to a reduction of the average speeds that affect the FEV occupancy time on the CZ and consequently on the SOC dynamics of the vehicles and therefore on the global time-dependent traffic state along the CWD lane.
Many issues are still open for the CWD technology, as more solutions are under experimentation and, at present, an estimation of costs related to construction and maintenance is not possible. The cost currently seems to be high, but it should be related to the CWD usage in the future, to the business model and to the utility received by different users (e.g., drivers, car manufacturers, energy providers, road infrastructure operators, etc.). Additionally, the part of the road that is equipped may depend on many factors, such as electric power provided, travel purposes, user needs, battery features, diffusion of stationary charging stations and so on. However the analysis of these issues would require specific studies, which are out of the scope of the presented work.
Acknowledgements
This study is partially supported by the eCo-FEV project (Grant agreement no: 314411, http://www.eco-fev.eu/home.html).
The authors would like to thank Fabio Freschi for his useful support on the electrical requirements of the EVSE, CRF (Centro Ricerche Fiat) and Bruno dalla Chiara for their suggestions to investigate this subject. The authors finally thank the two anonymous reviewers for their useful comments that have improved the quality of the original manuscript.
References
Ahn, S. and Kim, J. (2011). "Magnetic Field Design for Low EMF and High Efficiency Wireless Power Transfer System in On-Line Electric Vehicles". In EuCAP 2011 (pp. 3979-3982).
Barceló, J., and Casas, J. (2005). "Dynamic network simulation with AIMSUN". In Simulation Approaches in Transportation Analysis (pp. 57-98). Springer.
Cascetta, E. (2001). "Transportation systems engineering: theory and methods". Kluwer.
eCo-FEV (2013) “Deliverable D200.1: Use cases and requirements for an efficient cooperative platform”. eCo-FEV project.
Fang He, Yafeng Yin and Jing Zhou (2013). "Integrated pricing of roads and electricity enabled by wireless power transfer". In Transportation Research Part C: Emerging Technologies, Vol. 34 (pp. 1-15).
Hoogendoorn, S. P. and Bovy, P. H. L. (2001) "State-of-the-art of vehicular traffic flow modelling". In Special Issue on Road Traffic Modelling and Control of the Journal of Systems and Control Engineering.
Kirsch, D.A. (2000). "The electric vehicle and the burden of history". Rutgers University press. OLEV Technologies website, http://olevtech.com/
Palakon, Wang, Imura, Fujimoto, Hon, Yoichi (2011). "Electric Vehicle Automatic Stop using Wireless Power Transfer Antennas". In IECON 2011 - 37th Annual Conference on IEEE Industrial Electronics Society (pp. 3840-3845).
Primove website, http://primove.bombardier.com/application/automotive/
Suh, I. S. (2011). "Application of Shaped Magnetic Field in Resonance (SMFIR) Technology to Future Urban Transportation". In CIRP Design Conference (pp. 226-232).
Sungwoo Lee, Jin Huh, Changbyung Park, Nam- Sup Choi, Gyu-Hyeoung Cho, Chun-Taek Rim (2010). "On-Line Electric Vehicle using inductive power transfer system". In Energy Conversion Congress and Exposition (ECC E), 2010 IEEE (pp.1598-1601).