Fine mapping of two major QTLs conferring resistance
to powdery mildew in tomato
Luigi Faino•Shiva Azizinia• Benyamin Houshyani Hassanzadeh• Estelle Verzaux•Maria Raffaella Ercolano•
Richard G. F. Visser•Yuling Bai
Received: 1 July 2011 / Accepted: 6 October 2011 / Published online: 3 November 2011 ÓThe Author(s) 2011. This article is published with open access at Springerlink.com
Abstract Tomato (Solanum lycopersicum) is the most cultivated crop in the Solanaceae family and is a host for Oidium neolycopersici, the cause agent of powdery mildew disease. In wild species of tomato, genes (Ol-1–Ol-6) for monogenic resistance have been identified. Moreover, three quantitative resistance loci (QRLs), namely Ol-qtl1, Ol-qtl2 and Ol-qtl3, have been mapped in Solanum neorickiiG1.1601. In this work, we developed several advanced backcross populations in order to fine-map theseOl-qtls. Resis-tant lines harboring individual Ol-qtlwere produced and used in recombinant screening. Ten recombinants were identified in chromosomal regions carrying Ol-qtl1s. The recombinant individuals were used to
produce recombinant families (RFs). By screening these RFs with molecular markers and testing them withO. neolycopersici, we could localizeOl-qtl1in a region of about 2.3 Mbp on the long arm of chromo-some 6 andOl-qtl2in a region of 2.5 Mbp on the short arm of chromosome 12. On the other hand, the presence of Ol-qtl3 locus was not confirmed in this study. The fine-mapping results further demonstrated the co-localization between Ol-qtls and genes for monogenic resistance; theOl-qtl1interval contains the Ol-1gene and theOl-qtl2interval harbors theLvgene that confers monogenic resistance toLeveillula tauri-ca, another species of tomato powdery mildew. Keywords Quantitative resistance loci (QRLs)
Powdery mildewRecombinant families
Fine mapping
Introduction
The cultivated tomato (Solanum lycopersicum) is a very important vegetable worldwide (Foolad et al. 2008). Tomato hosts more than 200 species of a wide variety of pests and pathogens that can cause signif-icant economic losses (Bai and Lindhout2007). Since the 1980s, powdery mildew epidemics caused by the biotrophic fungus, Oidium neolycopersici, have become a problem in tomato production worldwide (Jankovics et al.2008). Symptoms of tomato powdery mildew infection are white circular pustules that Luigi Faino and Shiva Azizinia are contributed equally to this
study.
L. FainoS. AziziniaB. H. Hassanzadeh
E. VerzauxR. G. F. VisserY. Bai (&)
Wageningen UR Plant Breeding, Wageningen University and Research Center, Droevendaalsesteeg 1, 6708PB Wageningen, The Netherlands
e-mail: bai.yuling@wur.nl L. FainoM. R. Ercolano
Department of Soil, Plant, Environmental and Animal Production Sciences, Federico II University of Naples, Via Universita` 133, 80055 Portici, Italy
S. Azizinia
Department of Horticulture, College of Abouraihan, University of Tehran, Pakdasht, Tehran, Iran DOI 10.1007/s10681-011-0551-6
appear predominantly on the upper sides of leaves, stems and petioles (Mieslerova et al.2004). Although fungicide can be used to control the disease, such treatments are undesirable in relation to both their costs and their failure to achieve sustainable produc-tivity. Thus, breeding of resistant cultivars is desired to control this disease.
Cultivated tomato has limited variability, largely because of natural and artificial selection that occurred during domestication and development of modern cultivars. To improve disease resistance and agro-nomic traits, tomato wild germplasm has been dem-onstrated to be a useful resource (Bai and Lindhout 2007). Resistance to O. neolycopersici has been detected among related Solanum species (Bai et al. 2005). Based on mechanisms and genetics, resistance to O. neolycopersici in tomato can be divided into three categories. The first category is monogenic resistance that is controlled by dominant genes (Ol-1, Ol-3–Ol-6) and associated with a hypersensitive response (HR) (Bai et al.2005; Li et al.2007). These dominant genes originated from different accessions of S. habrochaites and S. peruvianum. The second category is monogenic resistance that is controlled by the recessive ol-2 gene and associated with papilla formation (Bai et al.2008). Theol-2gene is found in S.lycopersicumvar.cerasiforme(cherry tomato) and belongs to a natural loss-of-function in theSlMlogene (Bai et al. 2008). The third category is polygenic resistance that is governed by three quantitative trait loci for resistance (QRL) identified in S. neorickii G1.1601 (Bai et al.2003) and associated with both HR and papilla formation (Li et al.2011).
In the last decades, considerable progress has been achieved in our understanding about the interaction of plants with pathogens. Most knowledge has been documented in complete resistance which is controlled by single dominant resistance (R) genes. According to the current hypothesis about the plant immune system, R-genes encode proteins that recognize specific path-ogen effectors. This recognition triggers a cascade of defense responses and the resistance is manifested as localized HR at the site of infection (Bruce and Pickett 2007; Chisholm et al. 2006; Jones and Dangl2006; Robert-Seilaniantz et al. 2007). Many R-genes have been cloned and most of them encode proteins with an N-terminal nucleotide-binding site (NBS) and C-ter-minal leucine-rich repeats (LRRs) (Takken et al. 2006). Protein structural similarities of the cloned
R-genes have allowed isolation and mapping of structurally related sequences referred to as resistance gene analogues (RGAs).
In contrast, only a few QRLs have been character-ized and the molecular basis underlying resistance conferred by QRLs is limited. By studying the organization of QRLs in the potato genome, Gebhardt and Valkonen (2001) proposed that the molecular basis of quantitative resistance in potato can be based on genes having structural similarity with cloned R-genes. An example of this hypothesis is the Rpi-mcd1 QRL, which confers partial resistance to Phytophthora infestans in potato and is located in a cluster of NBS-LRR genes on chromosome 4 (Tan et al.2008). Moreover, Gebhardt and Valkonen (2001) described that genes involved in the cascade of the defense response can have a role in QRL-based resistance. The difficulty in cloning QRLs is mainly due to the small effect on disease resistance that each QRL can explain. Recently, three QRLs have been cloned: the recessivepi21gene conferring resistance to blast disease in rice and coding a proline-rich protein (Fukuoka et al. 2009); the Yr36gene giving resistance to wheat stripe rust and coding a kinase-START protein (Fu et al. 2009); and the Lr34 gene coding for an ABC transporter protein and involved in resistance against fungal pathogens in wheat (leaf rust, stripe rust, and powdery mildew) (Krattinger et al. 2009). All the QRLs isolated until now are structurally different from R-genes and do not have a typical R-gene motif (St Clair2010). Even though none of the cloned QRLs has a similarity with known R-genes, there is evidence of co-localizations of QRLs with R-genes and/or RGAs (e.g. (Bai et al.2003; Geffroy et al.2000; Grube et al.2000).
Our research aims to isolate QRLs for resistance to O.neolycopersicivia map-based cloning. Previously, we reported that map positions of the three QRLs identified in S. neorickii G1.1601 co-localize with dominant genes for resistance to powdery mildew in tomato (Bai et al.2005). TheOl-qtl1interval overlaps withOl-1,Ol-3andOl-5, while the other two linked Ol-qtlsare located on chromosome 12 in the vicinity of the Lv locus that confers resistance to another powdery mildew species, Leveillula taurica. Though co-localization of QRLs withR-genes and RGAs has been identified in many cases (Geffroy et al.2000; Tan et al.2008), only a few functional studies support that QRLs are weak alleles of R-genes. Thus, cloning of
Ol-qtls will help to elucidate the structural relation-ships between the co-localizedR-genes (Ol-genes and Lv) and Ol-qtls. In this study, we fine mapped the Ol-qtl1 and Ol-qtl2 regions on the short arm of chromosome 6 and 12 respectively.
Materials and methods
Plant materials
An F2 population, advanced backcrosses and their selfing populations (BC2, BC2S1 and BC2S2) were used in this study, which are derived from an inter specific cross between the susceptibleS.lycopersicum cv. Moneymaker (MM) and resistant accession S.neorickiiG1.1601 (SN). MM was used as recurrent parent in the backcrossing. For fine mapping Ol-qtl1 on chromosome 6, we used one BC2family and one BC2S1population, which were derived from different BC1plants. Both populations were segregating for the resistantOl-qtl1 allele (SN allele) on chromosome 6 and lacking the SN alleles ofOl-qtl2andOl-qtl3on chromosome 12 (Bai et al. 2003). For fine-mapping Ol-qtl2, we used one BC2S1population, in which the SN alleles of bothOl-qtl2andOl-qtl3are present and the SN allele ofOl-qtl1is absent (Bai et al.2003). The selected recombinants were maintained to produce selfing progenies, which were named as recombinant families (RFs).
Fungal material
Oidium neolycopersici(TheOn-Ne isolate, Bai et al. 2005) was maintained and propagated on susceptible MM plants in a growth chamber at 20±2°C with 70% relative humidity (RH) and 16 h of light/day. The inoculum preparation and the inoculation were per-formed as described in Bai et al. (2003) by washing conidial spores from freshly sporulating leaves of heavily infected MM plants in tap water. Then the inoculum concentration was adjusted to 29104 conidia/ml.
Disease tests
One month-old tomato plants (growing stage: three to four true leaves) were inoculated by spraying the fungal inoculum. Inoculated plants were grown in a
greenhouse compartment at 20 ±3°C with 70% RH for symptom development. Fungal growth was eval-uated at 11, 14 and 19 days post inoculation according to the following disease index (DI): 0=no visible sporulation, 1 =very few fungal spots surrounded by necrosis and less than 5% foliar area affected (weak sporulation), 2=moderate number of fungal spots, 5–30% foliar area affected (moderate sporulation), and 3=very high number of fungal spots, more than 30% foliar area affected (heavy sporulation). An average DI was calculated over three evaluation times for each plant. As applied in our previous studies on monogenic resistance toO.neolycopersici(Bai et al. 2003), plants were considered as resistant with a DIB1, intermediated resistant with a DI 1\DIB2 and susceptible with a DI[2.
Marker generation
Markers were designed from sequences in the SGN database (Appendix 1). Primers were designed by using Primer3 software (http://redb.croplab.org/ modules/redbtools/primer3.php) and polymorphism detection were performed according to the method described by Bai et al. (2003).
Linkage map construction and QTL mapping Joinmap 4.0 (Van Ooijen2006) was used to generate a genetic map applying the Kosambi mapping function. QTL mapping was performed according to Map-QTLÒ5 software (Van Ooijen2004). A LOD threshold value of 4 was set for declaring a QTL in interval mapping (IM). A one-LOD support interval was taken as a confidence interval for a putative QTL (Van Ooijen2004).
Results
Previously, three Ol-qtls were detected by using dominant AFLP markers in an F2 population (Bai et al.2003). To increase the power in QTL detection, co-dominant markers were generated in this study. Sequences of tomato chromosome 6 and 12 were selected and converted to co-dominant CAPS makers (Appendix 1). In total, 37 markers were generated and mapped in the F2 population. For map comparison,
some AFLP markers (Bai et al.2003) were included to generate linkage groups. Then, QTL analysis was performed resulting in the detection of the three Ol-qtlsin the chromosomal regions as previously defined (Figs.1a,3a). However, the QTL intervals could not be narrowed down with co-dominant markers, which is probably due to the small size of the F2population.
Ol-qtl2is confirmed to be co-localized with theLvgene
In order to confirm the presence of two closely linked QRLs on chromosome 12, we used one BC2S1 population (named P-222; n=164) which carries SN introgressions forOl-qtl2andOl-qtl3,but lack the
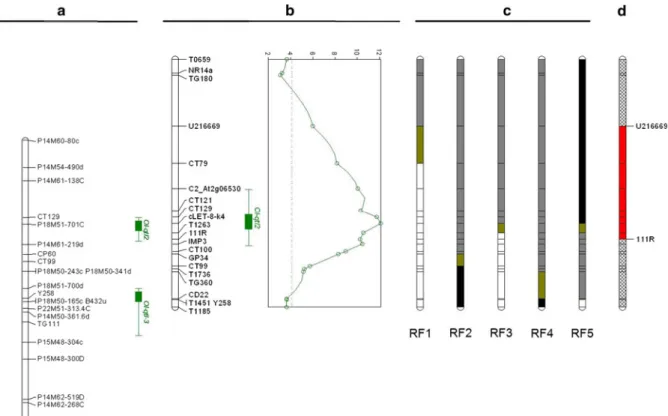
Ol-qtl1SN introgression on chromosome 6. In P-222, DI was segregating in a range between 0.6 and 3, showing a large effect of these two QRLs on resistance toO.neolycopersici. Twenty-one co-dominant mark-ers were used to genotype the P-222 population and to produce a genetic map for QTL mapping (Fig.1b). A large chromosomal region between markers TG180 and CD22 covering bothOl-qtl2andOl-qtl3showed a significant LOD value. The one-LOD confidence interval spans 1.3 cM between markers CT121 and T1263 (Fig.1b), which overlaps with the chromo-somal region whereOl-qtl2was previously mapped in the F2 population (Fig.1a, b). This QTL showed a LOD value of 12 and explained nearly 30% of the phenotypic variation in the analyzed population. Though only one peak was observed on the short
Fig. 1 The map positions of Ol-qtl2 and Ol-qtl3 shown on linkage groups of the short arm of tomato chromosome 12, which are constructed by using an F2and BC2S1population,
respectively, derived from a cross betweenSolanum lycopersi-cumcv. MM and SN G1.1601.aOl-qtl2andOl-qtl3mapped in the F2population and with CAPS markers.bOl-qtl2mapped in
the BC2S1population with CAPS markers. The graph shows the
QTL likelihood profiles of interval mapping. Thedotted line represents the LOD threshold value. In bothaandb, thegreen
barsindicate the QTL intervals of which theinner barshows a 1-LOD interval and the outer bar shows a 2-LOD interval. cGenotypes of five recombinants identified from the BC2S1
population. Theblack barson the linkage groups indicate the presence of homozygous MM alleles,white barsfor homozy-gous SN alleles andgrey barsindicate heterozygous alleles. The yellow barsshow regions where crossing-over occurred.dThe fine-mapped position ofOl-qtl2indicated by thered bar. (Color figure online)
arm of chromosome 12, the chromosomal region above the LOD threshold covers also theOl-qtl3locus (Fig.1b). Thus, the presence of theOl-qtl3locus could not be excluded.
In order to pinpointOl-qtl2, five recombinants with contrasting genotypes between T0659 and T1185 were selected to produce BC2S1 populations which were named as RF (RF-1, RF-2, RF-3, RF-4 and RF-5; Fig.1c; Table1). For each RF, 40 individuals were genotyped and tested withO.neolycopersici. DI was scored at three time points and a mean DI was calculated for each plant. All susceptible control MM plants were scored as DI=3 (Fig. 2a). According to the DI values of plants of these RFs, three groups could be discerned. The first group is the resistant group represented by RF-1, of which all the individuals except two showed a DIB2 (Table2). Since all tested plants of this RF showed complete or interme-diate levels of resistance, it is expected thatOl-qtl2is homozygous in a chromosomal region below the marker U216669 towards centromere, where all markers were homozygous for resistant SN alleles as in the parental BC2S1plant (Fig.1c).
The second group is the susceptible group repre-sented by RF-5. In this RF, 35 plants showed a DI[2 and 5 plants with a DI between 1 and 2. Since no plants could be considered as fully resistant, we regarded this RF as susceptible (Table 1). Thus, it is likely that the SN allele of Ol-qtl2 is not present in this RF, suggesting that Ol-qtl2 is located above marker 111R towards the telomere since the parental BC2S1 plant of this RF was homozygous for the MM allele (Fig.1c) in the chromosomal region above marker 111R.
The third group is segregating for resistance with DI from 0.7 to 3. Three RFs, RF-2, RF-3 and RF-4, were segregating for resistance (Fig.2b, c), indicating that their parental BC2S1plants were heterozygous for Ol-qtl2. According to marker genotypes of these plants, the chromosomal region between markers T0659 and 111R was heterozygous. In agreement with RF-5, this group pointed Ol-qtl2 to be located above 111R.
In sum, the results of the five RFs indicated thatOl -qtl2is located between markers U216669 and 111R, in a chromosome region corresponding to the 2-LOD interval of 12.2 cM in this BC2S1population (Fig.1d) with a physical distance of about 2.5 Mbp. In the Ol-qtl2 region 311 genes are predicted by using the ITAG2 annotation of the Solanaceae Genome Net-work (http://www.solgenomics.net). Out of 311 genes, about 50 are annotated as genes that can be involved in plant pathogen interaction with 13 genes containing a leucine reach repeat motif.
Ol-qtl1is confirmed to be co-localized with theOl-1gene
In order to confirm the presence of Ol-qtl1 on chromosome 6, we used a population that carries a SN introgression for Ol-qtl1, but lacks the SN introgression forOl-qtl2andOl-qtl3on chromosome 12. Sixteen CAPS markers were developed and used on the F2population. By using the markers dCT21 and dCT136 which flankOl-qtl1, two rounds of recombi-nant screening were conducted. In the first round, seven recombinants between the two markers were obtained by screening 220 BC2plants. In the second
Table 1 Results of disease test on recombinants identified in the fine-mapping ofOl-qtl2
Recombinant family Disease index (DI) DI range Tukey’s testa
Name generation (Mean±SD,n=40)
RF-1 BC2S2 1.4±0.58 0.5–2b a RF-2 BC2S2 1.9±0.50 0.7–2.8 b RF-3 BC2S2 2.2±0.56 0.8–3 bc RF-4 BC2S2 2.2±0.41 1–3 bc RF-5 BC2S2 2.5±0.36 2–3c c SDstandard deviation
a Means with different letters are significantly different at 5% level (P\0.05) b Indicates that two out of 40 plants showed a DI[2
round, 35 recombinants were found from 1100 BC2S1 plants. These recombinants were further genotyped with all the 16 CAPS markers to define crossing-over events (Fig.3b).
Most recombinants carried a crossing-over event in the chromosomal region nearby dCT21, which is the upper maker flankingOl-qtl1(Fig.1a; Bai et al.2003). Only five recombinants had a crossing-over event close to TG25 that showed the highest LOD value forOl-qtl1 in the F2 population (Bai et al.2003). The later five recombinants were selected to produce selfing proge-nies, which were named as RF-6, RF-7, RF-8, RF-9 and RF-10 (Fig.1b). Disease tests were performed on these RFs (Table2). Since the resistance level ofOl-qtl1is low, we selected plants that were homozygous for either SN or MM alleles of markers in the Ol-qtl1 interval in order to visualize contrasting phenotypes (Fig.3b). DI was scored at three time points and a mean DI was calculated for each plant (Table2). All susceptible control MM plants were scored as DI=3
(Table 2; Fig.4a), while the resistant control RF-10 had a DI of 0.43 (Fig.4b). Results of disease tests showed that, in RF-8 and RF-9, plants homozygous for SN alleles (Fig. 4c) had significant lower DI than plants homozygous for MM alleles (Fig.4d), suggest-ing that the resistance is associated with the presence of SN alleles for markers in the interval between P21M47 and dct136 (Table2; Fig.3b). In this interval, the populations RF-6 and RF-7 showed a homozygous MM genotype. As expected, the RF-6 and RF-7 displayed no significant difference of DI between plants homozygous for SN alleles and plants for MM alleles (Table2). Thus, we could conclude thatOl-qtl1 is located between marker P21M47 and dct136 (Fig.3b) in a 2.3 Mbp region, corresponding to a genetic distance of 0.9 cM in the BC2population and 0.14 cM in the BC2S1population. In theOl-qtl1region about 300 genes are predicted by using the ITAG2 annotation (http://www.solgenomics.net). Out of 300 genes, about 40 are annotated as genes that can be Fig. 2 Tomato leave infected byO.neolycopersici.aLeaflet of susceptible MM plants scored as DI=3,bleaflet of susceptible genotype (DI=3) andcleaflet of resistant genotype (DI=1) from the RF-3 population
Table 2 Results of disease test on recombinants identified in the fine-mapping ofOl-qtl1
SDstandard deviation
a Means with different
letters are significantly different at 5% level (P\0.05)
Recombinant family Genotype Disease index (DI) Turkey’s testa
Name generation (Mean±SD,n=10)
RF-6 BC2S2 MM 2.97±0.08 a SN 2.92±0.18 a RF-7 BC2S1 MM 1.89±0.74 a SN 2.25±0.71 a RF-8 BC2S1 MM 2.72±0.23 a SN 1.63±0.44 b RF-9 BC2S2 MM 2.10±0.47 a SN 1.19±0.34 b RF-10 BC2S2 SN 0.38±0.48
involved in plant pathogen interaction and 7 of them are predicted to have NBS-like or LRR-like motifs, which are typical ofR-gene.
Discussion
In this study we developed co-dominant CAPS markers based on tomato sequences and used to fine map the three QRLs that have been identified in S. neorickii G1.1601 conferring resistance toO.neolycopersici. By using advanced backcross populations, we fine mapped Ol-qtl1 in a chromosomal interval of 2.3 Mbp on chromosome 6 andOl-qtl2in a region of about 2.5 Mbp on chromosome 12. Ol-qtl3 could not be detected unambiguously in this study though we could not exclude its presence. Our results showed an effective approach in fine-mapping of QTLs, a large-scale recombinant screening in combination with phenotyp-ing progenies of the recombinants.
Factors influencing QTL mapping
Lander and Botstein (1989) proposed the first statis-tical tractable algorithm for dissecting a quantitative trait into individual genetic loci. Since then, several papers have been published to describe statistical models for QTL mapping (Wu and Lin 2006). Currently, the QTL mapping usually allows to assign a QTL in a region of about 10–20 cM in F2 popula-tions (Peleman et al.2005). With the availability of the next generation of sequencing, new approaches have been proposed (Schneeberger et al.2009). In general, several factors have been tested in order to reduce the confidence interval of a QTL such as the nature of the population used (e.g. F2 of BCnSn) (Darvasi and Soller1995), the population size, the gene effect on the phenotype (Darvasi et al. 1993) and the phenotypic evaluation (Price2006). In this study several types of populations and markers were used. Our results showed that, in the F2population, two marker types (AFLP and CAPS) resulted in the same resolution for QTL detection in the F2 population (Figs.1a, 3a), suggesting that marker types has not much impact when population size is too limited. With advanced backcross populations and enlarged population size, we could narrow down theOl-qtl2on chromosome 12 in a small interval of 1.3 cM (one-LOD interval).
Although the QTL mapping has been used already for 20 years and evolved rapidly due to the develop-ment of an almost unlimited number of markers from available genome sequences, very few genes underly-ing the quantitative trait have been cloned. In tomato, the two QTLs,fw2.2andOvate, have been cloned by using map-based cloning approaches (Frary et al. 2000; Liu et al. 2002a; Liu et al. 2002b). A crucial factor in QTL fine-mapping and cloning is the phenotype. Two aspects of the phenotyping are important: 1) the reliability of a single plant phenotype for a quantitative trait and 2) the QTL effect on the phenotype (Peleman et al.2005). The first aspect can be solved by using selfing progenies of an individual plant to increase the statistical power in QTL mapping (Darvasi and Soller1995; Peleman et al.2005; Ronin et al.2003). The second aspect involves mainly minor QTLs with small effect, which can be possibly overcome by using homozygous plants for each allele for phenotyping. As we did in fine-mapping ofOl-qtl1, the relatively small effect ofOl-qtl1was evaluated in Fig. 3 The map position ofOl-qtl1shown on linkage groups of the
long arm of tomato chromosome 6, which are constructed by using an F2and BC2S1population, respectively, derived from a cross
betweenSolanum lycopersicumcv. MM and SN G1.1601.aOl-qtl1 mapped in the F2population with CAPS markers. Thegreen bars
indicate the QTL intervals of which theinner barshows a 1-LOD interval and the outer bar shows a 2-LOD interval.bGenotypes of five recombinants identified from the BC2S1population. Theblack
barson the linkage groups indicate the presence of homozygous MM alleles,white barsfor homozygous SN alleles andgrey bars indicate heterozygous alleles.Yellowmarked area shows regions where crossing-over occurred. c The fine-mapped position of Ol-qtl1indicated by thered bar. (Color figure online)
selfing progenies of recombinants, which were homo-zygous for two different alleles of the same QRL. Transgressive segregation in QTL mapping
In quantitative trait studies it has been reported that an introgression line can have a different phenotype compared to the parental lines (Lippman et al.2007). This phenomena is called transgressive segregation and it was reviewed by Rieseberg et al. (1999). Comple-mentary genes are the primary cause of transgression in plants (Rieseberg et al.1999). However, epistasis and overdominance play a role, too. Complementary genes and overdominance, involved in transgressive segrega-tion, were described in a cross between S. lycopersi-cum9S.pennelii. In the IL6-3 and IL12-2 the color of the fruit is dark orange while in the cultivated tomato it is red and in the wild species of tomato it is green (Lippman et al.2007). The tomato fruit yield is another example in which complementary genes and overdom-inance are involved (Gur and Zamir2004).
In our study, transgressive segregation was observed in the RF-10 which showed a high level of resistance compared with other populations having the same genotype. On average, a homozygous plant carrying theOl-qtl1locus has a DI of about 1.5 which is comparable to the homozygous plants carrying Ol-qtl2. The population RF-10 showed a DI of 0.34. RF-10 is a BC2S2 population which was subjected only to positive selection for theOl-qtl1region. For all the tested populations there is no further information about other loci in the genome and it is possible that
complementary loci/genes can have a role in the extreme phenotype of this population. These results suggest that undetected loci in S. neorickii with a minor effect are involved in the resistance.
Ol-qtlsare co-localized with dominant resistance genes
Two recent reviews discussed the function of the gene(s) which can be involved in the QRL-based resistance (St Clair 2010; Poland et al. 2009). One hypothesis is that weak alleles ofR-genes can play an important role (Grube et al. 2000; Gebhardt and Valkonen2001; Brouwer et al.2004; Tan et al.2008). It has shown that RGAs inR-gene clusters conferring partial resistance to several pathogens (Simons et al. 1998; Andaya and Ronald2003; Parniske et al.1997). The I2C-1 is an homologue of the I2 gene, which confers resistance to Fusarium oxysoporum f. sp. lycoperisicy race 2. The I2C-1 belong to the same cluster as I2 but confers only partial resistance (Simons et al.1998). The same phenomena has been described for three Cf9 homologues, Hcr9A, Hcr9B andHcr9E. TheCf-9gene confers complete resistance toCladosporium fulvumrace 9 in tomato, while, all the Hcrsshow partial resistance against the some patho-gen (Parniske et al. 1997). The partial resistance conferred by a defeated or homologues R-gene was illustrated in rice for theXa21gene cluster, too. The homologue Xa21D, which is a member of the Xa21 cluster, confers only partial resistance to the Xantho-monas oryzaepvoryzae(Andaya and Ronald2003). Fig. 4 Tomato leave infected byO.neolycopersici.aLeaflet of
susceptible MM plants scored as DI=3, b leaflet of the resistant control (DI=1.5).cleaflet from susceptible pheno-type (c) of the RF-8 population showing that disease symptom is
comparable to the MM phenotype (a).dLeaflet from resistant genotype of the RF-8 population showing that disease symptom is comparable to that of the resistant control (b)
Moreover, inArabidopsisthe genesBRI1andBRF1, which are involved in the perception of flagellin peptide (FLG22) through FLS2, were mapped as QRLs (Forsyth et al. 2010) showing that genes targeting PAMPs contribute to QRL-based resistance. Leucine-rich repeats-profile and NBS-profile (van der Linden et al.2004) have been use to mapR-genes and R-gene analogues (RGAs) on genetic maps of many crops. In tomato, two different populations of S.lycopersicumwith wild relative tomatoes were used to produce RGA maps (Zhang et al. 2002; Sharma et al.2008). Based on the two RGA(s) maps and on the tomato annotation for the region of interest, severalR -gene like are mapped in both theOl-qtl1andOl-qtl2 regions. Further functional analysis is needed to verify whether these RGAs are involved in the resistance conferred byOl-qtls.
TheOl-qtl2is a major QRL, while, theOl-qtl1is a minor QTL based on the definition of Price (2006). The chromosomal region of theOl-qtl2overlaps with theLvlocus (Chunwongse et al.1997). TheLvgene confers resistance to L. taurica, another powdery mildew (Chunwongse et al.1997). This gene has been mapped in the chromosomal region between the CT121 and the CT129 (1 cM) in which genes with an LRR motif are predicted. The mechanism of resistance conferred by Lv is based on a HR, a fast
and strong form of cell death upon pathogen invasion (data not shown). Though cell death is also the main mechanism associated with resistance conferred by Ol-qtl2, it is delayed and not fast and effective enough to stop the fungal growth at early infection stages (Li et al. 2011). The Ol-qtl1 interval contains the Ol-1 gene. Resistance mediated by bothOl-qtl1andOl-1is associated with delayed cell death (Li et al.2007). The co-localization and similarity in resistance mecha-nisms between Ol-qtl1andOl-1, as well as between Ol-qtl2andLv,lead to the hypothesis thatOl-qtl1and Ol-qtl2could be allelic variants or homologues ofOl-1 and Lv, respectively. Currently, cloning of the Ol-1 andLvgenes are in progressing and candidate genes identified will be included in functional analysis for their effect on resistance conferred byOl-qtls. Open Access This article is distributed under the terms of the Creative Commons Attribution Noncommercial License which permits any noncommercial use, distribution, and reproduction in any medium, provided the original author(s) and source are credited.
Appendix 1
See Table3.
Table 3 CAPS markers showing polymorphism betweenSolanum lycopersicumcv. Moneymaker andS.neorickiiG1.1601
Name Sequence primers Tm Product size Restriction enzyme
CT100 TCAACCACAACAACGACAAAA 50 362 BstXI CCAAGGAGGCAGAGTGAAAA TG360 GACCCGGACATTTAATGGAT 50 364 XmnI TTTCGCTCTTAGCATCATGG T1263 CAGGGCCACTTAAGCTCTTG 50 364 TaaI GAATACCCAGTCCGAACCAA T1211 GCTTGGATCGTCACCCTAAA 50 356 MnII TGCACTTGGAAATGAAGCTG T1736 ATTCTCGATCAACGGACCAC 55 1200 TaqI ACACTGAGCAATGCGAATCA
cLET-8-k4 CACTTTGTGGCAATCGACAT 55 1100 BsedI
TGCCTTATGCCAAACAGAAA
T1451 GGCCGTCTCAATCTCTCTTG 55 288 MboII
GTGCCCTTAACGGGTTCTTT
T1093 TGCATCTCCCGGTGTAACG 55 339 AluI
Table 3 continued
Name Sequence primers Tm Product size Restriction enzyme
T1185 GATCCTCGTGAGCAAGAAGC 55 365 SsiI GGAATGGGCCCTGTGAAC CT189 TGTGCGTGCAATATCTGACTG 55 397 Cfr13I CAAATGGTAATGCGGCTGTGC CD22 ATTCTGAAAAGGCAAAACATCCAC 55 257 AluI GCACGCCACATTCTTCAACAG CT79 GGACCGGGTGGTATTACTAT 55 470 MspI CAAATTTTGTGCAAAGTGAA TG180 CCGTGTAATATCCAACGAGCTT 55 300 XapI CTGCATTGGCAGAAGATTCA T0659 GGGCAAATGAACTTGTTCTCA 55 1400 HhaI,PsuI AATGGTCATGGAATGGGAAA
U216669 CATACCATTTTTCCCCGATG 55 2000 AluI
TAGGCGTTATGGATGGCTTC
c2_At2g06530 ATCTGTCCCATTGCCTTTGTAAC 55 900 RsaI
AAGGTGTCTCCCTCAGAATTCAG
CT121 ATTGAAACTTGGGGCTTGTG 55 270 HaeIII
GTGTAGCCAGGTGGTGGACT
NR14A GTGGCAGGTATCTCATGGAA 55 700 PsuI
GGGAACCTCCATATACAAG
GP34 GTTATCGTTGATTTCTCGTTCCG 55 700 HpyCH4IV
CGTTGCTAGGTAAGCATGAAGAAG
IPM3 CAACATCACTTGATCAGAC 55 700 DdEI
AGTAGTTTCAGGCTAGTG 111R AGATGAAGATTTTCTTGTCTGATGG 55 750 RsaI CACTGTGTAAGGGTCAACTATAGTC 76N05 GGACATAGGTTGAGGGGCTA 58 866 GTCACAGTTCCGCTCCAGAT 23B17 AAGGTGCATCGAGAATGTCC 60 1000 Dde I CACACCCACACCATATCCAA 307J13 TCCAACCATCAGACCATTCA 60 500?800 Dde I AAGCAATCCGAGAAGGTTCA 62H07 ATTCGGTACGAGGCAGTTGA 58 853 DdeI AAATGGCAAGCCAACGTAGT 286N17 TCCAATTGCACTCTCACCAA 58 861 ApoI AGAAATGTGGGCTCCAACTG
132E23 TCTCATGCTATTGCGTGCTC 58 900 Dde I
ATGCCCTTTTGGTGTTCTTG 46G10 CCGCTTTGAAACTAGGTGGA 60 900 AluI TAATCGAGGTGCACAAGCTG 118M03 AAGAAGACGCCTTCACTCCA 60 904 MboI CAGGCAAGTCCCTTTGAGAC 194N16 TCAGGATCCGTTTGATCTCC 60 887 Apo I GCTTTTGCTCCATCAACACA
References
Andaya CB, Ronald PC (2003) A catalytically impaired mutant of the riceXa21receptor kinase confers partial resistance to Xanthomonas oryzaepvoryzae. Physiol Mol Plant Pathol 62(4):203–208
Bai Y, Lindhout P (2007) Domestication and breeding of tomatoes: what have we gained and what can we gain in the future? Ann Bot 100:1085–1094
Bai Y, Huang CC, van der Hulst R, Meijer-Dekens F, Bonnema G, Lindhout P (2003) QTLs for tomato powdery mildew resistance (Oidium lycopersici) inLycopersicon parviflo-rum G1.1601 co-localize with two qualitative powdery mildew resistance genes. Mol Plant Microbe Interact 16(2):169–176
Bai Y, van der Hulst R, Bonnema G, Marcel TC, Meijer-Dekens F, Niks RE, Lindhout P (2005) Tomato defense toOidium neolycopersici: dominantOlgenes confer isolate-depen-dent resistance via a different mechanism than recessiveol -2. Mol Plant Microbe Interact 18(4):354–362
Bai Y, Pavan S, Zheng Z, Zappel NF, Reinstadler A, Lotti C, De Giovanni C, Ricciardi L, Lindhout P, Visser R, Theres K, Panstruga R (2008) Naturally occurring broad-spectrum powdery mildew resistance in a Central American tomato accession is caused by loss of mlo function. Mol Plant Microbe Interact 21(1):30–39
Brouwer DJ, Jones ES, St Clair DA (2004) QTL analysis of quantitative resistance to Phytophthora infestans (late blight) in tomato and comparisons with potato. Genome 47(3):475–492
Bruce TJ, Pickett JA (2007) Plant defence signalling induced by biotic attacks. Curr Opin Plant Biol 10(4):387–392 Chisholm ST, Coaker G, Day B, Staskawicz BJ (2006)
Host-microbe interactions: shaping the evolution of the plant immune response. Cell 124(4):803–814
Chunwongse J, Doganlar S, Crossman C, Jiang J, Tanksley SD (1997) High-resolution genetic map of theLvresistance locus in tomato. Theor Appl Genet 95(1–2):220–223 Darvasi A, Soller M (1995) Advance intercross lines, an
experimental population for fine genetic-mapping. Genet-ics 141(3):1199–1207
Darvasi A, Weinreb A, Minke V, Weller J, Soller M (1993) Detecting marker-QTL linkage and estimating QTL gene effect and map location using a saturated genetic map. Genetics 134(3):943
Foolad MR, Merk HL, Ashrafi H (2008) Genetics, genomics and breeding of late blight and early blight resistance in tomato. Crit Rev Plant Sci 27(2):75–107
Forsyth A, Mansfield JW, Grabov N, de Torres M, Sinapidou E, Grant MR (2010) Genetic dissection of basal resistance to Pseudomonas syringaepv. phaseolicola in accessions of Arabidopsis. Mol Plant Microbe Interact 23(12): 1545–1552
Frary A, Nesbitt TC, Frary A, Grandillo S, van der Knaap E, Cong B, Liu JP, Meller J, Elber R, Alpert KB, Tanksley SD (2000)fw2.2: a quantitative trait locus key to the evolution of tomato fruit size. Science 289(5476):85–88
Fu D, Uauy C, Distelfeld A, Blechl A, Epstein L, Chen X, Sela H, Fahima T, Dubcovsky J (2009) A kinase-START gene confers temperature-dependent resistance to wheat stripe rust. Science 323(5919):1357–1360
Fukuoka S, Saka N, Koga H, Ono K, Shimizu T, Ebana K, Hayashi N, Takahashi A, Hirochika H, Okuno K, Yano M (2009) Loss of function of a proline-containing protein confers durable disease resistance in rice. Science 325(5943):998–1001
Gebhardt C, Valkonen JPT (2001) Organization of genes con-trolling disease resistance in the potato genome. Ann Rev Phytopathol 39:79–102
Geffroy V, Sevignac M, De Oliveira JC, Fouilloux G, Skroch P, Thoquet P, Gepts P, Langin T, Dron M (2000) Inheritance Table 3 continued
Name Sequence primers Tm Product size Restriction enzyme
TG164 AAGCTGCCCTGGTTCATTA 50 400 Hinf I CATTCACGTTGGTATAGTTTCAT 24F TGAGGGGAGGATTGAATGTT 58 1400 Hind II TGACCAGCCAACTGTTTGAA 215M16 GTTTTAGGCCCCTGATCGTT 58 1000 Alu I GGCGTTAATCTCCGTCTTGA TG352 CAGTGGAGGGCTTTTGATGT 58 350 Tsa I TGACTTATGCGGTTGTGCTG
U7233 AGGCATAGCAATTCTATGGATGGG 55 1500 HpyCH4IV
TTGGAACGTGCAGCAGATTGTC
301C21 CCTTAGTCGAGCCCTTTTCA 60 1000 Dde I
GATCAACGCTGAGAGCACTG
31G10 TGTTTTGAAAAGCGAATCGT 55 450 HpyCH IV
of partial resistance againstColletotrichum lindemuthia-numinPhaseolus vulgarisand co-localization of quanti-tative trait loci with genes involved in specific resistance. Mol Plant Microbe Interact 13(3):287–296
Grube RC, Radwanski ER, Jahn M (2000) Comparative genetics of disease resistance within the solanaceae. Genetics 155(2):873–887
Gur A, Zamir D (2004) Unused natural variation can lift yield barriers in plant breeding. PLoS Biol 2:1610–1615 Jankovics T, Bai Y, Kovacs GM, Bardin M, Nicot PC, Toyoda
H, Matsuda Y, Niks RE, Kiss L (2008)Oidium neolyco-persici: intraspecific variability inferred from amplified fragment length polymorphism analysis and relationship with closely related powdery mildew fungi infecting vari-ous plant species. Phytopathology 98(5):529–540 Jones JD, Dangl JL (2006) The plant immune system. Nature
444(7117):323–329
Krattinger SG, Lagudah ES, Spielmeyer W, Singh RP, Huerta-Espino J, McFadden H, Bossolini E, Selter LL, Keller B (2009) A putative ABC transporter confers durable resis-tance to multiple fungal pathogens in wheat. Science 323(5919):1360–1363
Lander E, Botstein D (1989) Mapping mendelian factors underlying quantitative traits using RFLP linkage maps. Genetics 121(1):185–189
Li C, Bonnema G, Che D, Dong L, Lindhout P, Visser RGF, Bai Y (2007) Biochemical and molecular mechanisms involved in monogenic resistance responses to tomato powdery mildew. Mol Plant Microbe Interact 20(9): 1161–1172
Li C, Faino L, Dong L, Fan J, Kiss L, De Giovanni C, Lebeda A, Scott J, Matsuda Y, Toyoda H, Lindhout P, Visser RGF, Bonnema G, Bai Y (2011) Characterization of polygenic resistance to powdery mildew in tomato at cytological, biochemical and gene expression level. Mol Plant Pathol. doi:10.1111/j.1364-3703.2011.00737.x
Lippman Z, Semel Y, Zamir D (2007) An integrated view of quantitative trait variation using tomato interspecific introgression lines. Curr Opin Genet Dev 17(6):545–552 Liu H, Reavy B, Swanson M, MacFarlane SA (2002a)
Func-tional replacement of the tobacco rattle virus cysteine-rich protein by pathogenicity proteins from unrelated plant viruses. Virology 298(2):232–239
Liu J, Van Eck J, Cong B, Tanksley S (2002b) A new class of regulatory genes underlying the cause of pear-shaped tomato fruit. Proc Natl Acad Sci USA 99(20):13302–13306 Mieslerova B, Lebeda A, Kennedy R (2004) Variation in Oid-ium neolycopersicidevelopment on host and non-host plant species and their tissue defence responses. Ann Appl Biol 144(2):237–248
Parniske M, Hammond-Kosack K, Golstein C, Thomas C, Jones D, Harrison K, Wulff B, Jones J (1997) Novel disease resistance specificities result from sequence exchange between tandemly repeated genes at theCf-4/9 locus of tomato. Cell 91(6):821–832
Peleman J, Wye C, Zethof J, Sorensen A, Verbakel H, van Oeveren J, Gerats T, van der Voort J (2005) Quantitative trait locus (QTL) isogenic recombinant analysis: a method for high-resolution mapping of QTL within a single pop-ulation. Genetics 171(3):1341–1352
Poland JA, Balint-Kurti PJ, Wisser RJ, Pratt RC, Nelson RJ (2009) Shades of gray: the world of quantitative disease resistance. Trends Plant Sci 14(1):21–29
Price A (2006) Believe it or not, QTLs are accurate! Trends Plant Sci 11(5):213–216
Rieseberg L, Archer M, Wayne R (1999) Transgressive segre-gation, adaptation and speciation. Heredity 83(4):363–372 Robert-Seilaniantz A, Navarro L, Bari R, Jones JD (2007) Pathological hormone imbalances. Curr Opin Plant Biol 10(4):372–379
Ronin Y, Korol A, Shtemberg M, Nevo E, Soller M (2003) High-resolution mapping of quantitative trait loci by selective recombinant genotyping. Genetics 164(4): 1657–1666
Schneeberger K, Ossowski S, Lanz C, Juul T, Petersen AH, Nielsen KL, Jorgensen JE, Weigel D, Andersen SU (2009) SHOREmap: simultaneous mapping and mutation identi-fication by deep sequencing. Nat Methods 6(8):550–551 Sharma A, Zhang L, Nin˜o-Liu D, Ashrafi H, Foolad M (2008) A
Solanum lycopersicum9Solanum pimpinellifolium link-age map of tomato displaying genomic locations of R-genes, RGAs, and candidate resistance/defense-response ESTs. Int J Plant Genomics. doi:10.1155/2008/ 926090
Simons G, Groenendijk J, Wijbrandi J, Reijans M, Groenen J, Diergaarde P, Van der Lee T, Bleeker M, Onstenk J, de Both M (1998) Dissection of the fusariumI2gene cluster in tomato reveals six homologs and one active gene copy. Plant Cell 10(6):1055–1068
St Clair DA (2010) Quantitative disease resistance and quanti-tative resistance loci in breeding. Ann Rev Phytopathol 48: 247–268
Takken FL, Albrecht M, Tameling WI (2006) Resistance pro-teins: molecular switches of plant defence. Curr Opin Plant Biol 9(4):383–390
Tan MY, Hutten RC, Celis C, Park TH, Niks RE, Visser RG, van Eck HJ (2008) The R (Pi-mcd1) locus from Solanum microdontuminvolved in resistance toPhytophthora infe-stans, causing a delay in infection, maps on potato chro-mosome 4 in a cluster of NBS-LRR genes. Mol Plant Microbe Interact 21(7):909–918
Van der Linden CG, Wouters DCAE, Mihalka V, Kochieva EZ, Smulders MJM, Vosman B (2004) Efficient targeting of plant disease resistance loci using NBS profiling. Theor Appl Genet 109(2):384–393
Van Ooijen J (2004) MapQTL 5 Software for the mapping of quantitative trait loci in experimental populations. Kyazma BV, Wageningen
Van Ooijen J (2006) JoinMapÒ4 Software for the calculation of genetic linkage maps in experimental populations. Kyazma BV, Wageningen
Wu R, Lin M (2006) Functional mapping-how to map and study the genetic architecture of dynamic complex traits. Nat Rev Genet 7(3):229–237
Zhang L, Khan A, Nino-Liu D, Foolad M (2002) A molecular linkage map of tomato displaying chromosomal locations of resistance gene analogs based on aLycopersicon escu-lentum9Lycopersicon hirsutum cross. Genome 45(1): 133–146