Dis cus si on Paper No. 16-078
The Contribution of
Different Public Innovation Funding
Programs to SMEs’ Export Performance
Dis cus si on Paper No. 16-078
The Contribution of
Different Public Innovation Funding
Programs to SMEs’ Export Performance
Rebecca Liu and Christian Rammer
Download this ZEW Discussion Paper from our ftp server:
http://ftp.zew.de/pub/zew-docs/dp/dp16078.pdf
Die Dis cus si on Pape rs die nen einer mög lichst schnel len Ver brei tung von neue ren For schungs arbei ten des ZEW. Die Bei trä ge lie gen in allei ni ger Ver ant wor tung
der Auto ren und stel len nicht not wen di ger wei se die Mei nung des ZEW dar.
Dis cus si on Papers are inten ded to make results of ZEW research prompt ly avai la ble to other eco no mists in order to encou ra ge dis cus si on and sug gesti ons for revi si ons. The aut hors are sole ly
The Contribution of Different Public Innovation Funding
Programs to SMEs’ Export Performance
Rebecca Liua and Christian Rammerb
November 2016
Abstract
This paper studies the effects of different public innovation funding programs on the innovation output and export performance of small and medium-sized enterprises (SMEs). We evaluate the effectiveness of regional, national and European funding programs
implemented in Germany for both product and process innovations. Our panel study shows that public financial support contributes to higher innovation outputs, which in turn translates into higher export success in later years. This relation however only holds for certain sources of public funding and certain types of innovation output. Innovation support from the
European Union and national programs for cutting-edge technology that results in higher sales with new-to-market products shows a significant positive effect on SMEs’ export performance. For funding programs run by regional authorities, we find similar though relatively smaller impacts on both innovation output and exporting. Bottom-up funding at the national level—which allows firms to freely define the design of the funded innovation projects in terms of content and cooperation—increases sales with innovations that are only new to the firm, but these innovations have limited impacts on export success. Our results suggest that public innovation programs should challenge SMEs to go for more ambitious innovations in order to strengthen their competitiveness.
Keywords: Public Funding, SMEs, Innovation Outputs, Exporting, Panel Study, Matching JEL: O32, O38, F14
a Lancaster University Management School, United Kingdom
b Centre for European Economic Research (ZEW), Mannheim, Germany * Corresponding author: Lancaster University Management School
Lancaster, LA1 4YX
United Kingdom
E-Mail: [email protected]
Phone: +44-1524-594767
Acknowledgements: We thank Katrin Hussinger for valuable comments on an earlier version of this paper. The usual disclaimer applies.
1
1. Introduction
Policy makers in most industrial countries embark on various financial support programs to stimulate small and medium-sized enterprise (SME) innovation. Two underlying arguments justify this public investment well. One central argument is ‘market failure’ resulting from the limited appropriability of the returns from innovation due to knowledge spillovers (Arrow, 1962). This argument is particularly valid for SMEs as limited resources and a lack of control of markets complicate the appropriability of innovation returns. As a result, without public support, SMEs tend to underinvest in innovation. Another justification signifies the economic importance of SME innovation. SME innovation has been viewed by many as an engine to deploy new technologies and new market opportunities, increase employment, and hence strengthen economic development and social benefits (Acs and Audretsch, 1990). Thus, many governments at the local, national and supranational level design and introduce various types of innovation financial support programs to invigorate marketable innovations for the growth of SMEs. While it is clear that different public support schemes are launched to nurture innovative SMEs, the effectiveness of these public investments is still far from clear, at least in two major areas. First, while multiple different forms of public supports are deemed necessary, prior work has noticed that these essential differences do not receive sufficient attention in many of the existing evaluation studies (e.g., Georghiou, 2002; Falk, 2007). Second, most evaluation studies focus on immediate effects of funding in innovation input or crowding out effects, leaving their long-term effects largely under-addressed (e.g., Doh and Kim, 2014; Hottenrott and Lopes-Bento, 2014). This paper addresses these issues by studying the effects of different public funding programs for SME innovation on two long-term outcomes – product commercialization and market expansion. To address the differences of public innovation support programs, technological ambition, geographic focus and business scope are among the most prominent ones. The concept of ‘lead market’ (Beise, 2004, 2001; Bartlett and Ghoshal, 1990) has drawn much attention to the idiosyncratic features that have significant implications for public innovation investment. With regard to the desired objectives of public support for SME innovation, it is necessary to study product commercialization and market expansion (Doh and Kim, 2014; Link and Scott, 2010). Product commercialization is a prerequisite for transforming innovative capabilities into a competitive advantage of SMEs. Market expansion is a key growth strategy of SMEs (Golovko and Valentini, 2011). Prior research suggested that when deciding their growth
2
strategy, firms often expand and improve their product markets through innovation (e.g., Ansoff 1965). This points to product commercialization and market expansion entailing the potential for economic growth that policy makers are aiming for. Nevertheless, despite ample literature evaluation, micro-econometric studies into product commercialization and market expansion of subsidized innovation projects are relatively rare (Bérubé and Mohnen, 2009; Moretti and Wilson, 2014; Bronzini and Piselli, 2016).
For many SMEs, an internationalization strategy is essential for market expansion and growth. This is because many innovative SMEs are specialized in niche markets and focus on narrowly defined fields of technology. The potential of product commercialization within their home country is often limited due to restricted demand. Expanding markets
geographically thus become a compulsory action for many innovative SMEs in order to grow. Because of its relatively low cost and easier access and exit, ‘exporting’ is by far the most pertinent activity towards SME innovation’s product commercialization of market expansion (Golovko and Valentini, 2011; Love and Roper, 2015).
Accordingly, this paper investigates the effects of different types of public innovation funding on SMEs’ innovation outputs and how this leads to their export performance. We conducted a panel study based on a unique dataset from the German Innovation Survey, ranging from 2001 to 2014. Germany provides an important case study of SME support policies for its relatively broad range of funding schemes that have been implemented over many years. More importantly, not only is the German Innovation Survey designed as a panel study (see Peters and Rammer, 2013), but it also provides additional data that are not part of the harmonized questionnaire of the Community Innovation Survey (CIS), such as export sales volume, labor and material costs and capital stock. These non-CIS data are unique and important for this study.
This paper contributes to knowledge in three ways. First, due to the longevity of the public intervention in SME innovations, there is still a policy imperative in seeking assurance of such intervention. This paper addresses this important and yet under-researched issue, contributing a systematic evaluation to the outcome of public investment for SME
innovations. Second, this paper unveils and compares the effectiveness of complex public provision at different levels, with different schemes and for different types of innovations. It calls for attention to the heterogenic program characteristics in the evaluation of funding
3
policy. Finally, in addressing the constraint of niche markets, many SMEs follow a competitive strategy based on internationalization. Exporting across national boarder is especially crucial for EU member states that expect to enjoy the single market benefit in transferring innovative capacities into revenue. As the management of public resources is a central topic in EU policy agendas, this paper provides new insights into public interventions in SME innovations for the region.
This article is structured as follows. Section two summarizes a review of relevant literature and outlines research objectives. Section three presents the institutional background with an overview of the public funding schemes for SME innovations in Germany. Section four reports the research method, followed by a discussion of empirical results in Section five. Section six concludes this article by summarizing the implications for theory and practice (policymaking in particular), the limitations of the study and suggestions for further research.
2. Literature Background and Research Questions
SMEs now account for over 95% of firms and 60-70% of employment in many economies (OECD, 2005). It is well evidenced that SME innovation plays a key role in nurturing the job creation and technological leadership that are associated with employment growth and hence improving social benefits (Potter and Proto, 2007; Benett, 2008; Link and Scott, 2010). With this backdrop, the notion that SME innovation demands public financial support is well supported (Hottenrott and Lopes-Bento, 2014; Doh and Kim, 2014). According to economic theory, perfect competition is problematic in the case of innovation because of the issues of appropriability, opportunism and uncertainty. The class argument of ‘market failure’ (Arrow, 1962) resulting in underinvestment in innovation is particularly valid for SMEs as limited resources complicate the protection of their intellectual assets and the provision of internal means to conduct innovation at a sufficiently large scale (Storey, 1994; Martin and Scott, 2000; Audretsch et al., 2002). Because SMEs are small, they lack control of the markets in which they operate (Bennett, 2008). This lack of control is perceived as inducing a high risk of failure and prompts consideration of the issue of appropriability because of the nature of knowledge as a public good. Innovation is by all means a costly investment and
4
As a result, these perceived risks largely impede SMEs investment in innovation. In order to urge innovative SMEs to grow, financial support programs are often on the public policy agenda. These subsidies are designed in line with different policy objectives. The concept of a ‘lead market’ (Beise, 2004 and 2001; Bartlett and Ghoshal, 1990) provides a justification. The lead market approach highlights that associations exist between country-specific market attributes, lead and lag markets, and the degree of technological novelty. For example, innovations that result from domestic demand are expected to be successful in the domestic markets and yet are very likely to be unsuccessful in foreign markets if user requirements and demand preferences differ significantly. It also requires attention to a different degree of innovation novelty that better fits the country-specific market demands (Beise, 2001). These idiosyncratic features reflect a need for different types of support schemes to better address firms’ needs and distinct market demand. Furthermore, product and process innovations are equally important for SMEs’ growth. Product innovation highlights new products/services introduced by a firm; process innovation reflects changes in the way firms create and deliver such products, aiming at reducing cost or improving quality (Damanpour et al., 2009). And yet, while product innovation has received considerable attention, our knowledge about the effects of public support on process innovation remains underexplored.
The literature pinpoints that different public innovation support schemes are needed to address distinct aspects in technological ambition, geographic focus and business scope. Noticeably, most evaluation studies into public support rarely consider these differences and instead often employ a rather general perspective. In this light, Falk (2007), who studies the effects of public support schemes on firms’ innovation activities, notices this shortfall and calls for more attention to support program portfolios and their interactions. In a similar vein, Martin and Scott (2000), who study the design of public innovation support and market failure, also stress that a ‘general’ evaluation framework is inappropriate and suggest that differences, such as differences in technology ambition (e.g., incremental vs. fundamental breakthroughs), must be taken into account in evaluating public innovation support. They remind us that these variations are sufficiently important aspects in properly explaining the performance of support policies.
In considering the underlying objectives of governmental support for SME innovation, a large amount of literature has explored the relationship between SME innovation and market
5
expansion, especially through internationalization (e.g., Laforet and Tann, 2006; Brambilla et al., 2012). This is because product market improvement through innovation and entering new geographical markets through internationalization are two major growth strategies for SMEs (Lu and Beamish, 2001; Yasuda, 2005). Growth is vital to SMEs. In the absence of growth, the likelihood of their survival is significantly low (Golovko and Valentini, 2011). As a firm’s competitiveness is essential to its market growth, marketable innovation is critical. Product commercialization is a prerequisite for transforming innovative capabilities into its competitive advantage for market expansion, especially when concerning
internationalization. In this area, exporting is, by far, the most significant for SMEs
expansion into foreign markets (Golovoko and Valentini, 2011; Sui and Baum, 2014; Love and Roper, 2015). Compared to other forms of market expansion into foreign countries (such as foreign direct investment or joint venture), exporting tends to be more cost effective, less risky and easier to manage, so that it better suits SMEs’ ‘limited resources’ nature (Ganotakis and Love, 2011; Roper et al., 2008). More importantly, for policy makers, market expansion through exporting reinforces firms’ growth and job creation at the firm’s home base, whereas foreign direct investment involves shifting resources and growth opportunities to locations abroad (Golovko and Valentini, 2011; Love and Roper, 2015). This positive effect of market expansion on employment and growth at the firms’ home base is exactly what policy makers are ultimately aiming for.
This stream of research has suggested that public innovation financial support is needed to stimulate SME innovation, aiming for two long-term outcomes – product commercialization and market expansion through exporting. Prior literature, however, points out that most evaluation literature into public innovation support focuses on immediate or direct effects, leaving its long-term effectiveness largely unaddressed. For example, some examine the effects of public grants on R&D investment and employment (e.g., Czarnitzki and Lopes-Bento, 2014 and 2013; Aerts and Czarnitzki, 2006; Aerts and Schmidt, 2008) and find positive effects. Others evaluate public innovation support on patent performance (e.g., Bronzini and Piselli, 2016; Doh and Kim, 2014) and also find positive effects. To the best of our knowledge, few papers study the impact of public funding on product commercialization and export performance with very few exceptions (e.g., Link and Scott, 2010; Guo et al., 2016).
6
To address these issues, this study focuses on two major research questions: first, how different public funding programs impact on product and process innovation outputs of SMEs; second, how these effects in turn impact SMEs’ export performance. As suggested in the literature, innovative activity tends to be clustered. Public support is often initiated to better respond to the unique characteristics of the respective ecosystems for innovation activities. In view of this nature, this study, rather than studying public support in a general term, provides a comparison of the effects of public innovation funding programs from sources at three levels – regional, national and European. Furthermore it is suggested that innovation support often varies by the degree of technological novelty and public funding schemes may be designed for different purposes. For example, to promote technology leadership, some support programs may focus on ‘technological frontier’ innovations, whereas others may nurture SMEs’ initiation (many are incremental innovations) to better assist SMEs growth. From a supporting perspective, these are two different directions requiring different degrees of public financial support. Hence, this study also examines the support effects of the program design, which are different from the degree of innovation novelty. Finally, process innovation is increasingly deemed to be an important source of competitiveness. Despite its widely recognized market value, process innovation however has received little research attention (Piening and Salge, 2015). Therefore, in addition to the assessment on the product innovation support, this study provides empirical investigation into process innovation. Four research objectives are addressed by conducting a panel study of the public innovation finding programs for SMEs in Germany. The next section provides the institutional background.
3. Public innovation funding for SMEs in Germany
A variety of public financial schemes are available to support SME innovations in Germany. For the purpose of this paper, it is useful to categorize them into three levels: the regional (State Governments), the national (Federal Government) and the European (EU Commission and multilateral programs). At all three levels, support schemes offer grants for innovation projects based on an evaluation of project proposals. Funding programs mainly differ by the size of funding, by certain project requirements and by their aims and objectives in
7
Among the three levels, the regional funding programs (supported by State Governments) tend to be smaller in terms of the funding amount and the innovation project size. More importantly, the funding schemes often favor local collaborated projects that create market comparative advantages for the region (i.e., the State), or ‘smart specialization’1 as it is called today. Despite their smaller size and geographic focus, regional funding schemes are
especially attractive to SMEs because of its high success rate. In Saxony, for example, more than 85% of submitted project proposals received funding (PricewaterhouseCoopers, 2014). Typically, the regionally funded projects are completed in 1-2 years before
commercialization. The typical project size is around half a million euros. Since the State Governments provide the bulk of institutional funding for universities and for many governmental research labs, a particular priority of regional innovation programs is to establish and intensify collaboration between firms and the regional public research infrastructures.
During the period studied in this paper, the German Federal Government basically runs two types of innovation support measures for SMEs at the national level. The single largest program—in terms of the number of SMEs receiving funding—is the Central Innovation Programs for SMEs (ZIM) run by the Federal Ministry of Economics.Under this scheme, SMEs are allowed to define the project content but must demonstrate significant market performance (e.g., increasing innovative sales, improving competitiveness) through a robust commercialization plan.2 We term this type of federal funding a ‘bottom-up’ program to highlight that the marketable innovative ideas are driven by SMEs. A second group of the Federal Government support schemes focuses on technological novelty (typically aiming at cutting-edge technology) together with the underlying commercialization prospects. We name it the technology program. This program supports projects that are typically larger in size and often involve SMEs, large enterprises, universities and public research organizations. The funded projects typically cost several million euros with project duration from two to three years before launch, whereas the bottom-up funded projects are mostly less than one
1
See the chapters on each State in the Federal Report on Research and Innovation (BMBF, 2016).
2
There is a similar funding program at the Federal level (also overseen by the Federal Ministry of Economics) providing low-interest loans for innovation projects, called the ERP Innovation Program.
8
million and last about two years. To better understand the effect of the Federal Governments financial support schemes, we study both bottom-up and technology programs.
Funding of innovation projects of German SMEs by European organizations is largely confined to European Commission programs. In the period covered by our empirical analysis, the single most important EU Commission schemes for SME innovations was the Framework Program for Research and Technological Development (FP). The program is similar to the technology-frontier programs of the German Federal Government. Evaluation and selection criteria for grant recipients are based on scientific excellence and relevant socioeconomic aspects. FP projects are significantly larger in size than projects funded by regional or national programs, though the amount of funding per SME can be smaller due to the large number of project participants. The typical project size is between five and ten million Euros, and the project duration is around three years. Other European support schemes for SMEs include the Eurostars Program, which provides funding for collaborative R&D projects involving at least on SME and at least two partners (including universities and public research organizations) from two different member states. Eurostars aims at
supporting new technology development in SMEs that can be commercialized within three years after project completion (see Makarow et al., 2014). Table 1 provides a snapshot of the public funding programs at the three levels mentioned above.
Overall, the regional as well as the bottom-up Federal support scheme mainly focus on applied research and refrains from pre-defining thematic areas of research. SMEs may use these grants to strengthen their existing comparative advantages and upgrade their product portfolio. Both can be particularly helpful when adapting existing products as well as service innovations for the needs of foreign markets. Federal technology programs on the other hand are more likely to push breakthrough novelties as the supported projects are generally larger and more ambitious than those supported by other domestic supporting schemes. While the support programs at the European level may be the least attractive as a result of complexity owing to the large number of participants and the resulting low success rates, the EU funding programs facilitate access for SMEs export activities, which are essential for SME
innovation’s marketability and growth. In contrast, both the German regional and national programs incline towards collaboration and knowledge exchange within the domestic innovation system, limiting their understanding of foreign markets.
9
Table 1: Public funding schemes for innovation in SMEs in Germany
National level European level State level1) Bottom-up (ZIM) Technology programs FP72) Eurostars Type of R&D applied applied technologi
cal frontier
technologi-cal frontier
applied Technology focus none or
clusters
none ~30 fields 11 fields none Typical project size (incl. all project
partners)
0.5 m€ 0.5 m€ 4 m€ 8 m€ 1.5 m€ Typical project duration 1-2 years 2 years 2-3 years 3 years 2-3 years Share of collaborative projects ~75% ~75% >90% 100% 100%
Success rate 50-90% 60-70% 15-20% 10-15% 10-15%
No. of SMEs from Germany receiving a grant (p.a.)
~2,000 ~3,500 ~2,500 ~350 ~30
Amount of public funding to SMEs in Germany (p.a.)
~200 m€ ~300 m€ ~450 m€ ~100 m€ ~6 m€ Public funding per SME and per year ~70 t€ ~50 t€ ~120 t€ ~70 t€ ~70 t€ Figures refer to the average of the years 2008-2012 or the nearest period available.
1) State programs differ considerably. The table provides details for the most important group of programs that provide grant funding for R&D projects in SMEs. - 2) All details only refer to FP7 projects involving SMEs. Source: Rammer et al. (2016, pp. 137ff).
4. Research Method
4.1 Empirical Strategy
The empirical strategy of this study is based on several assumptions. First, we assume that a likely effect of funding on exporting is indirect and is driven from an SME’s innovation output. By receiving public funding, SMEs may have better access for critical external knowledge, allowing them to generate higher innovation results than in the absence of public funding. Better innovation performance is critical for export success as it compensates certain export disadvantages of SMEs, such as a lack of reputation in foreign markets and high costs of entering markets abroad. We hence expect that public funding (F) increases innovation output (INN), and the additional innovation output that can be attributed to public funding (INNF) positively affects export performance (EXP).
Second, we expect that the impact of public funding on exports is heterogeneous. The first source of heterogeneity relates to different levels of additionality (i.e., one program is more effective in increasing an SME’s innovation output than another), whereas the second refers to a qualitative aspect. How innovation contributes to exporting varies, as innovations that
10
are designed for a local or national market may not meet demand preferences in other markets. In addition, the levels of novelty and (technological) ambition may also contribute to these variations as innovations with a lower level of novelty are likely to provide fewer export advantages than more radical innovations.
Third, this study takes a potential selection bias (Hussinger, 2008) into account. Since producing successful innovations (and subsequent economic impacts following successful innovation) is often the concern, funding bodies usually tend to select those firms that promise high innovation success and possess strong capabilities to transfer innovation into economic performance. As a result, funded firms may produce a higher output and outcome than non-funded firms. This higher output however cannot necessarily be attributed to public funding, but may simply reflect the firms’ higher capabilities. In the literature on
econometric evaluation of innovation policies, different strategies have been developed to address this potential bias, including difference-in-difference estimators, selection correction models, instrumental variable (IV) estimation and non-parametric matching approaches. In recent years, matching approaches have been widely used for evaluating innovation policies (see Czarnitzki and Lopes Bento, 2012, 2013, 2015). In the present paper, we follow this stream of research and evaluate the contribution of public funding to innovation output by employing a matching estimator. In a second step, we use the estimated contribution of public funding to innovation output to estimate the (indirect) impact of public funding on the export performance of SMEs. This approach is similar to that taken by Czarnitzki and Hussinger (2004) to analyze the impact of public funding on technological performance. The main advantage of using a matching approach compared to selection correction models or IV estimation is that neither an assumption about the functional form for the outcome equation nor an assumption about the distribution of error terms is needed. In addition, we also avoid the problem of finding valid and economically convincing instruments, which is especially helpful to this study as to analyze four different types of public intervention would require four different instruments. The main disadvantage of the matching estimator is that it only controls for observed heterogeneity among funded and not funded firms. In the
presence of unobserved variables that determine both the probability of receiving public funding and innovation outcome, the matching results would be biased. We believe that this
11
situation is not the case in our analysis since we have a huge set of covariates at hand that represents the major determinants of public funding and innovation output.
The first step of our empirical strategy is to estimate the effect of receiving public funding of type k (Fk= 1, k including regional, national bottom-up, national cutting-edge technology,
and European funding) on innovation output of type m (INNm, m including sales with
new-to-market product innovations, sales with only new-to-firm product innovations, and cost reduction owing to process innovations). This average ‘treatment effect on the treated’ TT is given by the difference between the observed innovation output of type m in year t of a firm i
having received public funding of type k (TINNkm) and the counterfactual situation if the same
firm had not received public funding (CINNkm).
TT
km = E(Tikmt) = E(TINNikmt| Fikt = 1) - E(CINNikmt|Fikt = 1) (1)
Naturally, the counterfactual situation cannot be observed for a firm that has received public funding. Building upon the conditional independence assumption of Rubin (1977), we estimate this counterfactual situation by using a control group of non-funded firms with very similar characteristics X (see Almus and Czarnitzki, 2003, for a detailed discussion of
employing matching methods for evaluating public innovation funding):
E(CINNikm|Xi, Fik = 1) = E(CINNikm|Xi, Fik = 0) (2)
For identifying CINN in funded firms (Fk = 1), we apply a propensity score matching using
the Mahalanobis measure of distance. For each funded firm i, a control firm (not having received public funding of the same type k that firm i has received) is identified that shows the closest distance to the funded firm in terms of the Mahalanobis distance measure. Funded firms with probabilities larger than the maximum and smaller than the minimum in the
potential control group are excluded (‘common support restriction’). Note that control firms for firms funded under a certain program type k may also include firms funded through other program types.
The propensity score is derived from a policy model on the determinants of receiving public funding (PUB). We consider a set of variables that may determine a firm’s decision to apply for funding and the probability that the program agency will choose the firm as a beneficiary of public funding (vector PD). This includes the financial situation of a firm (using the credit
12
rating of Germany’s largest credit rating agency, Creditreform, as a proxy), its in-house resources for conducting innovation activities (R&D activities, human capital) and the stock of patents (as a measure of a firm’s capacity to produce new technological knowledge).3 The model also contains a firm’s export activities (EX) in order to control for a likely strategy of agencies to focus funding on firms that are already active in export markets. Further control variables (vector CTR) include age, size, sector and region.
As the information on public funding refers to a three-year period (following the usual methodology in innovation surveys to collect innovation-related data for a multi-year period that considers the fact that most innovation projects run for more than one year), all
independent variables of the propensity score model are measured for the first year of the three-year reference period. The public funding model is estimated for each type k of public funding and for each year t separately and reads as follows:
PUBi,kt kt + 1,kt PDi,kt-2 + 2,ktEXi,kt-2 + kt CTRi,kt-2 + i,kt
for k {1,2,3,4}, for t {1,...,13} (3)
is a constant, and are coefficients to be estimated, and is a firm-specific error term. In a second step, we analyze whether the estimated firm- and time-specific treatment effect
T
ikmt affects the export performance of firm i (EXP) while also considering the impact of
innovation output firm i would have achieved in the absence of public funding (CINNm). The
latter variable is calculated by subtracting the estimated treatment effects Tkm from the
observed level of innovation output for each of the three output indicators INNm.
C
INNimt = INNimt –
kTikmt (4)Note that CINNm can be negative if the sum of the estimated treatment effects is larger than
the observed innovation output. Treatment effects may be negative if control firms show a
3
We also considered to including innovation expenditure in the public funding model since the level of financial resources a firm devotes to innovation is often found to be a major predictor of innovation output. However, the innovation expenditure variable turns out to be highly correlated with R&D activities and the stock of patents. In order to avoid multicollinearity problems, we did not include this variable.
13
higher innovation output than the treated firms. For not funded firms, CINNm is equal to C
INNm since treatment effects for this group of firms are zero by definition.
Export performance is measured as the share of sales generated from customers located abroad (export ratio). We consider a one-year time lag between innovation output and export performance in the base model, but also test a zero and a two-year lag. The export model controls for the initial export performance, which implies that the funding effect relates to a change in export performance rather than to the level. We also include a number of control variables (CTR) in order to capture other determinants of SMEs’ export activities.
EXPit+1 = + EXPit +
k m
TkmTikmt +m
CmCINNimt + CTRit + it+1 (5)The control variables for the export model (5) are inspired by related studies (Arnold and Hussinger, 2010; Beise-Zee and Rammer, 2006; Cassiman et al., 2010) and include indicators on price and quality advantages (unit labor costs, labor productivity, stock of trade marks, material input share) as well as firm-specific resources and capabilities (size, age, capital intensity, proximity to an international border, part of a multinational group). We also control for the presence of product and process innovation since the innovation strategy of innovative SMEs mirrored by these two types of innovation may also affect export results in addition to the other model variables. All models also include industry and time dummies. The export model is estimated by random effects panel regressions.
4.2 Data
Our study uses data from the German Innovation Survey, which is part of the Community Innovation Surveys (CIS) coordinated by the Statistical Office of the European Commission. In contrast to most other national CIS, the German Innovation Survey is an annual survey based on a panel sample (called Mannheim Innovation Panel - MIP). The MIP goes beyond the standard requirements of the CIS in terms of size and sector coverage, survey frequency and the information collected through the survey. This is particularly important for our study as we heavily rely on these non-CIS information, including the volume of export sales, labor and material costs, capital stock and more detailed information on innovation results. The annularity of the data is another critical data requirement in order to implement our model
14
approach and to investigate time lags between funding, innovation output and export performance.
The panel sample of the MIP was drawn in 1993 (for manufacturing) and 1995 (for services) and has been updated every second year since to compensate for panel mortality (see Peters and Rammer, 2013 for more details on the survey). In this paper, we focus on a 15-year period, ranging from 2001 to 2014. The year 2001 is the first year after the introduction of the new euro currency. By abolishing fluctuations in currency exchange rates for many of the most important trading partners of Germany, market expansion was significantly eased for SMEs. Starting our panel one year after this trade-enhancing event helps reducing the bias in our analysis. The annual gross sample size of the German Innovation Survey (as of 2014) is around 35,000 firms. As the survey is voluntary, and owing to the high response burden due to the lengthy questionnaire, response rates are relatively low at 25% to 35%.4 The panel consists of a net sample of 5,000 to 8,000 firm observations per year based on questionnaire responses.
For our analysis, we restrict the sample to innovative SMEs as we only have information on public innovation funding for firms that conducted some innovation activities during the three-year reference period. Following the SME definition of the European Union, we use a 250-employee threshold to delineate SMEs from larger enterprises. As we have panel data at hand, we have to decide what to do with firms that pass this threshold over time. We
consider a firm being an SME as long it had less than the threshold number of employees at least one year during the observation period and at the same time never more than 500 employees in any year during the observation period. In addition, we exclude very small firms with less than 5 employees in at least one year and never more than 10 employees. The innovative status of an SME is determined by its product and process innovation activities. An innovative SME is one that conducted activities within a three-year period that were intended to generate or introduce product or process innovation, regardless of whether a product innovation has actually been introduced to the market or a process innovation has been implemented in the firm or whether these activities have been stopped or were still ongoing at the end of the three-year period.
4
A large-scale non-response survey is conducted every year to control for a likely response bias with respect to R&D activity and the introduction of product and process innovation.
15
4.3 Key Variables
The three key model variables—public funding for innovation, product and process
innovation output, and export share—are taken directly from the survey. Public funding of innovation refers to any financial support provided by governments to innovation activities in firms (including R&D). Firms were asked whether they received financial support for R&D or innovation projects during the previous three-year period for four types of funding sources: regional (State Governments), national bottom-up programs (Federal Ministry of
Economics), national technology programs (Federal Ministry of Research), and EU
programs. Since this information is usually collected every second year in the MIP, public funding data had to be annualized. Product innovation output refers to sales from new or significantly improved products (goods as well as services) that have been introduced in the market in the previous three-year period. Following the empirical literature on product innovation output (see Laursen and Salter, 2006; Leiponen and Helfat, 2010; Mairesse and Mohnen, 2002; Klingebiel and Rammer, 2014), we distinguish the degree of novelty by separating between new-to-the-market innovations and other product innovation (i.e., the firm has adopted an innovation already put to the market by another firm before). Product innovation sales are adjusted for firm size by using a firm’s total sales as the denominator. Process innovation output is measured by the average share of unit cost reduction in year t
resulting from process innovations that have been introduced in the previous three-year period. This measure is proposed in the Oslo Manual (OECD and Eurostat, 2005) but has been implemented only in a few innovation surveys yet. The export share is calculated by dividing export sales (measured in euros and including all sales to customers located outside Germany) by a firm’s total sales.
Most of the explanatory model variables are taken directly from the innovation survey relying on standard measures from the CIS, including in-house R&D activity, and the share of
graduated employees. The stock of patents is taken from the Patstat database of the European Patent Office (EPO), which has been merged with the MIP based on a name search. The stock of patents measures the number of patents that have been applied at the EPO or at the World Intellectual Property Organization through the International Patent Cooperation procedure, using the perpetual inventory method and a depreciation rate of 0.15. A firm’s solvency refers to the solvency index of Germany’s largest credit rating agency,
16
we use six variables to control for firm heterogeneity that may affect export performance. Relative productivity is measured by the relation of s firm’s gross value added per FTE employee to the respective value in the firm’s three-digit industry. The material share gives the share of purchased inputs in total output and is a proxy for likely price advantages from souring cheap inputs. Capital intensity is the book value of tangible assets per FTE
employee. Unit labor costs indicate the relation between a labor costs and labor productivity per unit of output. All data needed for calculating these variables are available from the MIP survey. The trademark stock is used to measure export advantages from branding and firm reputation and is calculated in the same way as the patent stock, using trademark application data from the Office for the Harmonization in the Internal Market (OHIM, now the European Union Intellectual Property Office). In addition, we include dummy variables if an SME is part of an international enterprise group. We also add dummies if an SME is located in a district bordering to another country or if an SME’s district has no direct international border, but borders to a bordering region. In both cases we expect trade-enhancing effects from the geographical proximity to customers abroad. For both the public funding and the export model, sector dummies are defined at the 2-digit level using Nace rev. 2. Since sector information for Nace rev. 2 is only available from 2006 onwards, sector dummies for earlier years have been generated using a correspondence table that links Nace rev. 2 with the predecessor classification (Nace rev. 1.1).
A description of all model variables along with descriptive statistics is provided in Table A1 in the Appendix. The total number of observations we can use for our models varies between about 46,000 for the public funding models if pooled over the 15-year time period, and 13,300 for the export model when using a two-year time lag between innovation output and export performance.
5. Empirical Results and Discussion
5.1 Determinants of Receiving Public Funding
The first step of our analytical procedure is to determine the propensity score of funded firms and firms without public funding for identifying control firms for each funded firm. For this purpose, we estimated the public funding model (3) for each of the four types k of funding programs and for each year t separately in order to obtain year-specific treatment effects and
17
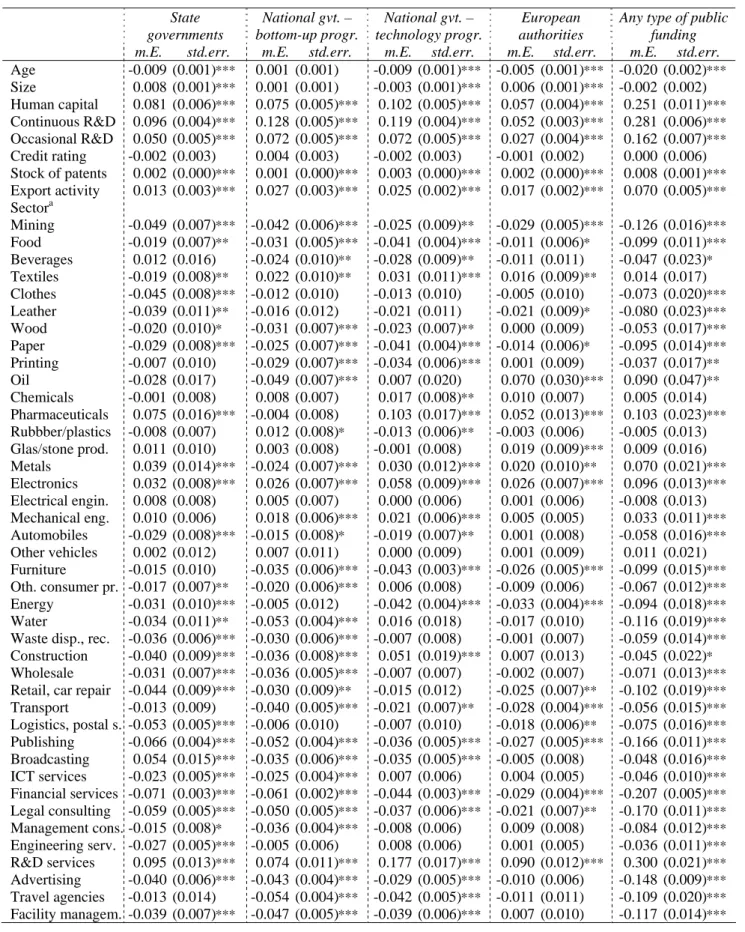
counterfactual innovation outputs for each funding program. For presentation purposes we also estimated model (3) for the sample pooled overall years and calculated average treatment effects on treated based on the pooled model. In addition, we also estimated the public funding model for all types of public funding, which serves as a reference for the type-specific results. The results of this reference model (see last columns of Table A2 in the Appendix) show that across the entire period of 2001 to 2014, young innovative SMEs in Germany were more likely to receive public funding while size (within the group of SMEs) had no significant impact. Human capital, R&D activities and the patent stock are all highly significant and positive. A firm’s credit rating does not affect the probability of receiving public funding. Importantly, we also see a positive impact of prior export activities. Innovative SMEs with export activities have a 7-percentage points higher probability to receive public funding from any of the funding sources considered in this study. In addition, we find significant sector effects with particularly high funding probabilities for SMEs belonging to the pharmaceuticals, metals, electronics, mechanical engineering and R&D services sectors. SMEs located in one of the ‘New Länder’ (e.g., the States that belonged to the GDR prior to 1990) are much more likely to receive public funding than SMEs located in Western Germany. The year dummies show significantly lower funding probabilities for the years 2003 to 2008 as compared to 2014, indicating increased government activity to fund innovation in SMEs.
However, determinants are not homogenous across different funding programs. Regional programs show a less strong (though still significantly positive) effect of prior export activity while size increases an SME’s propensity to receive funding. National bottom-up funding does not favor younger SMEs, which is in contrast to all other programs. The stock of patents also has a positive impact, but at a smaller size than for other program types. National technology programs prefer smaller SMEs. The patent stock also exerts a stronger effect compared to other programs. EU programs tend to prefer larger SMEs and show no clear preference for funding SMEs from Eastern Germany, which clearly separates this program from the regional and national ones.
5.2 The Effects of Public Funding on Product and Process Innovation Output
The results for the average treatment effect on the treated (TT) shown in Table 3 have been derived from the pooled propensity score matching discussed in the previous chapter. The
18
effects on the three innovation output variables are shown for each of the four types of public funding and in addition also for any type of public funding (see Table 2). We consider innovation output effects in year t and in year t+1. As the information on public funding always refers to a three-year reference period, whereas innovation output refers to a single calendar year, the time structure between funding and resulting innovation outputs remains inconclusive. A firm reporting public funding in t may have received this funding in years t-2, t-1 and/or t. If funding took place only in t, one would hardly expect impacts on
innovation success in year t as funded innovation projects typically last two years, but rather in years t+1 or t+2. If funding has been received only in t-2, but not in t-1 and t, one could expect to find impacts on innovation output in t-1 and t. By looking at innovation output both in year t and t+1, we try to strike a balance between the different time structures of the two variables, though the time link remains imperfect.
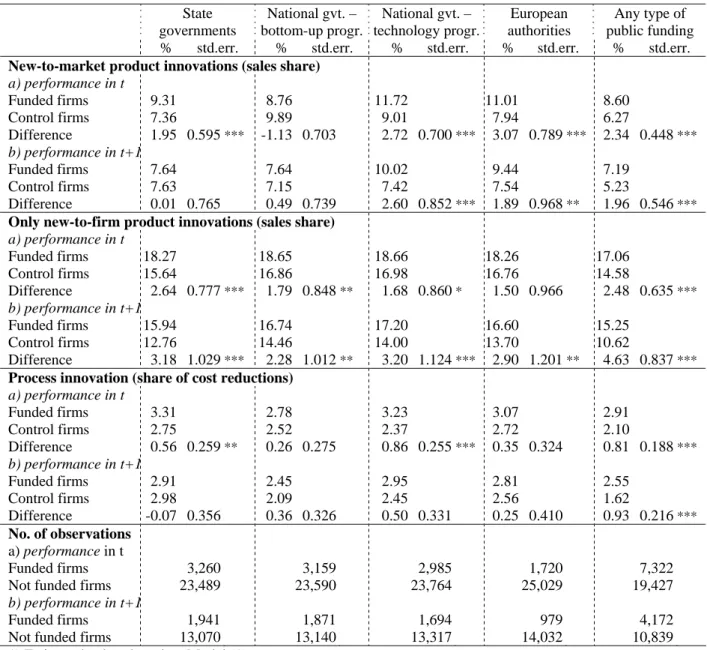
As a result, we find a highly significant positive effect of public funding on the sales share with new-to-market product innovations for all types of public funding except national
bottom-up programs when looking at effects in year t. For a one-year lag, significant positive effects disappear for regional funding but are still present for national technology programs and European funding. SMEs that have received any type of public funding for innovation yield 2.3 percentage points higher sales share with new-to-market innovations (2.0
percentage points in the following year) than non-funded SMEs. Given that the average share of sales with new-to-market innovations is about 6 percent for non-funded firms, the size of the funding impact is substantial. For national technology programs, these effects are 2.7 percentage points (year t) and 2.6 percentage points (year t+1). European funding
produces slightly higher impacts on new-to-market innovations for year t (3.1 percentage points), but smaller ones for t+1 (1.9 percentage points).
Public funding also increases the share of sales with only new-to-firm product innovations. Across all types of funding, these effects are 2.5 percentage points for year t and 4.6
percentage points for year t+1. Though these effects are higher than for new-to-market product innovations, the contribution of funding to innovation output with only new-to-firm innovations is relatively smaller, as the average sales share of non-funded firms is about 14.5 percent. Again, we find different effects for the four types of programs. The strongest impact is found for regional funding (+2.6 percentage points in year t, +3.2 percentage points
19
in year t+1) and for national bottom-up programs (+1.8 and +2.3 respectively). The effects for national technology programs in year t are only weakly significant, while we find no significant impacts for European funding. When looking at year t+1, both programs significantly contribute to higher sales shares with only new-to-firm innovations.
Table 2: Estimation results of matching models: The effect of funding programs on innovation output (average treatment effect on treated)
State governments National gvt. – bottom-up progr. National gvt. – technology progr. European authorities Any type of public funding % std.err. % std.err. % std.err. % std.err. % std.err. New-to-market product innovations (sales share)
a) performance in t Funded firms 9.31 8.76 11.72 11.01 8.60 Control firms 7.36 9.89 9.01 7.94 6.27 Difference 1.95 0.595 *** -1.13 0.703 2.72 0.700*** 3.07 0.789 *** 2.34 0.448*** b) performance in t+1 Funded firms 7.64 7.64 10.02 9.44 7.19 Control firms 7.63 7.15 7.42 7.54 5.23 Difference 0.01 0.765 0.49 0.739 2.60 0.852*** 1.89 0.968 ** 1.96 0.546***
Only new-to-firm product innovations (sales share) a) performance in t Funded firms 18.27 18.65 18.66 18.26 17.06 Control firms 15.64 16.86 16.98 16.76 14.58 Difference 2.64 0.777 *** 1.79 0.848** 1.68 0.860* 1.50 0.966 2.48 0.635*** b) performance in t+1 Funded firms 15.94 16.74 17.20 16.60 15.25 Control firms 12.76 14.46 14.00 13.70 10.62 Difference 3.18 1.029 *** 2.28 1.012** 3.20 1.124*** 2.90 1.201 ** 4.63 0.837***
Process innovation (share of cost reductions) a) performance in t Funded firms 3.31 2.78 3.23 3.07 2.91 Control firms 2.75 2.52 2.37 2.72 2.10 Difference 0.56 0.259 ** 0.26 0.275 0.86 0.255*** 0.35 0.324 0.81 0.188*** b) performance in t+1 Funded firms 2.91 2.45 2.95 2.81 2.55 Control firms 2.98 2.09 2.45 2.56 1.62 Difference -0.07 0.356 0.36 0.326 0.50 0.331 0.25 0.410 0.93 0.216*** No. of observations a) performance in t Funded firms 3,260 3,159 2,985 1,720 7,322
Not funded firms 23,489 23,590 23,764 25,029 19,427
b) performance in t+1
Funded firms 1,941 1,871 1,694 979 4,172
Not funded firms 13,070 13,140 13,317 14,032 10,839
1) Estimated values based on Model (1)
2) Results for “any type of funding” derived from separate model estimations. ***, **, * p > 0.99, 0.95, 0.90
There are also significant positive effects of public funding on cost reduction from process innovation when comparing funded SMEs (regardless of the type of funding) with non-funded ones both in year t and t+1. The average treatment effect on the treated is 0.8
20
percentage points in year t and 0.9 percentage points in year t+1, which are both substantial, given that the average cost reduction of non-funded SMEs is 2.1 percent. For the different types of funding programs, positive effects only appear for regional funding, national technology programs and European funding when looking at year t. We do not find
significant effects for any of the four types of funding for year t+1 which may be partly due to the smaller number of SMEs with positive cost reduction effects both among funded and non-funded firms combined with a high variation in the level of annual cost reduction. The positive impact of funding on cost reduction emphasizes the importance of considering process innovation as a separate output category when examining innovation impacts of public funding.
5.3 The Effects on Export Performance
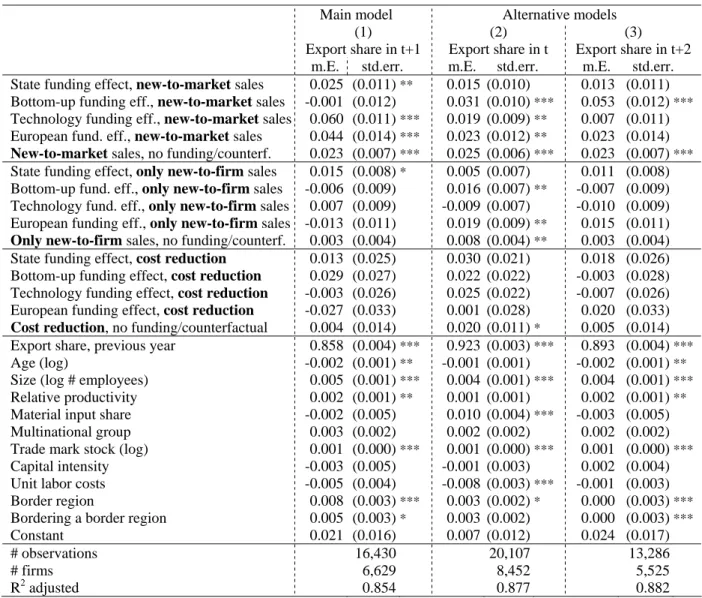
The results of the export model (5) show that a higher sales share of new-to-market
innovations has a positive impact on export performance of SMEs. At the same time, we find little effects for product innovations that are only new to the firm, and no impacts for cost reduction from process innovation (see Table 3). Taking the one-year lag model as our reference model, we find positive export impacts of new-to-market innovations for the firm’s counterfactual sales share as well as for the contribution of regional funding, national
technology programs and European funding. For the contribution of national bottom-up funding to new-to-market sales, we do not find a significant impact on exporting. This result implies that those types of funding sources that had a significant impact on a firm’s
innovation output with new-to-market product innovations also contributed to a higher export performance of the funded SMEs. For national bottom-up funding, the insignificant
contribution to sales with new-to-market innovations corresponds with no significant export impact of innovations triggered by this funding source.
These results partly differ, however, when no time lag between innovation output and export performance is considered (column 2 in Table 2). We still find positive impacts of national technology programs and European funding as well as from a firm’s own (not funded) contribution to sales with new-to-market innovations. But the positive effect of regional funding disappears while the contribution of national bottom-up funding to new-to-market innovations has a strong positive impact on export performance. When looking at a two year
21
lag between innovation output and exporting (column 3 in Table 4), the positive impacts of a firm’s own contribution to new-to-market sales remain, and we also find a positive impact for national bottom-up funding, but none for national technology programs and EU funding.
Table 3: Estimation results of model (5): The effects of innovation output and public funding on export performance (random effect panel GLS models)
Main model Alternative models (1) Export share in t+1 (2) Export share in t (3) Export share in t+2 m.E. std.err. m.E. std.err. m.E. std.err. State funding effect, new-to-market sales 0.025 (0.011)** 0.015 (0.010) 0.013 (0.011) Bottom-up funding eff., new-to-market sales -0.001 (0.012) 0.031 (0.010)*** 0.053 (0.012)***
Technology funding eff., new-to-market sales 0.060 (0.011)*** 0.019 (0.009)** 0.007 (0.011) European fund. eff., new-to-market sales 0.044 (0.014)*** 0.023 (0.012)** 0.023 (0.014) New-to-market sales, no funding/counterf. 0.023 (0.007)*** 0.025 (0.006)*** 0.023 (0.007)***
State funding effect, only new-to-firm sales 0.015 (0.008)* 0.005 (0.007) 0.011 (0.008) Bottom-up fund. eff., only new-to-firm sales -0.006 (0.009) 0.016 (0.007)** -0.007 (0.009) Technology fund. eff., only new-to-firm sales 0.007 (0.009) -0.009 (0.007) -0.010 (0.009) European funding eff., only new-to-firm sales -0.013 (0.011) 0.019 (0.009)** 0.015 (0.011) Only new-to-firm sales, no funding/counterf. 0.003 (0.004) 0.008 (0.004)** 0.003 (0.004) State funding effect, cost reduction 0.013 (0.025) 0.030 (0.021) 0.018 (0.026) Bottom-up funding effect, cost reduction 0.029 (0.027) 0.022 (0.022) -0.003 (0.028) Technology funding effect, cost reduction -0.003 (0.026) 0.025 (0.022) -0.007 (0.026) European funding effect, cost reduction -0.027 (0.033) 0.001 (0.028) 0.020 (0.033) Cost reduction, no funding/counterfactual 0.004 (0.014) 0.020 (0.011)* 0.005 (0.014) Export share, previous year 0.858 (0.004)*** 0.923 (0.003)*** 0.893 (0.004)***
Age (log) -0.002 (0.001)** -0.001 (0.001) -0.002 (0.001)**
Size (log # employees) 0.005 (0.001)*** 0.004 (0.001)*** 0.004 (0.001)***
Relative productivity 0.002 (0.001)** 0.001 (0.001) 0.002 (0.001)**
Material input share -0.002 (0.005) 0.010 (0.004)*** -0.003 (0.005) Multinational group 0.003 (0.002) 0.002 (0.002) 0.002 (0.002) Trade mark stock (log) 0.001 (0.000)*** 0.001 (0.000)*** 0.001 (0.000)***
Capital intensity -0.003 (0.005) -0.001 (0.003) 0.002 (0.004) Unit labor costs -0.005 (0.004) -0.008 (0.003)*** -0.001 (0.003) Border region 0.008 (0.003)*** 0.003 (0.002)* 0.000 (0.003)***
Bordering a border region 0.005 (0.003)* 0.003 (0.002) 0.000 (0.003)***
Constant 0.021 (0.016) 0.007 (0.012) 0.024 (0.017)
# observations 16,430 20,107 13,286
# firms 6,629 8,452 5,525
R2 adjusted 0.854 0.877 0.882
All models also include sector, State and year dummies. ***, **, * p > 0.99, 0.95, 0.90
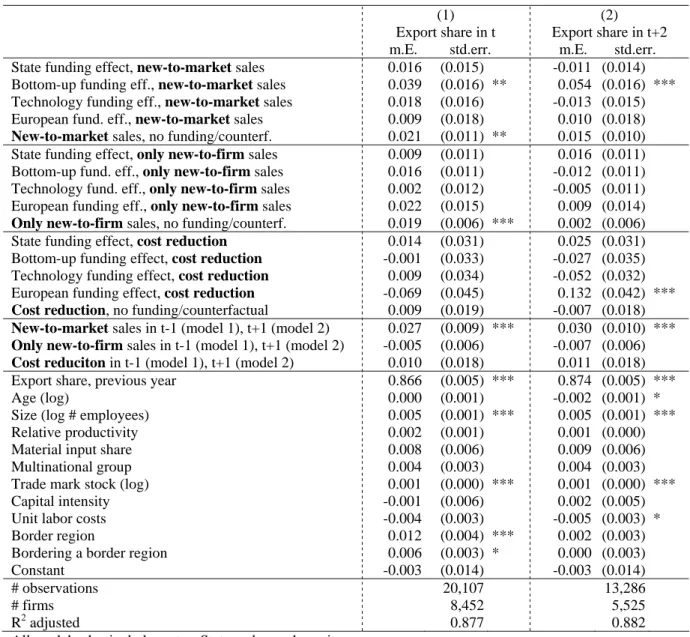
The divergent findings imply that the time structure between public funding, innovation output and export performance is crucial. We believe that our main model represents the most appropriate time structure. In the no-lag model and two-year lag models, export performance may be influenced by innovation outputs that occurred earlier or later than the estimated innovation output effects from public funding in year t. We hence run models that included innovation outputs in t-1 (for the no-lag model) and in t+1 (for the two-year lag
22
model) and found the positive impacts of national bottom-up funding still hold, though the lower number of observations for these model variants limit comparability (see Table A3 in the Appendix).
For sales with innovations that were only new to the innovating firm, positive impacts on export performance are only found in the no-lag model for national bottom-up funding and European funding, as well as for a firm’s own contribution to innovation output. These positive effects disappear however for the two funding sources if innovation output in the previous year is included (see Table A3 in the Appendix). For the main model with a one- year lag as well as for the two-year lag model, we do not find significant impacts of product innovations that are only new to the innovating firm on export performance. This result indicates that SMEs need ‘real’ innovations to generate an export advantage that can compensate for likely barriers to exporting, such as a lack of reputation in foreign markets and limited resources to market their innovations on international markets.
Cost reduction from process innovations seems to have no substantial impact on export success of German SMEs. This result is in line with a common feature of innovative SMEs in Germany to specialize on market niches and high-quality, innovative products rather than competing over product price (see Fryges, 2006, 2009).
6. Conclusions
This paper studies the effects of German public innovation funding programs on innovation outputs and export performance of SMEs, contributing to the growing body of work on the evaluation of public support programs. Unlike most of the literature, we examine the effectiveness of different types of funding programs at the regional, national and European levels on both product innovations (differentiating between market and only new-to-firm) and process innovations (focusing on cost reduction). By employing a matching approach that allows us to separate a firm’s innovation output into the contributions from different funding sources and from a firm’s own counterfactual contribution in the absence of funding, we find evidence that public financial support contributes to a higher innovation output from both product and process innovations of SMEs. But only funding that led to a higher sales share with new-to-market product innovations translates into higher export
23
success in later years. Funding programs supporting the generation of innovations that copy or adapt products of other firms, or that help SMEs to implement more cost-efficient
processes, do not contribute to higher export success.
The positive relation between a program’s support to new-to-market innovations and an SME’s export performance is particularly strong for national technology programs and European funding. These two program types also show the largest contribution to new-to-market innovation output. For regional funding, the positive contribution to an SME’s sales share with new-to-market innovations is less pronounced, though still positive, and so is the impact of new-to-market innovations triggered by regional funding on the SMEs export performance. National bottom-up funding has no significant impact on new-to-market product innovations in SMEs that received funding from this source. But we do find positive impacts on export performance, though not from our main model but from model variants relying on no time lag between innovation output and exporting, or on a two-year lag. Several important implications have emerged for policy and research. The first implication stems from the evidence of the positive effects of public funding on innovation outputs, and in turn on exporting of SMEs. This result provides empirical support to the literature that emphasizes the importance of public innovation investment for SMEs’ long-term growth (Hottenrott and Lopes Bento, 2014; Doh and Kim, 2014). Furthermore, this paper responds to the call to address different aspects when evaluating the effectiveness of public policies better (Falk, 2007; Martin and Scott, 2000). In doing so, we robustly observe different types of funding programs on different innovations. Our study advances prior research by
revealing, with evidence, that the positive effects on innovation outputs and exporting are not held in all types of support funding.
The effect of public investment on marketable innovation may also need to be considered by funding bodies. In the case of the national bottom-up funding in Germany, the program is not fully utilizing its potential to provide SMEs a competitive advantage for international market expansion. While those SMEs that were able to develop new-to-market innovations from projects funded by bottom-up programs could gain higher export sales, the program does not increase the SMEs output of this type of innovation significantly. The program’s main impact is rather on less novel product innovations, which do not help SMEs in entering or penetrating international markets. This result can be attributed to the program design, which
24
offers financial support without intervening into the innovation decisions of SMEs. It turns out that many SMEs tend to choose less ambitious —and less exportable— innovations (“only new-to-firm”) for being co-funded through this program, perhaps because this type of innovation is rather easy to realize and is associated with little uncertainty. In this sense, governments may need to play a better role as entrepreneurs (as suggested by Link and Scott, 2010) in urging firms (SMEs in particular) to have a vision aiming better and higher. It would be interesting to see if other technology neutral programs such as R&D tax incentives yield similar results in terms of export performance.
The results that national technology (i.e., cutting-edge novelty) funding significantly impacts on new-to-market product and cost-reduction process innovations and on export performance augments the innovation and internationalization literature (Love and Roper, 2015; Brambilla et al., 2012; Golovko and Valentini, 2011). Our study conveys an important message to policy makers, highlighting the importance of public support on cutting-edge innovations when considering internationalization strategy of firms, and SMEs in particular. Finally, the financial support from the EU funding is important. While the positive effect of EU funding on product innovation output is similar to the effect found for national technology funding, we do find more consistent and longer lasting effects on SMEs’ export performance. This study is not without limitations. First, the lack of information about the size of funding may underestimate or overestimate some findings. For example, small volumes of the funding size may cause the ineffectiveness of regional funding, while the strong effect of national technology funding may be affected by large public investment. The consideration of public investment size leads to an area for further research. Furthermore, while we empirically advance the prior public support studies, the association between public support, innovation output and exporting still is a black box in many aspects and urgently needs further research. Finally, this study cannot provide data on SMEs that applied to funding programs and were rejected.
25
References
Acs, Z.J. & D.B. Audretsch (1988), Innovation in large and small firms: an empirical analysis, American Economic Review 78(4), 678–690.
Acs, Z.J. & D.B. Audretsch (1990), Innovation and Small Firms, The MIT Press, Cambridge, Ma.
Aerts, K. & D. Czarnitzki (2006), The Impact of Public R&D-funding in Flanders, IWT, Brussels.
Aerts, K. & T. Schmidt (2008), Two for the price of one? Additionality effects of R&D subsidies: a comparison between Flanders and Germany, Research Policy 37(5), 806– 822.
Almus, M. & D. Czarnitzki (2003), The effects of public R&D subsidies on firms’ innovation activities: the case of Eastern Germany, Journal of Business and Economic Statistics
21(2), 226–236.
Ansoff, H.I. (1965), Corporate Strategy: An Analytic Approach to Business Policy for Growth and Expansion, McGraw-Hill, New York.
Arnold, J.M. & K. Hussinger (2010), Exports versus FDI in German manufacturing: firm performance and participation in international markets, Review of International Economics 18(4), 595–606.
Arrow, K. (1962), Economic welfare and the allocation of resources for invention, in NBER (ed.), The Rate and Direction of Inventive Activity: Economic and Social Factors, Princeton University Press, Princeton, 609–626.
Aschhoff, B. (2010), Who gets the money? The dynamics of R&D project subsidies in Germany, Journal of Economics and Statistics 230(5), 522–546.
Audretsch, D.B. (2002), The dynamic role of small firms: evidence from the U.S., Small Business Economics 18, 13–40.
Audretsch, D.B, B. Bozeman, K.L. Combs, M. Feldman, A.N. Link, D.S. Siegel, P. Stephan, G. Tassey & C. Wessner (2002), The economics of science and technology, The Journal of Technology Transfer 27(2), 155–203.
Ayyagari, M., T. Beck & A. Demirguc-Kunt (2003), Small and Medium Enterprises Across the Globe: A New Database, World Bank Policy Research Working Paper No. 3127. Bartlett, C. & S. Ghoshal (1990), Managing innovation in the transnational corporation, in C.
Bartlett et al. (eds.), Managing the Global Firm, Routledge, London, 215–255.
Beise, M. (2001), LeadMarkets, Country-Specific Success Factors of the Global Diffusion of Innovations, ZEW Economic Studies 14, Physica, Heidelberg/New York
26
Beise, M. (2004), Lead markets: country-specific drivers of the global diffusion of innovations, Research Policy 33(6-7), 997–1018.
Beise-Zee, R. & C. Rammer (2006), Local user-producer interaction in innovation and export performance of firms, Small Business Economics 27(2-3), 207–222.
Bennettt, R. (2008), SME policy support in Britain since the 1990s: what have we learnt?
Environment and planning C: Government & Policy 26(2), 375–297.
Bérubé, C. & P. Mohnen (2009), Are firms that receive R&D subsidies more innovative?
Canadian Journal of Economics 42(1), 206–225.
BIS (2011), International Trade and Investment – the Economic Rational for Government Support, BIS Economics Paper No 13, London: Department for Business, Innovation and Skills.
BMBF (2016), Bundesbericht Forschung und Innovation [Federal Report on Research and Innovation], Berlin: Federal Ministry of Education and Research.
Brambilla, I., R. Dix-Carneiro, D. Lederman & F. Porto (2012), Skills, exports, and the wages of seven million Latin American workers, World Bank Economic Review 26(1), 34–60.
Bronzini, R. & P. Piselli (2016), The impact of R&D subsidies on firm innovation, Research Policy 45(2), 442–457.
Buisseret, T., H. Cameron & L. Georghiou (1995), What difference does it make? Additionality in the public support of R&D in large firms, International Journal of Technology Management 10(4-6) 587–600.
Cassiman, B., E. Golovko & E. Martínez-Ros (2010), Innovation, exports and productivity,
International Journal of Industrial Organization 28, 372–376.
Cassiman, B. & E. Golovko (2011), Innovation and internationalization through exports,
Journal of International Business Studies 42, 56–75.
Czarnitzki, D. & J. Delanote (2015), R&D policies for young SMEs: input and output effects,
Small Business Economics 45(3), 465–485.
Czarnitzki, D. & K. Hussinger (2004), The Link Between R&D Subsidies, R&D Spending and Technological Performance, ZEW Discussion Paper 04-56, Mannheim.
Czarnitzki, D. & C. Lopes Bento (2012), Evaluation of public R&D policies: a cross-country comparison, World Review of Science, Technology and Sustainable Development 9(2-4), 254–282.
Czarnitzki, D. & C. Lopes Bento (2013), Value for money? New microeconometric evidence on public R&D grants in Flanders, Research Policy 42(1), 76–89.