EDITED BY DUNCAN MACLENNAN & SHARON CHISHOLM
NEW TIMES,
NEW BUSINESSES
ADDRESSING THE CHALLENGES
OF HOUSING PROVISION IN
TIMES OF AUSTERITY
ED IT ED B Y D U N C AN M A C L E N NAN & S H A R ON C HI S HOL MN
E
W
T
IME
S
,
N
E
W
B
U
SI
N
ES
S
ES
CONTRIBUTORS: DEREK BALLANTYNE SHARON CHISHOLM MICHAEL LENNON CHARLES LOVATT DUNCAN MACLENNAN TONY McLAUGHLIN TONY O’SULLIVAN BEVERLEY SEARLENEW TIMES, NEW BUSINESS
Housing Provision in Times of Austerity
DUNCAN MACLENNAN AND SHARON CHISHOLM (eds)
University of St Andrews
2013
Foreword
THE CHALLENGES AND OPPORTUNITIES OF THE AUSTERITY ERA The New Times, New Business project was launched in June, 2011 and led by the Centre for Housing Research (CHR) at the University of St Andrews. CHR worked with six partners that are all involved in providing or
facilitating the provision of good housing outcomes for lower income groups. The partners included Glasgow Housing Association, Places for People, The Housing Services Corporation of Ontario, Ottawa Community Housing Corporation, Housing Choices Australia and The Norwegian State Housing Bank. PowerHousing Australia was also involved in the early stages of the project.
The partner organisations, largely operating in what is historically described as the non-profit sector, were already using new ways to finance desperately needed housing in the face of government cuts to capital grants and welfare supports as well as difficult financial markets. We were seeking new ideas and innovations and eager to learn from each other and to fashion a constructive conversation.
One of the biggest questions we discussed was ‘what kind of businesses can we become to not only survive but thrive in the tough times that are likely to prevail until the end of this decade?’ Practitioners and academics both saw the need for new models to continue the important work of providing affordable, decent homes for low income households and in supporting better, more inclusive communities. We also recognised that these new times bring not just acute fiscal pressures for governments but also the occurrence of long anticipated demographic and environmental pressures which are characterised by extensive market failures in housing service provision. Dealing with these key policy issues creates new
potential roles for effective organisations with long time horizons and patient capital.
Organisations with core objectives that saw effort and entrepreneurship primarily aimed at the wellbeing of individuals and communities have key roles to play not just in delivering redistribution but in shaping better functioning housing systems. As providers and academics we reached the view that housing policymakers have failed to recognise this key issue of better system functioning and continue to see ‘non-profits’ simply as subsidised deliverers of ‘non-market’ housing. We wanted to address a bigger and bolder question of how in an era of austerity shaped and prolonged by market failures, namely ‘how both to ensure the
sustainability of our affordability and community roles in the times ahead but to extend , where possible, the activities that could improve market functioning and potentially earn surpluses to cross-subsidise other activities.
Our partners were already alert to, and indeed involved with these new opportunities. In addition to new financing techniques, new
organisational structures, new business lines and new revenue streams were already underway. For some this involved using their existing
development expertise to build ‘for-profit’ rental housing to generate new funds and improve the integration of ‘social’ housing within mixed
communities. Others were seeking ways to provide services to their tenants that went beyond provision of shelter and that could also provide a new revenue stream. Discussions on how to loosen the regulatory framework were balanced with lessons on how to retain the most important aspects and philosophical underpinnings of our businesses. New times and new opportunities need us to fashion new businesses, not just in their scope but in their style.
In our desire to stretch limited resources, we wanted to better
understand how housing investments supported desirable outcomes, in areas such as health, educational achievement, and job readiness, not only for our tenants, but also for the places in which we invest. How would neighbourhoods have been different without ‘social’ housing? The project gave us an opportunity to review the evidence that existed in this area and get an idea of the kind of indicators that were most important to measure in the future.
At our June colloquium, the research papers were reviewed by all partners during a week of meetings held in St Andrews. Papers were revised, enriched and grounded in practice. The experience gave rise to a valuable discourse within our organisations and for non-profit housing providers generally. We were all facing similar issues and constraints despite the fact that governments in some countries were more engaged in housing than others. This relatively longer term collaboration by academics and practitioners helped all partners to understand the context of the changing environment and the opportunities it presented. We are not at the end of this tumultuous period, rather we are just beginning. The choices we make and the actions we take will spell out the future for neighbourhoods and places. Not only do we need new business lines and better outcomes, we need to change the very way we undertake our businesses. New methods of governance, financial management and business practices are required.
We believe that there is merit in sharing some of the general discussions and conclusions from this project. In the volume that follows the
successive chapters set out the Changing Contextfor providers in the case study countries, the Changing Financingof non-profit housing provision, Evolving Management and Governance, Capturing Wider Impactsand, finally, a statement of Findings, Conclusions and Implications. We hope that the New Times, New Businesses project will continue to stimulate debate on fundamental questions for housing policy debate, not least how to evolve traditional social housing and non-profit organisations into forms that serve key system roles in a resilient fashion and be a firm step towards modernising our businesses and making them fit for the 21st
century.
2013 marks the 600thAnniversary of the University of St Andrews and
that speaks to the longevity of non-profits that are adaptive and knowledge seeking, as the university is a non-profit institution.. I am grateful to the university for their support in undertaking this major knowledge co-production project and their aim of contributing to better outcomes for less affluent citizens in Scotland and abroad. I am also grateful to the innovative leaders that supported this project, namely David Cowans (Places for People), Lindsey Reed (Social Housing Services Corporation), Jo-Anne Poirier (Ottawa Community Housing Corporation) Martin Armstrong (Glasgow Housing Association), Baard Oistensen, (The Norwegian State Housing Bank). The cooperation and support that their colleagues provided was invaluable and I thank them all for their time and interest.
I would like to record a particular thanks to Tony McLaughlin from GHA, who was seconded to work with the St Andrews team, and to Judy Sutherland (Housing Choices Australia), Alister Steele (Places for People) and Susan Rath-Wilson (Ottawa Community Housing Corporation) who were the key interfaces with their organisations. At St Andrews, Sharon Chisholm skilfully managed the interactions and the visiting research associates; Derek Ballantyne and Michael Lennon complemented our own team of Beverley Searle, Charles Lovatt and Tony O’Sullivan. Galina Laurie (New South Wales) and Fanchea Kelly (GHA) participated in the St
Andrews Colloquium and their insights and advice helped us.
I have been involved in collaborative international research for much of my career, often for organisations such as OECD and the World Bank. This project was quite different as it involved co-production with direct, major providers of homes and neighbourhoods. New technologies helped but it was the drive to learn and innovate within these organisations, perhaps
now outpacing such capacities within governments that drove this project forward. I am grateful for all those involved for teaching me so much.
Professor Duncan Maclennan CBE FRSE AcSS Director, Centre for Housing Research, University of St Andrews
CONTRIBUTING AUTHORS
Derek Ballantyneis currently the principal in DKGI Inc., a real estate consultancy that assists in development projects including non-profit housing, housing policy and business development. Derek has consulted nationally and internationally, was formerly the CEO of the Toronto Community Housing Corporation, and has participated in advisory panels on housing program design and reform in Canada.
Sharon Chisholmmanaged the NTNB project and was Knowledge
Exchange Specialist at the Centre for Housing Research. She is interested in the interface between academia and housing stakeholders and is currently researching, for the Province of Nova Scotia, models for assisted housing with a focus on shared equity.
Michael Lennonhas played major roles in developing new housing organisations in Scotland (GHA), New Zealand (NZHC) and Australia (HCA). He is currently General Manager, Housing and Property Services of the ACH Group (Adelaide) and advises the Federal Government of
Australia on housing strategy and policy matters.
Charles Lovattis Fellow in Entrepreneurship at the School of Management at the University of St Andrews. He was a Research Associate on the NTNB project contributing expertise on the management of change and on issues of governance & strategic resilience.He is currently a Trustee of the National Library of Scotland.
Duncan Maclennan CBE is a Fellow of the Royal Society of Edinburgh, Head of the School of Geography and Geosciences and Director of the Centre of Housing Research at the University of St Andrews. He is an urban economist who researches the economics of cities,
neighbourhoods and housing. He currently advises the Prime Minister’s Department in Australia on the future planning of Australian cities. Tony McLaughlinworks as a Policy and Research Officer in Glasgow Housing Association’s Strategic Planning and Research Team. Tony was seconded to the NTNB project on a part time basis. His current areas of research are the diversification of social landlord activities, sustainability and housing, equality and diversity in housing management and general urban and housing policy.
Tony O’Sullivanis a Director of Newhaven Research Limited and an Honorary Professor in the School of Social and Political Sciences at the University of Glasgow. Tony has been a housing economist for 30 years.
His main research interests are housing market analysis and the economic analysis of housing policy.
Beverley Searleis a Senior Research Fellow at the Centre for Housing Research at the University of St Andrews, focusing on trends in subjective wellbeing and social welfare, in relation to housing wealth and
intergenerational transfers. This ranges from micro concerns of the social and economic consequences of recession on household relationships to wider concerns about housing systems and tenure flows.
NEW TIMES, NEW BUSINESS
TABLE OF CONTENTS
Page
1. Changing Times, Changing Context. Beverley Searle 10 and Duncan Maclennan
2. New Times, New Routes for Funding Non-Profit Providers. 53 Duncan Maclennan, Michael Lennon and Derek Ballantyne 3. Facing up to the Future: Management and Governance 90
Challenges.Tony McLaughlin and Charles Lovatt
4 Developing Wider Roles and Wider Outcomes.Tony 111 O’Sullivan
5. Summary of Findings, Conclusions and Implications. 142 Duncan Maclennan, Sharon Chisholm, Michael Lennon
and Tony McLaughlin
CHAPTER 1
CHANGING TIMES, CHANGING CONTEXT
Beverley Searle and Duncan Maclennan I. CHANGE: CYCLE AND TREND, NATION AND REGION. The Great Financial Crash (GFC) of 2008 occurred just as economic experts and institutions across the advanced economies had begun to understand the ways in which housing sector outcomes, especially prices, had reinforced the long boom (Smith and Searle, 2010; Maclennan and Priemus, 2011). In the two or three years after the GFC the fiscal stimulus programmes of governments, in most countries, boosted housing
investment to forestall reductions in national income and employment. Since 2011, as governments have moved to reduce annual deficits and long term debt to GDP ratios, support for housing investment
programmes has waned, arguably when they have become most needed both in relation to meeting rising low income housing needs and boosting economic performance.
At the end of 2012 all of the countries examined in this report, Australia, Canada, Norway and the UK, have downgraded economic growth
forecasts and extended the periods over which they expect to meet their debt reduction targets. The great housing and economic cycle of the last ten years has now left governments cutting, trimming or scrutinising their housing policy expenditure programmes. In consequence, non-profit housing providers are facing a new context that is not only placing new demands upon them to meet growing needs and address expanded market failures but is also reducing their access to public finance and subsidy in a context of wider and deeper credit market rationing.
Change is not just cyclical. Organisations also function amidst long term change processes. The particular complexities of the difficult global context for housing are not just the recession-induced housing investment cutbacks but their synchronicity with the increasingly apparent negative effects of longer-term demographic and
environmental trends. There is a growing recognition that population ageing and growing greenhouse gas production have to be tackled now. These last few years and the rest of the decade ahead are not best seen as a typical, trade-led cyclical blip and shallow recession that will soon pass with policy roles and public resources reverting to ‘normal’ within a few years of the economic trough. They are better seen as new times, when, for some nations, unprecedented austerity in fiscal support for
housing will be the backdrop for coping with rapidly ageing populations and more pressing environmental effects of everyday life. These are new times for the rest of this decade and perhaps beyond.
This introductory chapter brings together data that describes the changing context for non-market and not-for-profit housing providers in the case study countries. In particular, it focuses not only upon housing low income households but also highlights the sectors and areas in which the ‘new’ policy pressures, and indeed market failures and opportunities will arise. When international collaborative work is undertaken it is often apparent that quite disparate national contexts, shaped by different histories of economics, politics and policies can display quite similar trends in the key factors that drive housing demands and needs. The capacity of different housing systems to cope with these changes then becomes an important question. This chapter does not explain historical differences in the emergence of context but, instead, considers how new contexts emerging in the different nations have important
commonalities. The focus is primarily on the period post 2000.
Much housing policy research focuses on national level studies. However with new sub-national autonomies in housing policies emerging over the last two decades (Maclennan and O’Sullivan, 2013) in all the countries collaborating in this project, organisations increasingly have to deal with regional and local contexts and differences. Most of the organisations in this study are multi-locational; they operate not just across different municipalities but, in some instances, across different ‘state-provincial’ jurisdictions too. We have noted these differences where they are relevant to the arguments produced here.
This chapter has national contexts that relate to: Australia, Canada, Norway and the UK. Within these nations the particular focus is on organisations based in Scotland and England (the UK), Ontario (Canada), Victoria (Australia) and for Norway as a whole. Changes are considered within four broad themes; Drivers, Outcomes, Policy and Implications. These headings are not mutually exclusive and there may be overlaps between themes but they serve as a means of identifying key data and grouping information in a manageable form.
II. MAIN DRIVERS OF CHANGE
The evolution of housing demands and needs within any housing system is largely driven by population and economic change. Demographic change clearly drives household numbers and the structure of
households. The age structure of the population also has salience for housing pressures and policies. Economic changes that matter include the growth in household incomes, interest rates and other cost changes that interact with income changes. Together these changes shape new and evolving patterns both of demands for and ability to pay for
adequate housing. Population change and economic development are closely and recursively related. Clearly, population growth reinforces economic growth, and economic growth may reinforce population expansion, not least through migration effects. Here, as a simplification we treat them separately, describing how key demographic and
economic influences on housing outcomes have unfolded in recent decades. The implications, or outcomes, of these changes for housing systems are discussed in the next section.
II.I New Demographics
The changing contexts in which housing market systems are operating are underpinned by new demographics (Statscan, 2010; Australia Productivity Commission, 2005; Statistics Norway, 2012). Not only are national populations growing, even if most countries contain places of decline, but the changing structure of households and their age structures present new challenges to housing services providers.
Recent Population Growth and Projections
Canadian population growth patterns are a good indication of the pressures emerging. Over the last five years, between 2006 and 2011, Canada(current population 33.5 m) had the fastest population growth rate in the G8 economies at 5.9pc (exceeding the previous quinquennial increase of 5.4pc between 2001 and 2006). Canada’s growth, like Australia’s, is fuelled primarily by immigration and demonstrates sharp interregional differences. For example, Alberta’s five year growth of 10.8pc contrasts with near static populations in the Atlantic Provinces such as Nova Scotia (with a 0.3pc gain).Immigration, ageing and regional and metropolitan imbalances in growth characterise population change, not just in Canada but the other countries too and they all reshape housing demand patterns.
In Australia, Queensland and Western Australia (with population increases of, respectively, 26pc and 22pc between 2000 and 2010) have grown faster than New South Wales and Victoria whilst Tasmania and South Australia (with growth rates, respectively, of 7pc and 8pc) have lagged behind national rates.
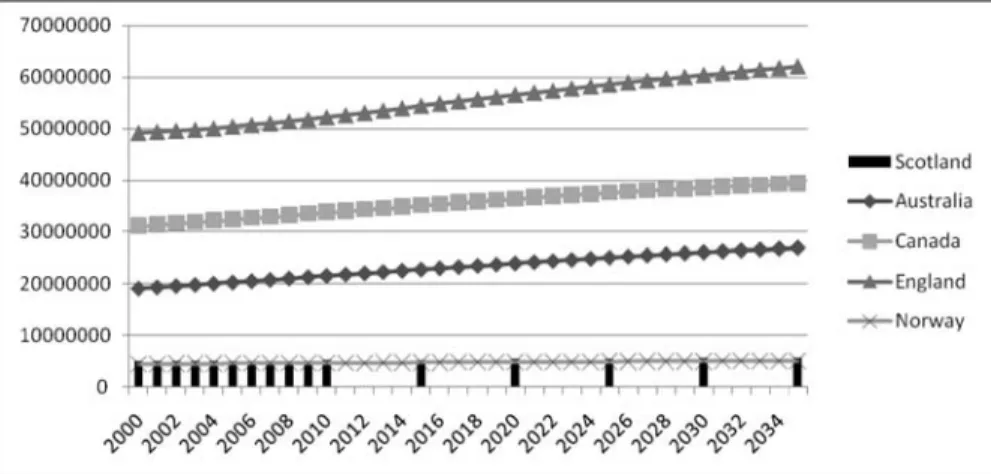
Figure 1: Population growth 2000-2035
Source: US Census Bureau; Office for National Statistics, UK; General Registrar of Scotland
Canada and Australia both contain ‘regions’ that face quite different population growth pressures and economic prospects. Similar patterns prevail within the UK, with London and the South East of England outstripping growth elsewhere. The North of England and the devolved administrations of Scotland and Wales conversely face, by international standards, quite modest population growth rates. In Norway the rural north faces population decline whilst the Oslo region has grown
significantly since 2000.Looking across the countries as a whole since the start of the millennium, the populations of all 5 nations have grown between 2000 and 2010 (Australia by 11pc; Canada by 8pc; England by 6pc; Norway by 4pc and Scotland by 3pc). The official predictions in all these countries are that this growth pattern will continue (Figure 1, above). Although annual growth rates vary across the nations, there is a common trend in that the rate of growth will gradually slow down by 2035 (for example from 1.2pc to 0.6pc in Australia and 0.3pc to 0.1pc in Norway).It is useful to consider how the key features of these population changes impact housing investment and management challenges.
Spatial Differences
Within all of the nations included in the project there have been some similarities in the quite complex geographies of population change. Lying below the national and regional change patterns noted above there have been quite sharp differences emerging at metropolitan and
national and ‘regional’ components local change patterns are critical in housing because housing systems have significant, grounded, local dimensions. Risks and returns for housing investors reflect local factors as well as national considerations (such as interest rates). The New
Businesses in housing are facing not just national and regional policy changes but they also have to plan, invest and manage within
increasingly different local contexts. As government cushions of subsidy deflate and providers become more concerned about asset values and stability of income streams then understanding local contexts is becoming more important to providers.
Major Settlement Shifts in Canada
Between2006-2011 the number of people living in census metropolitan areas continued to grow at a rate surpassing the national average. Between 2006 and 2011, census metropolitan areas grew at a rate of 7.4pc, above the national average of 5.9pc. Even in regions or provinces with low growth rates there were Census Metropolitan Areas (CMAs) with significant growth, for instance amidst overall population stasis Halifax in Nova Scotia ex-panded by 4.5pc and Moncton in New Brunswick by 6.5pc.
Cities, and their associated metropolitan regions, differ significantly in growth prospects and pressures (Harcourt, 20 06). CMAs are defined by Sta-tistics Canada as areas larger than 100,000 people with an urban core of at least 50,000. Such areas now house 70pc of the Canadian population. The 15 fastest growing census metropolitan areas had expansion rates in excess of 5.5pc between2006-2011, so that there are significant areas of sustained housing demand pressure in a wide range of localities. These were largely in western Canada and in the metropolitan ring surrounding Toronto. The Greater Toronto Area grew by 5.1pc between 2006 and 2011, setting its population at almost 5.6 million. This increase reflected more modest growth within the core city of Toronto itself but much higher expansion rates, close to 20pc, in the associated new growth centres of the polycentric metropolitan region (in places such as Brampton, Mississauga, Markham, Oakville, Pickering, and Vaughan.
The paragraphs above emphasise growth. However the pattern of spatial change within regions, even cities, is seldom uniform and balanced. Decline coexists with growth at all spatial scales. Suburbanisation and sprawl of major cores have usually meant that city growth masks the decline of old, declining opportunities in some edge towns. Some older industrial and mineral extraction sites may also manifest population decline within quite prosperous regions. A housing provider operating across the Toronto metro area may now be primarily challenged by growth but with significant contraction in older industrial bases. Some detached cities and towns may confront stasis and decline.
Cities and metropolitan areas are facing most of the housing growth pressures in all of the countries studied. Recent statements from the Australian Treasury indicate that not only are the major capital cities of Australian States growing more rapidly than had been expected over the last decade but that growth to 2030 is expected to be almost entirely within the existing metropolitan regions. State capital cities, in particular, constitute the most likely locus of expansion. The geography of drought in Australia and cold in Canada means that the space for national population expansion represents a small proportion of national territory. The key housing challenges facing providers will be set, mainly, within the management of metropolitan growth.
Patterns similar to the broad Canadian experience are apparent in the regions and metropolitan areas of the other countries. In the State of Victoria, for example, whilst Melbourne grows at rates well above past expectations some second order cities, such as Geelong, struggle to sustain population and economic bases. In the UK there are sharp differences between major metropolitan areas that have implications for organisations operating region-wide (or nationally). In some localities, for instance London, they will confront growth challenges and robust
property values. In others, such as Glasgow, regeneration and renewal will be the challenge and there will be less likelihood of demand induced uplifts in the value of the asset base of organisations. As governments reduce support, unless residual support is spatially re-targeted, the new times will mean that places of growth will be more manageable for non-profits than places of decline. Performance and risks are diversifying and that has strategic implications both for governments and for
organisational choices.
This urban emphasis in population and associated housing growth should not be used as a basis to dismiss the quite significant housing investment and management issues that are appearing in smaller towns, outside metropolitan regions, and in more sparsely populated rural areas.
However they were not the focus of the conversations in the NTNB forum.
Migration
Population growth can differ in its causalities and reflects the overall balance of emigration, immigration and net natural increase. Much of the growth discussed above, at all spatial scales, is due to migration. In all the nations included (with the exception of England discussed below) net migration has added more people to national populations between 2000 and 2010 than natural changes arising from births and deaths (Figures
2-6). Norway and Australia in particular experienced a spike in migration from 2006 (Figure 4) and during 2008-2009 (Figure 2) respectively. In Australia the majority of these overseas migrants settled in New South Wales and Victoria (Figure 2a), posing particular challenges of housing provision and planning by state and local governments in these regions. Population predictions for England set out a different expected pattern for the future. Migration is expected to fall to a constant level between 2011 and 2035 and significant increases in natural change are
anticipated over the next decade (Figure 5). Regional analysis suggest that across nearly all English regions replacement levels (i.e. the extent to which births exceed deaths) are predicted to fall from around 2020 onwards, notably in the South West where the birth rate is predicted to fall below the death rate during 2030. It is also predicted that there will be a mass exodus from London from around 2020 with net migration turning negative, and predicted increased migration into the South East and South West.
In Scotland, migration will still be a key component of population growth (Figure 6). However here too, certain areas are predicted to see a decline in population between 2010 and 2035, for example Inverclyde, East and West Dunbartonshire (where out-migration, reflecting the long term decline of these locations that had grown to serve industrialisation from 1880 to 1960, is expected to exceed in-migration). Northern, rural Scotland has much in common not just with Norway but with Northern and Atlantic Canada and with drier rural areas of Victoria in that decline will reflect a failure to reach replacement rates in natural change. Net Immigration not only raises pressures on metropolitan and local housing systems. It also diversifies populations in relation to ethnicity, culture and skills. It usually significantly raises the proportion of visible minorities, and In Canada, for instance, Statistics Canada (Statscan) report that 16percent of Canadians can be classed as visible minorities. Canada and Australia, with their high immigration rates, have
exceptionally diverse populations and labour forces. A recent study (Forbes Insights, 2012) indicates that a combined population-economic diversity index would place Canada, Australia and Norway (in Norway’s case this is largely because of gender diversity in occupations) in the 7 most diverse countries in the world.
Australia and Canada consistently appear near the top of global cross-national rankings of ethnic diversity. In Toronto, and indeed Melbourne, more than half of the current population was born outside of the country
they now live in. Both these metro systems have to absorb close to a thousand new households every week but also cope with the reality that the vast majority is immigrating from overseas. The nature of demands shifts as it grows. The UK and Norway, if at less extreme rates, confront these patterns too in their main growth regions around, respectively, London and Oslo. Immigration has been significant outside the London region too. In Glasgow, the settlement of Asylum seekers has been particularly significant in some of the places and communities housed by GHA communities.
Immigration, for some people, in some places, may require housing providers to make housing and neighbourhood management responsive to the shifting composition of populations. For instance there needs to be more attention to advice and support being supplied in multiple
languages and cultural and religious sensitivities recognised. Cost benefit studies of immigration to the UK, by Her Majesty’s Treasury (2007), have stressed the net economic gains from immigration. In all of our case study countries economic cases comprise the vast bulk of migrants. A major factor shaping these positives of immigration are that immigration is having a marked beneficial effect on the age structures of populations. It is important to note that population is not only growing and
diversifying, but it is also ageing.
Figure 2: Components of Population Change 2000-2011: Australia
Figure 2a.Migration: Australian States 2000-11.
Source: Australian Bureau of Statistics
Figure 3: Components of population change 2009-2014: Canada (Statistics Canada)
Figure 4: Components of population change 2000-2009: Norway (Statistics Norway)
Figure 5: Components of population estimates 2010-2035: England
Source: Office for National Statistics
Figure 6: Components of population estimates 2010-2035: Scotland
Source: General Register Office for Scotland
Population Ageing
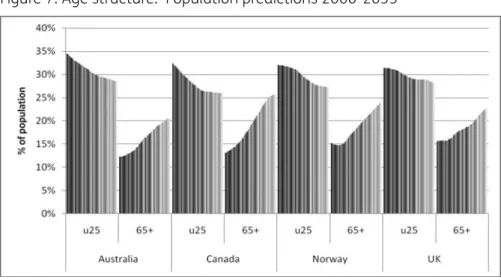
The ageing of societies is evident across all nations in the study. Although ageing is currently more pronounced in the UK and Norway, it is predicted that by 2035 at least a fifth, and up to a quarter, of national populations will be aged 65 or over (Figure 7). The decline in birth rates means the proportion of people at the younger end of the age scale is falling. In Australia and Canada this is significantly offset by high rates of immigration of relatively younger and more fertile households. At the
same time those who are already alive are living much longer, swelling the ranks at the older end of the age spectrum.
Figure 7: Age structure: Population predictions 2000-2035
Source: US Census Bureau
The detailed breakdown of age distribution in Figures 7a and 7b
demonstrate, by way of illustration, the patterns for Norway and Canada (patterns for the other countries are readily available from national statistical agencies) and make clear the rapid increase amongst the oldest old. In all nations the proportion of those aged 80 and over will nearly double between 2010 and 2035. This age group contain those with the most intense care needs. This not only has implications for health and social service providers (including, for example, stock utilisation), but will also impact on the types of housing provision needed in terms of bespoke sheltered accommodation or adaptations to existing properties. For those who continue to age well in-place, this will have wider
implications for the neighbourhoods in which these older people are located, in respect of local and accessible shops and services. Population ageing has potentially critical implications for housing providers, some of which are only being recognised and all of which require some consideration in organisations strategies. The key issues are that:
l As the population ages the official and actual ages of retirement tend to rise so that more older households remain in work
l Despite that increase, the ratio of retired to working age population rises
l The public spending burden of providing elderly services will have to be supported by a smaller proportion of the population (assuming that income taxes remain the main sources of tax revenue); this is the rising dependency ratio
l The rising numbers of very, and often frail, elderly households means that the post retirement requirement for health, care and potentially housing supports is rising per capita; that is potential expenditures per capita are rising as the dependency ratio rises
l If housing assets begin to form a rising component of the resource base that households have for ‘looking after themselves’ then housing funders and providers may be able to help provide owning/renting mixes and trajectories that allow ‘equity descent’ without losing housing security
l Increased longevity has also meant that households, or more particularly individuals, are facing more complex stages in their housing pathways
l In the last two years of life many individuals are facing the
prospect of moving from independent living, to living at home with care, then intensive care, then residence in nursing homes with increased use of hospital care.
l These changes confront housing providers with new roles as tele-healthcare moves to full service delivery and raises key questions as to who will manage changing living arrangements for the (often) single elderly
Rising per capita expenditures in (interrelated) housing, health and care services, increasing dependency ratios and the likely requirement for housing equity descent are all likely not just to impact but redefine the roles of non-profit providers in the decade ahead.
Figure 7a: Population growth and projections 2000-2035: Canada
Source: Statistics Canada
Figure 7b: Population growth and projections 2000-2035: Norway
Source: Statistics Norway
Household projections
Future housing demands are commonly identified through household projections. Growth in population does not correspond precisely with growth in households. For instance, rising incomes relative to house prices encourages more households to form, both through younger individuals leaving home earlier and through marital splits. Similarly, growing longevity will, usually, lead to rising numbers of single
households. The pace of growth of household numbers is now expected to rise faster than population growth due to the significant shift towards single person households (Figures 9-13).
In England this group will account for 41pc of households (11.2m) by 2033, rising from 34pc (6.2m) in 2008; similar growth is predicted in Scotland (36pc to 45pc; 0.8m to 1.3m). The growth is less pronounced but still predicted in Canada (27pc to 30pc; 0.3m to 0.5m) and Australia (24pc to 26pc; 2m to 3m). Forward predictions of household type are not available for Norway, but here single persons account for the largest household type which rose from 38pc to 39pc (0.7m to 0.9m) between 2001 and 2011. Rising proportions of single person households means that the ‘overhead’ cost of housing increases.
Closer scrutiny of single person households in England (Figure 13) shows that whilst a rise in numbers is predicted across all age groups this is expected to be greatest for those aged 85 and above. In Scotland where a breakdown by gender is available, indications are that most growth in single older persons will be among female headed households, with growth among male headed households concentrated among those of middle age (Figure 14).
The fall in the proportion of younger people in the population is also evident among changes in household type. Couple households with children who accounted for nearly one-fifth of all households in England (18pc; 3.7m) and Scotland (22pc; 0.5m) in 2001, are predicted to fall to 12 pc ( 3.4m)and 11pc (0.3m) respectively by 2033. Lone-parent households however are predicted to grow; 6-8pc of all households in both England (1.2m to 1.3m) and Scotland (0.1m to 0.2m) (Figures 8 and 9). This may account for the predicted growth in single male (through divorce or separation) headed households noted above.
New Times, New Demographics, New Business
The new times involve new demographics. Indeed it is arguable that the present prolonged recession in some countries will shape further
rearrangements in how families form and evolve. For instance high housing costs for younger households (amongst other things) have encouraged younger people to live longer at home and to return to parental homes after periods in higher education. More middle age households are now providing housing space, and care, for their elderly parents. The proportion of children raised by their grandparents is rising. These are small scale changes at present but they hint at further possible demographic changes that will reshape housing needs and demands.
The trends towards increased dependency ratios are however well established and that is likely to squeeze all but the best-argued spending programmes. With a potential new reliance on housing assets for old age support and with new complex life courses towards the end of life there are already well established cases for rethinking housing, care and health provision.
Figure 8: Household growth and projections: England
Source: DCLG Live Table 404
Figure 9: Household growth and projections: Scotland
Figure 10: Household growth and projections: Australia
Source: Australian Bureau of Statistics; 32360DO001_20062031
Figure 11: Household growth and projections: Canada
Figure 12: Household growth: Norway
Source: Statistics Norway
Figure 13: Projected growth in single person households 2008-2033: England
Figure 14: Projected growth in single person households 2008-2033: Scotland
Source: GROS
II.2 Economic Change, Growth and Redistribution
The nations included in this study have all been impacted by the major economic changes of the last two decades. The background has been a relentless globalisation of trade and information flows and increasing integration, albeit unevenly, of capital and labour markets in a context where the weight of demand growth influences have shifted from West to East. The long boom from the mid-1990’s to 2008 saw surplus savings from petrodollar surpluses and Asian expansion fuel substantial growth at low real interest rates throughout the advanced economies. That economic era ended abruptly in the GFC.
The changes in clients, costs and other constraints that public and non-profit housing providers now face reflects not just the depth and length of the post 2008 slowdown but the strength and height of the prior boom. Against the backcloth of still growing globalisation it is useful to consider the consequences of the long boom and then the subsequent downturn.
The Long Boom
Prior to 2008 housing markets and housing providers in the countries studied faced a decade and more of growth in incomes and employment. Average incomes rose by 20pc in England and 24pc in Scotland between 2002 and 2011. In Canada they rose 14pc between 2000 and 2009, Australia 37pc between (August) 2000 and 2011 and 34pc in Norway between 2000 and 2010.
As GDP grew unemployment first fell and remained low, in the UK and Australia from in excess of 6pc to under 4pc. In Norway unemployment was lower and fell to under 3pc in 2008. Unemployment rates in Canada are typically higher than in the other countries but also fell to just under 6pc by 2008.Despite sustained economic growth inflation rates remained low by post 1970’s standards and, inconsequence, policy interest rates, although higher than post 2008, remained relatively low. However progress within these nations was not even in all places or indeed equal for all income and skill groups. Sectorial and spatial differences in income growth became more important. In the advanced economies there has been a sustained tendency for the lowest decile or quintile of the income or wage distribution to have income increases at less than national average rates.
This pattern is well documented in the UK (Hills et al 2010). In Australia the government survey of households with low economic resources (LER) (households in the bottom quintile of both equivalised household
incomes and net worth) indicates that the incomes (equivalised) of LER households in09-10 was 45pc of other households and that whilst average incomes grew by 21pc between 2003-2009 this fell behind the 27pc growth experienced by others. The survey also notes a trend that can also be observed in Canada and the UK that the net worth, or wealth, of poorer households is falling further behind others, and especially the more affluent decile. In Australia, between 2003 and 2009, net worth did not grow at all for LER households whereas it increased for other
households by 29pc.The Charts below, for Canada (Figure 15a) and Norway (Figure 15b), also demonstrate inequalities in the distribution of and growth in, incomes across different family types.
Figure 15a: Average after-tax incomes by family type: Canada
Figure 15b: After tax income for households at constant prices: Norway
Source Statistics Norway
OECD assessed, with some concern, the increased patterns of inequality across the advanced economies around 2005. The results are reported in Figure 16 that indicates reported Gini coefficients of income inequality, where the four countries sit within these patterns and the extent to which government effort reduce market income inequalities. The UK has a relatively high market income inequality (comparable to the US) but taxes and transfer efforts reduce it significantly. Canada and Australia have similar mid-range market based inequalities but make less fiscal effort to reduce them than the UK so that all three countries have a post policy Gini coefficient in the range 0.32-0.34. Norway not only has lower market inequalities but also makes a greater fiscal effort to reduce them and is the third/fourth most equal country in the OECD with a Gini coefficient of 0.25
Figure 16.OECD Income Inequalities and Redistribution through Taxes and Transfers.
This figure was sourced from OECD (2011) Divided We Stand: Why Inequality Keeps Rising.
Despite income growth, associated rising inequality is always likely to raise housing needs and challenges for the non-market housing sector. These challenges are greater in the places that lag or that experience decline amidst broader growth. There are, as noted above, consistent patterns of spatial growth in the countries included in this study. Rising populations and rising incomes have been associated with growing urbanisation so that cities, and particularly large metropolitan areas, have experienced the most substantial growth. Over the two decades to 2008 the common features of spatial development have been that:
l Growth has impacted most regions but with remoter rural areas experiencing significant ageing and decline of population; in Australia and Canada the significance of mineral and food exports has driven exchange rates higher in ways that have made
economic progress more difficult for places engaged in more traditional manufacturing, such as south Australia and southern Ontario
l Within regions, metropolitan cores have experienced significant upward shifts in population and property values and the ‘inner city’ decline that preoccupied policymakers into the 1990’s no longer constitutes the key policy problem
l Rates of suburban and polycentric growth in outer metropolitan areas have exceeded city cores and that this growth has included
not just increasingly detached, large and energy intensive homes (‘McMansions’ as they are labelled in Canada and Australia) but also much expanded provision for lower income households on cheaper, inaccessible land and small homes with low amenities
l Smaller towns exhibit the greatest variety of experience so that some are booming where a new economic base emerges or where spillovers from proximate cities drives change; but even within metropolitan regions some older market and manufacturing towns are in decline as technologies, resources and demands shift
l Within cities and metropolitan areas there has been an increasing concentration of the poorest households into the poorest areas These observations make clear that in many instances non-profit providers faced growing challenges in the decade of growth and that they had not been resolved prior to the crash in 2008. These spatial growth patterns also highlight how the cost pressures, risks and roles that providers face have consistently diversified prior to 2008. To illustrate these points further it is relevant to consider the ways in which economic progress was transmitted into different, key housing outcomes in each context.
II.3 Housing Outcomes/Policy to 2008
Sustained economic growth, low inflation and low policy interest rates are, potentially, a very favourable macro-economic context for housing investment and progress. However the extent to which that potential is transformed into adequate housing outcomes within countries depends on the effectiveness of the housing finance system (and its regulation), fiscal arrangements that shape household investment and savings decisions and the responsiveness of the housing supply system to price signals. Differences in these key financial, fiscal and supply systems can mean that the spatial and sectorial impacts of change drivers can differ from place to place.
The significant deregulation of capital markets and mortgage finance arrangements in all of the countries in this study in the decades prior to 2000 meant that elastic market supplies of housing finance were available to fund residential investment through the long boom. In Canada, for instance, the share of residential investment rose sharply in the late 1990’s back towards its long run average of 6pc and then rose steadily to 7.5pc, fell after the GFC, but through 2011-12 has risen back to exceed 7pc. Until 2007 housing investment shares of national output
were above (post 1980) long term averages, though the patterns of temporal change varied from country to country (see figures below). These charts highlight a number of important considerations:
l New housing output was high through much of the decade and was significantly disrupted after 2008
l The Australian data highlights the sharp differences between some regions (in this case Victoria)and national trends
l Canadian data highlights the widespread tendency towards multi-unit construction to have risen faster than for single family
dwellings
l The Norwegian figures indicate how much 2008 impacted the construction sector in even the most robust of economies and also indicates how housing turnover, of existing homes, is strongly correlated with rising new starts
The figures from the UK indicate how uneven supply responses were by different housing tenures and how private growth outstripped expansion of market homes; elsewhere there were minimal expansions in non-market rental provision in the period to 2008.
Figure 17a.Forward Indicators of Dwelling Investment, Australia.
This Table was sourced from the Commonwealth of Australia Budget Estimates (2012), Statement 2: Economic Outlook.
Figure 17b.New Construction of Dwellings, Canada.
This Table was sourced from The Monetary Policy Report, Bank of Canada, July 2012.
Figure 17c.Housing Supply and Turnover in Norway after 2000.
Figure 17d.Housing Output in England by Tenure 2000-10
Data Source: Wilcox and Pawson (2012)
Figure 17e. Housing Output in Scotland by Tenure 2000-10
Data Source: Wilcox and Pawson (2012)
Two broad inferences can be drawn from these supply side changes in relation to non-market housing sectors. First, although private housing output expanded at faster rates than in the social sector it did so much less rapidly than overall housing demand. In the decade after there have been official concerns in a number of countries that the supply side of the housing system was needlessly sluggish, for instance the Barker reviews (2005, 2006) in the UK and the continuing National Housing Supply Council (2012) review in Australia. The outcome remains, however, that,
albeit to different extents, rising housing demand had driven significantly rising real house prices and rents and impacted on the ability of
households to pay for average or adequate homes. Secondly, the relative capacity of non-market sectors to address the emerging issues appears to have declined despite the conjunction of rising inequality and rising housing costs. These context issues need to be considered in more detail.
House prices and affordability
In the period between 2000 and 2011 nominal house prices in Scotland and England rose by 60pc, indeed prices had raised 75pc by 2008 before falling back. The other countries have had similar experiences, Norway had substantially higher price increases and, in common with Australia and Canada, after a small dip in 2009-10 has seen prices rise again. The longer term pattern presented for Canada demonstrates how after almost a decade of relative stability prices rose sharply and steadily after 2000 though the overall increase (around 45pc) was less than in the UK. Nominal house price increases in Australia were remarkably similar to the UK between 2000 and 2008, with increases of a similar magnitude. Since 2008 there has been a more divergent pattern of change across states with price pressures in Victoria remaining strong until the start of 2012 and driving the national average increases into small positive growth. In all of the countries included in this study there were marked
differences in the performance of different regional housing markets. In Australia the capital cities generally rose faster than other locations. In Canada, Vancouver, Toronto and the oil locations in the West saw well above national growth rates whilst in Norway and the UK the southern and capital city regions displayed the fastest rates of growth.
Figure 18a: House Price Changes: Norway
Figure18b. Nominal House Prices Canada, 1980-2010.
This Figure was sourced from MacDonald (2010) Canada’s Housing Bubble: an Accident Waiting to Happen. Canadian Centre for Policy Alternatives, Ottawa.
These rising house prices were generally reflected in rental markets and similar increases have been experienced in the rental sector. For
example average weekly rents in the private sector in England1increased
from £98 in 2000 to £149 in 2009/10, an increase of 68%. In Scotland2
weekly rents increased from £38 in 2000/1 to £55 in 20010/11, an increase of 44%. Latest figures for Australia indicate average rents for houses have increased 1.7% in the year 2011-2012 with unit rents increasing 4.1%3. In general, rents as well as house prices rose ahead of
average incomes in all of the countries for the period 2000 to 2010. Clearly this has significance for the ability to pay for housing, especially for the poorest deciles of the income distribution whose income growth, as noted above, have lagged behind national averages.
Affordability: Concerns about Outcomes
Christophe Andre (2010) has reported on how house price to income ratios and price to rent ratios have evolved over the last 30 years. In Norway, after a late 1980’s boom, the house price to income ratio fell until 1992 and has since risen to an index (in relation to the long term average) of 130. Canada, similarly, after a late 80’s rise saw the index fall to less than 100 for almost the whole decade prior to 2000 and indeed has risen from
1 Analysis of Survey of English Housing/English House Survey 2 Data obtained from Shelter Scotland
92 in 2001 to an index of 120 in 2008, and that index prevails through 2011. Australia had a different pattern of ups and downs but like Canada the index hovered in the 90’s though the 1990’s before rising sharply to 140 by 2008. The UK, with a particularly unstable housing market, saw the index also rise from the high 90’s to 140 by 2008.
A common measure of affordability is where housing costs do not exceed 30% of household income. In England (Figure 19) all regions were moving beyond the realms of affordability for first time buyers, with mortgage payments exceeding 30% of mean net incomes during 2007 (reaching 70% in London and only falling to 49% in 2012). In Australia the proportion of the population paying a third or more of their incomes on housing costs (across all tenures) increased from 14% in 2000/1 to 17% 2009/10. In Canada around one-fifth of all households paid more than 30% in any one year between 2002 and 2004 (Rea et al, 2008). The research from Canada (Rea et al, 2008) shows that those who persistently exceed the affordability benchmark are more likely to be in low income households, renters (especially those who are paying full market rent), female lone parents or single people, and recent immigrants.
Regional variations are also apparent with Vancouver and Toronto residents being among those who are persistently likely to exceed the affordability threshold.
Figure 19: Mortgage payments as % of mean take home pay: First time buyers, England
Figure 19b: Mortgage payments as % of mean take home pay: First time buyers, Scotland
Source: Nationwide
One of the starkest measures of affordability and housing need is reflected through levels of people living in temporary accommodation or those lacking any suitable shelter. Homelessness by its nature is difficult to count. International comparisons are further complicated by the varying definitions used and the impetus of national governments to acknowledge and tackle homelessness issues. Caution must therefore be expressed with the data as a rise in numbers may not only be indicative of a worsening situation, but may be due to better data recording.
Irrespective of recorded trends in homelessness, it nonetheless remains an issue in all nations. Cross national differences in the ways in which
homelessness is defined and counted, not only across countries but across different sub-national jurisdictions, means that comment here is limited. The latest data available indicated that 49,000 households are in
temporary accommodation in England, in Scotland the figure is around 11,000. In Australia homelessness stood at just under 105,000 in 2006 whilst estimates for Canada vary between 150,000 and 300,000. Figure 20a: Temporary accommodation and homelessness: England
Figure 20b: Temporary accommodation and homelessness: Scotland
Source: Scottish Government
Affordability: Concerns about the Concept for the New Times
Across the board patterns of house price rises have resulted, as shown above, in a number of different pressures on paying for housing. Clearly, low income households faced with rents rising more rapidly than incomes face the problem of affordability as conventionally defined. Simply paying for their ‘flow’ of housing services will leave such households insufficient residual incomes to be able to maintain an adequate standard of living. This pattern has also brought into play much wider uses of the term ‘affordability’ that, allied to relatively thoughtless estimation of actual affordability parameters, have had the consequence of often muddying understanding of the payment issues involved.
In these new times some non-profits are moving beyond traditional low income rental housing provision to fashion a new involvement in rental housing markets and to build ladders of equity sharing and part ownership to allow their tenants and others to move from renting to owning. They, like policy makers, need a much sharper, nuanced and precise approach to measuring problems of paying for housing. This issue is revisited throughout the chapters below.
IS’ AFFORDABIULITY’ HOPELESSLY CONFUSED AS A POLICY LANGUAGE?
After 2000 it became commonplace to consider the problem of housing affordability for home-owners, not least because younger households facing rising starter home prices (whilst entry employment incomes and wages relatively stagnated) were encountering increasing difficulty in entering home ownership. The home ownership rates for households under 35 years fell in Britain, Canada and Australia after the end of the 1990’s.
However, lumping the problems of sustaining rents for the poor with the homeownership acquisition costs for the aspirational young into an overall affordability index or singular policy argument does not help effective policy making. Where governments make affordable housing provision promises and then find budgets constrained they may then reduce per dwelling support rates in ways that shift investment programmes away from poorer to middle income households. This shift has typified British housing policies since 2010.
The different decade of the 2000’s really required a new policy language and precision to appear so that the different problems involved could be adequately understood and addressed. The new times require new policy language.
Housing affordability involves, aside from the ethical decisions of governments, or others providing support, three different ideas. In the rental sector the traditional notion of affordability, although better expressed as an equivalised residual income measure than rent to income ratio, deals adequately with the problem it addresses. The problem arises in using price to income measures as an estimate of a household’s capacity to pay for home-ownership. An asset is being acquired as well as housing services secured.
Rather than price to income ratios two other measures are required to understand the cost of ownership and the burden of sustaining it. The price of a dwelling does not represent an effective measure of the cost of a dwelling to an owner. Economists are familiar with the user cost of capital for an asset. For an owner occupied home (assuming for simplicity here that mortgages cover 100 per cent of purchase costs) the annual user cost of capital for the home, c, is :
c= P ( 1+r+t+d-h)
Where P is the house price, r is the interest rate paid, t is any pro rata tax advantage for housing, d is payments for depreciation and maintenance and h is the expected rate of house price appreciation. Through the early years of the millennium, although P was rising, r was at low historic rates, t and d changed little and h was at historic high levels (as consumer expectations of house price rises remained buoyant). In these terms owning housing was in fact historically cheap relative to incomes and in consequence demand grew even as prices continued to rise. The second measure
that needs to be understood is the capacity of household income, as annual cash flow, to support mortgage repayments. With interest rates changing as well as mortgage terms and durations, then price no longer adequately proxies what needs to be afforded. Rather attention has to be focussed on the capacity to sustain mortgage outgoings, say the monthly mortgage to income ratio. There is also now a need to understand whether in the absence of 100 per cent mortgages and new pressures to place significant equity deposits on purchase households have adequate deposit capacity. Indeed looking forward, and dealing with low cost home owner initiatives, not-for-profits need to abandon simple price to income measures of payment pressure and separately identify whether the real user cost estimate makes purchase rational, whether income flows will sustain mortgage payments and whether there is adequate deposit capacity. We return to these ideas in assessing the post GFC period.
Tenure Patterns
Throughout the study period governments in the four countries were strongly committed to home-ownership growth as a key housing policy aim. Prior to 2008 only the UK, at the national government level, showed any significant commitment to investment in new social rental housing. Figure 21a: Tenure trends: England
Source: SHE/EHS
Figure 21b: Tenure trends: Scotland
Figure 21c: Tenure trends: Australia
Source: Australian Bureau of Statistics
Figure 21d: Tenure trends: Canada
Figure 21e: Tenure trends: Norway
Source: EU-SILC
The figures above show some common trends across all of the countries:
l The social or non-market rental sector was experiencing absolute and relative decline and within that sector there was a growing significance of non-profit as opposed to public providers of social housing
l it is also apparent from lettings records and housing subsidy reports that there has been further ‘residualisation’ of the social housing sector in all of the countries studied here; pressure on waiting lists to enter and house price gain incentives for better off tenants to leave and buy homes means that in the non-market sector there is a growing preponderance of low income elderly, lone parent families and unemployed housing; non-market housing providers now primarily house those with least economic resources
l In contrast, the market rental sector has generally expanded in scale and in Australia and the UK has expanded more rapidly over the decade than did home-ownership; private rental markets in these countries have been the most significant sector
accommodating the growth of the last decade
l Home ownership numbers have continued to expand but with a decline in outright owners.
These trends look set to continue into the future. However the expansion in home ownership needs further scrutiny. It was noted above that home-ownership rates have been declining for younger households for
the last two decades. The charts below illustrate this for England and Norway but similar processes are apparent in Australia and Canada too. In effect the rising numbers of older households living longer with high rates of home ownership has masked the significant fall in younger households entering ownership. We believe that governments in all of the countries studied here have failed to recognise how rising
home-ownership has been achieved and in consequence have failed to grasp the need to rethink and re-emphasise rental sector policies and provisions. The new times need a new focus on how rental housing is shaping emerging patterns of housing consumption.
Figure 22a: Proportion of owner-occupiers by age group: England
Data source: Survey of English Housing/English House Survey
One of governments’ responses to the entry problems of first time buyers has been to develop forms of tenure that are beginning to blur the long-standing boundaries between renting and owning, for example the emergence of shared-ownership.
SHARED OWNERSHIP AS AN ENTRY ROUTE ‘Shared-ownership’ combines private ownership of a property (usually a minimum of 25%) with rental from a social housing provider. Different models of shared-ownership have emerged in the UK since their introduction as part of move towards increasing availability of low-cost home ownership. They have become a significant feature of housing association business plans, as the surpluses generated are increasingly being used to cross-subsidise social renting.
Shared ownership style products have been available in England since the 1970s. The stock of shared ownership properties grew 28% in the ten years from 68,000 in 1997/8 to over 86,000 in 2006/7. In Scotland shared ownership was not established until 1990s. Unlike England the stock here has reduced from 7,620 in 2001 to 5,822 in 2006.
Source: Wallace A (2008) Achieving Mobility in the Intermediate Housing Market: moving up and moving on? York: Joseph Rowntree Foundation
A second important development has been a growing tendency for governments to shift support for needy low income households away from traditional public housing and into the non-profit sector. In addition, there has been a marked move from capital support into rental
allowances that are used in the private rental housing market. Both these tendencies are apparent in developments in the ‘supported’ rental sector in Australia over the last decade or so see Figure 23 below.
Figure 23.Support for Low Income Renters in Australia, 2000-2010.
This Figure and Figure 24 were sourced from Housing Assistance for Renters, Australian Social Trends, September, Australian Bureau of Statistics. www.abs.gov.au/socialtrends.
The chart makes clear the slow stagnation of the total stock of public housing units that lie in the hands of Australian state authorities. The expansion in the non-profit sector (the community sector in the Figure), has accelerated in the last few years but the growth of that sector has simply kept the overall non-market stock over the decade as the
population has grown significantly. However the total number of income units in supported rental tenures (i.e. non-government landlords) has risen significantly, so that market providers are providing an increasing total and share of the homes for Australia’s poor. The position in 2009-11 is summarised in Figure 24below. Private rental providers now house twice as many of Australians eligible for rent support and assistance than does public and community housing.
Figure 24
Similar developments have occurred in the Affordable Housing
Programme in Canada where some provinces have chosen to use Federal funds to provide low income housing allowances rather than support new housing development. In the UK there has been a significant extension of market rental provision to households in receipt of housing benefit (Called Local Authority Housing Allowance paid in England and Scotland). Some of the housing issues that emerged in the long boom, such as homelessness, the low quality of much social housing, the high rent payments of low income households and the frustrated tenure objectives of younger households were unresolved by the middle of the decade to 2010, although governments did devote more resources to housing than in the previous decade. Non-profits adapted roles and structures to play wider roles in the emerging boom with greater access to private finance. But the changes that they had begun to make, and that we consider in subsequent chapters, were overwhelmed by the GFC. After 2008 the world for housing providers has changed, new challenges have come to coexist with the new roles and problems embraced in the previous decade. How did the GFC impact the context for housing providers? III. AFTER THE CRASH
After 2008 countries have had to cope with three different, but interacting, sources of economic difficulty. All three of these crises, in some countries, have implications for the future development of their housing systems.
default rates on mortgage backed securities (MBS). This not only led to the demise of the MBS market but also the fracturing of financial institutions and confidence in these systems in at least some of the countries studied here. The UK was most obviously impacted and the sector survived only with a £1000m bail-out from government but the other three countries, as their banks had made wiser asset decisions, did not suffer this fracturing to the same extent. Banking failure is not the most serious of the current problems in Norway, Canada and Australia. The banking crisis disrupted trade and investment, immediately triggering a reduction in employment and income in most advanced economies. All countries then faced a more conventional recession reflecting dampened trade. As a response to rising unemployment governments, after 2008, introduced ‘stability’ fiscal packages to increase domestic demand and employment. Housing policy investment was raised markedly in the UK and Australia, in Canada infrastructure
investment received somewhat greater additional support than housing, and the least significant demand boost, indeed where it was least needed, was in Norway.
By 2009 the problems of banking sector debt and household debt also, being unwound by government spending, transmuted into growing global concern about rising levels of sovereign debt. Strategies to reduce
outstanding government debt also required reductions in government deficits and this had, by 2010, begun to put downward pressure on support for housing spending. Housing policy investment budgets are now falling in all the countries in the study. In some countries the level of outstanding public debt and a perceived incapacity to reduce it has fuelled a sovereign debt difficulty largely within the EU that has in turn threatened the stability of the Euro. With China slowing its demand for imports and the EU hovering on recession the period since 2011 has been a difficult one for the global economy.
The consequences of these changes have impacted the countries
included here in quite different ways. Norway, Canada and Australia have largely met their growth targets for 2011, indeed economic growth forecasts suggest that in 2012-13 or 14 they expect to return close to long term average growth rates. The UK, with larger public debt to unwind, is still struggling into positive growth after the end of a double dip recession through much of 2012. Monetary policy in all countries is still committed to record low interest rates into 2013 but the national banks in all these countries have indicated that by the end 2013 there is more likely to be a return to higher interest rates.