A Machine Learning System for Automatic Detection of Preterm
Activity Using Artificial Neural Networks and Uterine
Electromyography Data
P. Fergus1, A. Hussain1, D. Al-Jumeily1 and H. Hamdan2 1
Applied Computing Research Group, Liverpool John Moores University, Byrom Street, Liverpool, L3 3AF, United Kingdom. Email:[email protected] Telephone: +44(0)151-231-2629 2 Supelec,
Department of Signal Processing and Electronic Systems, Plateau de Moulon,
3 rue Joliiot-Curie,
91192 Gif-sur-Yvette Cedex, France.
A Machine Learning System for Automatic Detection of Preterm
Activity Using Artificial Neural Networks and Uterine
Electromyography Data
ABSTRACT
Background: Preterm births are babies that are born before 37 weeks of gestation. The premature delivery of babies is regarded as a major global public health issue with those affected at greater risk of developing short and long-term complications. The care provided for premature infants has significantly improved. However, it has had no impact on reducing the prevalence of preterm birth. Therefore, a better understanding of why preterm births occur is needed.
Methods: Electromyography is used to capture electrical activity in the uterus to help treat and understand the condition, which is time consuming and expensive. This has led to a recent interest in automated detection of the electromyography correlates of preterm activity. This paper explores this idea further using artificial neural networks to classify term and preterm records, using an open dataset containing 300 records of uterine electromyography signals. The Synthetic Minority Oversampling TEchnique is used to oversample the minority preterm class (38 records) to address the issues found in unbalanced datasets and classification.
Results: Our approach shows an improvement on existing studies with 94.56% for sensitivity, 87.83% for specificity, and 94% for the area under the curve with 9% global error when using the Multilayer perceptron neural network trained using the Levenberg-Marquardt algorithm.
Discussion: The Multilayer perceptron neural network trained using the Levenberg-Marquardt algorithm produced the best results, which is trained using Newton’s method of least squares optimization and is an efficient learning algorithm for neural networks that have a few hundred weights, despite being computationally expensive.
Keywords: Term delivery, preterm delivery, machine learning, classification, Electrohysterography
1. INTRODUCTION
A premature baby is a newborn who is delivered, alive, before 37 weeks of gestation according to the World Health Organisation (WHO) [1]. The global prevalence of preterm births was said to be 10% of all births in 2010 [1]. In England and Wales, 7% of live births were preterm1 in 2009. Preterm birth has a significant adverse effect on the newborn. Approximately, 50% of all perinatal deaths are caused by preterm delivery [2], with those surviving often suffering from afflictions, caused by the birth. These include disabilities,
problems with growth, and mental development [3]. In 2005, the overall cost, in the US, was estimated to be $26.3 billion, while, in England and Wales, this value was close to £2.95 billion [4].
The cause of preterm birth, in many situations, is elusive and unknown. According to Baker
et al. [2], one-third are medically indicated or induced (delivery is brought forward) in the interest of the mother and baby. Another third occurs when membranes rupture, prior to labour, and is known as Preterm Premature Rupture of Membranes (PPROM). In the remaining third, spontaneous contractions (termed pretermlabour or PTL) develop. While it is difficult to identify particular causes, studies have found several factors for why
PTL/PPROM may occur [5], [6]. These include a previous preterm delivery (20%); last two births have been preterm (40%), and multiple births (twin pregnancy carries a 50% risk). Other health and lifestyle factors have also been found, and these include cervical and uterine abnormalities, recurrent antepartum haemorrhage, underweight or obese mothers, ethnicity, social deprivation, long working hours/late nights, alcohol and drug use, and folic acid deficiency.
Where there is clinical uncertainty, para-clinical evidence from Electrohysterography (EHG) can help to detect preterm activity earlier and provide treatment to mitigate its affects. However, EHG capture and interpretation are time-consuming and costly because interpretation can currently only be performed by specialist clinicians, trained in EHG
interpretation. This has led to a recent interest in automated preterm activity detection. In this paper, the focus is on prolonged ambulatory monitoring in a hospital for patients with an unclear diagnosis and underlying problems that manifest as human preterm activity. An open dataset has been adopted, which contains 300 records (raw EHG signals) of pregnant subjects (262 term and 38 preterm). The results indicate that artificial neural networks outperform a number of previous approaches in the ambulatory monitoring of uterine electromyography data.
The structure, of the remainder, of this paper is organised as follows. Section 2 describes the underlying principles of Electrohysterography. Section 3 describes how features are extracted from Electrohysterography signals. Section 4 discusses machine learning and its use in term and preterm classification, while section 5 presents the approach taken in this paper. Section 6 describes the evaluation, and Section 7 discusses the results. Section 8 then concludes the paper.
2. ELECTROHYSTEROGRAPHY
Electrohysterography (EHG) is the recording of changes in electrical activity associated with uterine contractions. To retrieve EHG signals, bipolar electrodes are adhered to the abdominal surface. These are spaced at a horizontal, or vertical, distance of 2.5cm to 7cm apart. Most studies use four electrodes, although other configurations have been reported; two [7]; sixteen [8]–[13]; and 64 [14].
Raw EHG signals are the result of electrical activity propagated between cells in the myometrium (the muscular wall of the uterus). The signal is a measure of the potential differences between electrodes, in the time domain. They are not propagated by nerve endings; however, the propagation mechanism is not clear [15]. Since the late 70s, one theory is that gap junctions are the mechanisms responsible. However, more recently it has been
suggested that interstitial cells, or stretch receptors may be the cause of propagation [16]. Gap junctions are groups of proteins that provide channels of low electrical resistance between cells. In most pregnancies, the connections between gap junctions are sparse, although they do gradually increase, until the last few days before labour. A specific pacemaker site has not been conclusively identified, although, due to obvious physiological reasons, there may be a generalised propagation direction, from the top to the bottom of the uterus [17].
The electrical signals, in the uterus, are ‘commands’ to contract. During labour, the position of the bursts, in an EHG signal, corresponds roughly with the bursts shown in a tocodynamometer or intrauterine pressure catheter (IUPC). Clinical practises use these devices to measure contractions. More surprisingly, distinct contraction-related, electrical uterine activity is present early on in pregnancy, even when a woman is not in true labour. Gondry et al. identified spontaneous contractions from EHG records as early as 19 weeks of gestation [18]. The level of activity is said to increase, as the time to deliver nears, but increases rapidly, in the last three to four days, before delivery [19]. As the gestational period increases, the gradual increase in electrical activity is a manifestation of the body’s preparation for the final act of labour and parturition. In preparation for full contractions, which are needed to create the force and synchronicity required for a sustained period of true labour, the body gradually increases the number of electrical connections (gap junctions), between cells. In turn, this produces contractions in training.
Before analysis or classification occurs, EHG signals, in their raw form, need pre-processing. Pre-processing often includes filtering, de-noising, wavelet shrinkage or transformation and automatic detection of bursts. Recent studies have typically focused on filtering the EHG
signals to allow a bandpass between 0.05Hz and 16Hz [20]–[24]. However, there are some that have filtered EHG recordings as high as 50Hz [15]. Nevertheless, using EHG with such a wide range of frequencies is not recommended, since unwanted artefacts can affect the signal.
3. FEATURE EXTRACTION FROM ELECTROHYSTEROGRAPHY SIGNALS
Power Spectral Density (PSD) features are widely used in EHG studies. Peak frequency is a PSD feature that is provided within the Term-Preterm ElectroHysteroGram (TPEHG) dataset2. It describes the frequency of the highest peak in the PSD. Most studies focus on the
peak frequency of the burst and it is said to be one of the most useful parameters for predicting true labour [25]. In several studies, the results show that peak frequency increases, as the time to delivery decreases; generally, this occurs within 1-7 days of delivery [15], [26], [20], [22], [7], [27]. The results in [24] show that there are, statistically, significant differences in the mean values of peak frequency and the standard deviations in EHG
recordings taken during term labour (TL) and term non-labour (TN) and also between preterm
labour and preterm non-labour.
Meanwhile, the study in [28] found that median frequency displayed a significant difference, between term and preterm records. When considering all 300 observations, the statistical significance was p=0.012 and p=0.013, for Channel 3, on the 0.3-3Hz and 0.3-4Hz frequency bands, respectively. Furthermore, this significance (p = 0.03) was also apparent when only considering early records (before 26 weeks of gestation), with the same 0.3-3Hz frequency
band, on Channel 3. The study concluded that this might have been due to the enlargement of the uterus, during pregnancy, which would affect the position of electrodes.
Using the Student’s t-test, the study in [28] found that root mean square might be useful in distinguishing between whether the information was recorded early (before 26 weeks of gestation) or late (after 26 weeks). The results obtained are in agreement with [26], [15], and [29], who found that the amplitude of the power spectrum increased, just prior to delivery. This was despite only analysing the root mean square values, per burst, rather than the whole signal. Other studies found that amplitude-related parameters did not display a significant relationship to gestational age or indicate a transition to delivery (within seven days) [21], [19], [24]. Some of these discrepancies may be due to the differences between the characteristics in the studies: [28] compared records before and after 26 weeks, whereas [21] only examined records after the 25th week; [30] and [27] studied rat pregnancy, in contrast to human pregnancy. The frequency band used in [26] and [15] was also a much broader band than in other studies (0.3 - 50Hz; no bandwidth given for [29]), and also, the studies by [30] and [27] measured per burst, whilst [21] measured the whole signal.
Sample entropy measures the irregularity of a time series, of finite lengths. This method was introduced by [31] to measure complexity in cardiovascular and biological signals. The more unpredictable the time series is, within a signal recording, the higher its sample entropy. The process is based on calculating the number of matches of a sequence, which lasts for m
points, within a given margin r. The disadvantage of this technique is the requirement to select two parameters, m and r. However, sample entropy did show a statistical difference between term and preterm delivery information, recorded either before or after the 26th week of gestation, when using any of the aforementioned frequency bands, but only using the signal from Channel 3 [28].
Phinyomark et al. have carried out an extensive evaluation of features commonly used and extracted from electromyography (EMG) signals, which have not been widely explored in studies on preterm deliveries [32]. Some of the more interesting features include, Log Detector, Waveform Length and Variance with classification accuracies of 83.32%, 88.72% and 78.42% respectively. The Log Detector of the EMG is useful in providing an estimate of the muscle contraction, while Waveform Length measures the complexity of the EMG signal. The Variance of an EHG signal does not have the same discriminatory power as the aforementioned features, however, it is useful in augmenting the other features to provide a more powerful feature vector [33].
4. TERM AND PRETERM CLASSIFICATION
Machine Learning algorithms have been utilised in a large number of studies to classify term
and preterm deliveries and distinguish between non-labour and labour events [34]. In [10], Moslem et al. argue that artificial neural networks are particularly useful for identifying important risk factors associated with preterm birth with global accuracies ranging between 73% and 97%.
In one such study, Baghamoradi et al. [35] adopted the TPEHG database, and compared
sample entropy with different cepstral coefficient values extracted from each signal recording through sequential forward selection and Fisher’s discriminant. A multi-layer perceptron (MLP) neural network, trained using the backpropagation algorithm, was implemented to
classify each of feature vectors as either term or preterm. The results indicate that using three cepstral coefficients produced the best classification accuracy, with 72.73% (±13.5); using thirty coefficients showed only 53.11% (±10.5) accuracy, while sample entropy performed the worst with an accuracy of 51.67% (±14.6).
Meanwhile, Al-Askar et al. [36] have developed a neural network that builds on the self-organized layer inspired by immune algorithm (SONIA) network, to classify both term and
preterm labour using EHG signals from the TPEHG database. Using a feature set comprised of peak frequency, median frequency, root mean squares and sample entropy (extracted from the raw signals on Channel 3 in the 0.3-3Hz frequency band), the algorithm was evaluated and the results show an overall accuracy of 70.82%.
Support Vector Machines (SVM) have featured widely in research on preterm deliveries and are considered robust algorithms for classification tasks [8]–[10]. The primary focus has been to classify contractions as labour or non-labour events, using different locations on the abdomen. The feature vectors include the power of the EMG signal, and the median frequency. The highest accuracy for a single SVM classifier, at one particular location on the abdomen, was 78.4% [8], [9], whilst the overall classification accuracy, when SVMs were combined, was 88.4% [10].
The k-nearest neighbour (k-NN) has also proven to be useful in preterm studies. In one particular case [37], the k-NN algorithm was utilised in conjunction with Autoregressive (AR) modelling and Wavelet Transform (WT) pre-processing techniques. The study focused on classifying contractions into three types, using data obtained from 16 women. Group 1 (G1), were women who had their contractions recorded at 29 weeks, and then delivered at 33 weeks; Group 2 (G2) were also recorded at 29 weeks, but delivered at 31 weeks, and Group 3 (G3) were recorded at 27 weeks and delivered at 31 weeks. Classification occurred against G1 and G2, and against G2 and G3. Using AR, the k-NN provided a classification error of 2.4% for G1 against G2 and 8.3% for G2 against G3. The classification accuracy for G1 and G2 was always lower than the equivalent G2 and G3 classifications. This suggests that it is easier to distinguish between pregnancies recorded at different stages of gestation than it is to predict the time of delivery.
5. AUTOMATIC DETECTION OF PRETERM ACTIVITY
The aim in most studies, on preterm prediction or detection, has been to detect true labour, rather than predicting, in advance, whether delivery will be preterm or term. Furthermore, many studies have focused on the more advanced stages of gestation. Even when earlier stages are incorporated, they always only included those with threatened preterm labour. For term deliveries, true labour only starts within 24 hours. For preterm deliveries, it may start anywhere between 7 and 10 days. The change in EHG activity, from non-labour to
labour, is dramatic; throughout the rest of the pregnancy, any change in EHG is more gradual. Therefore, classification of records, into preterm and term, is particularly challenging. For this reason, and due to the configuration of the TPEHG dataset used in this study, we attempt to classify records from an earlier stage, according to whether they will eventually result in
term or preterm deliveries.
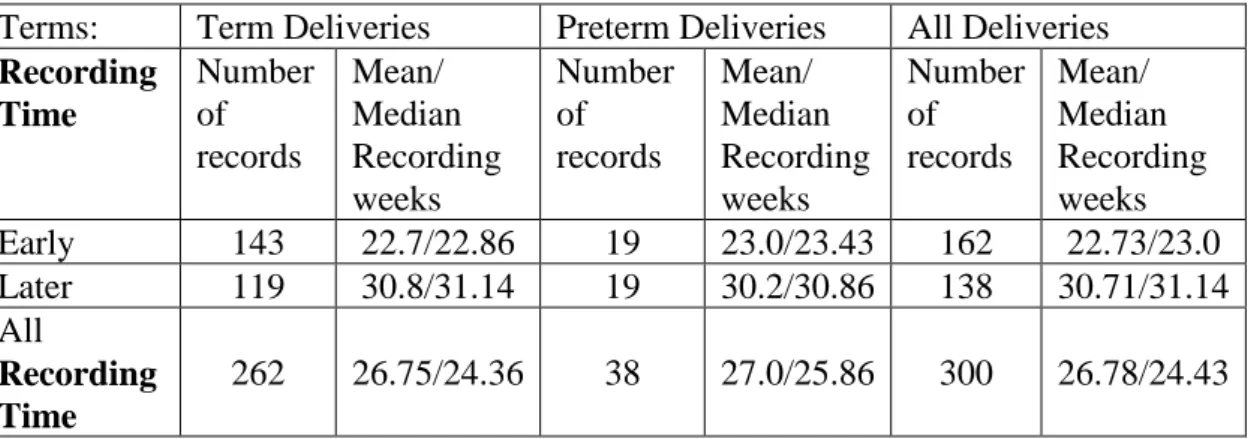
The EHG records used in this study are from a general population of pregnant patients at the Department of Obstetrics and Gynaecology Medical Centre in Ljubljana, gathered between 1997 and 2006. These records are publicly available, via the TPEHG dataset, in Physionet3. The dataset contains 300 records (one record per pregnancy). Each recording is approximately 30 minutes long and records are either recorded early, <26 weeks (at around 23 weeks of gestation) or later, =>26 weeks (at around 31 weeks). Table 1 shows the classification of records in the TPEHG dataset.
Terms: Term Deliveries Preterm Deliveries All Deliveries
Recording Time Number of records Mean/ Median Recording weeks Number of records Mean/ Median Recording weeks Number of records Mean/ Median Recording weeks Early 143 22.7/22.86 19 23.0/23.43 162 22.73/23.0 Later 119 30.8/31.14 19 30.2/30.86 138 30.71/31.14 All Recording Time 262 26.75/24.36 38 27.0/25.86 300 26.78/24.43
Table 1: - Numbers of Patients in each group
The recording time relates to the gestational age of the foetus, at the time of the recoding. The classification of these recordings, as term and preterm deliveries, was made retrospectively, after giving birth, and following the widely used definition of preterm being under a fully completed 37 weeks. Therefore, the four categories of recordings are as follows:
1. Early-Term: Recordings made early, which resulted in a term delivery 2. Early-Preterm: Recordings made early, which resulted in a preterm delivery 3. Late-Term: Recordings made late, which resulted in a term delivery
4. Late-Preterm: Recordings made late, which resulted in a preterm delivery
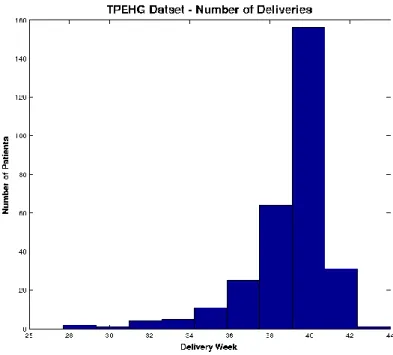
Figure 1 shows the distributions of term and preterm records in the TPEHG dataset, in which the majority of the data are term.
3 http://www.physionet.org
Figure 1: Distribution of deliveries in TPEHG dataset
5.1.1 Data Pre-processing
Each of the records in the TPEHG dataset, have a sample frequency of 20Hz. The scanning system used 16-bit resolution, with an amplitude range of ± 2.5mV. Before sampling took place, an analogue, three-pole, Butterworth filter, was adopted with a 1-5Hz range. Signals were recorded simultaneously through three different channels (Channel 1, Channel 2, and Channel 3), via four electrodes attached to the abdominal surface, with the navel at the symmetrical centre. The first of the four electrodes (E1) was placed 3.5 cm to the left and 3.5 cm above the navel. The second electrode (E2) was placed 3.5 cm to the right and 3.5 cm above the navel. The third (E3) was placed 3.5cm to the right and 3.5 cm below the navel. Finally, the forth electrode (E4) was placed 3.5 cm to the left and 3.5 cm below the navel. The differences in the electrical potentials of the electrodes were recorded to produce the three channels (E2-E1 – the first channel; E2-E3 – the second channel; and E4-E3 – the third channel).
Fele-Zorz et al. showed that the 0.3-3Hz filtered signals on Channel 3 were the best for discriminating between preterm and term records [28]. The results show that sensitivities
(true positives – in this instance preterm records), produced by several of the classifiers, was higher than those produced when other filters were used [28]. However, there was no appropriate filter to remove unwanted artefacts, such as maternal heart rate. Garfield et al.
[27], found in a study of 99 pregnant indiviuals, that 98% of uterine electrical activity occurred in frequencies less than 1 Hz, and that the maternal heart rate (ECG) was always higher than 1Hz. Furthermore, 95% of the patients measured, had respiration rates of 0.33 Hz or less. Therefore, the authors considered that a 0.34-1Hz bandpass filter could remove most of the unwanted artefacts. Several other studies have adopted the same filtering scheme [38], [8], [9]. Consequently, in this paper, the raw Channel 3 signal has been filtered using a 0.34-1Hz bandpass filter. This is based on an empirical analysis of all channels and filters
described in the literature, where the best results obtained were from the Channel 3 signal using the 0.34-1Hz bandpass filter. This coincides with the findings in [28] and [27].
5.1.2 Feature Extraction
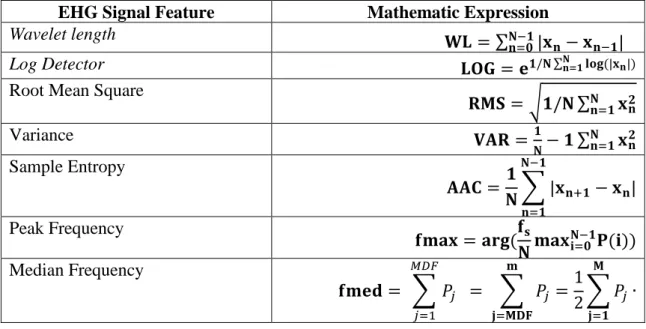
Several feature extraction techniques have been utilized from [28], [39]–[41] to extract features from the raw Channel 3 signals using the 0.34-1Hz filter. Table 2 provides a formal definition for each feature, where, 𝑥𝑛represents the 𝑛𝑡ℎ sample in the EHG signals in the segment; P represents the power spectrum (calculated using the Fast Discrete Fourier Transform), and N denotes the length of the EHG signal.
EHG Signal Feature Mathematic Expression
Wavelet length 𝐖𝐋 = ∑ |𝐱
𝐧− 𝐱𝐧−𝟏| 𝐍−𝟏
𝐧=𝟎
Log Detector 𝐋𝐎𝐆 = 𝐞𝟏/𝐍 ∑𝐍𝐧=𝟏𝐥𝐨𝐠 (|𝐱𝐧|) Root Mean Square
𝐑𝐌𝐒 = √𝟏/𝐍 ∑𝐍 𝐱𝐧𝟐 𝐧=𝟏 Variance 𝐕𝐀𝐑 =𝟏 𝐍− 𝟏 ∑ 𝐱𝐧 𝟐 𝐍 𝐧=𝟏 Sample Entropy 𝐀𝐀𝐂 =𝟏 𝐍∑ |𝐱𝐧+𝟏− 𝐱𝐧| 𝐍−𝟏 𝐧=𝟏 Peak Frequency 𝐟𝐦𝐚𝐱 = 𝐚𝐫𝐠(𝐟𝐬 𝐍𝐦𝐚𝐱𝐢=𝟎𝐍−𝟏𝐏(𝐢)) Median Frequency 𝐟𝐦𝐞𝐝 = ∑ 𝑃𝑗 = ∑ 𝑃𝑗 = 1 2 𝐦 𝐣=𝐌𝐃𝐅 ∑ 𝑃𝑗∙ 𝐌 𝐣=𝟏 𝑀𝐷𝐹 𝑗=1
Table 2 Features extracted from raw EHG signals
Using the features defined in Table 2, feature vectors have been generated. The literature reports that peak frequency, median frequency, sample entropy, root mean squares, Wavelet length of EMG signal, Log Detector of EMG signal, and Variance have the most potential to discriminate between term and preterm records and as such are used in the evaluations in this paper.
A justification for using these features is based on initial exploratory data analysis (on a larger set of features0 to measure the distributions of different feature values. Candidate features were selected that did not occupy coincident regions of the feature space, to ensure that the classification algorithms can make appropriate distinctions between the two classes. From this selection, correlation analysis was performed on all feature combinations and highly correlated features were removed (above 80%). Using Principle Component Analysis provided strong evidence for the features illustrated in Table 2.
5.1.3 Synthetic minority over-sampling
In a two class balanced dataset the prior probabilities will be equal for each class. This is not the case for the TPEHG dataset as there are 262 true negatives (term majority class) and 38 true positive values (preterm minority class). Classifiers are more sensitive to detecting the majority class and less sensitive to the minority class. This leads to biased classification [1]. Therefore, given a random sample taken from the dataset, the probability of a classifier classifying a pregnant woman as term will be much higher (87.3% - 262/300) compared with
the probability of classifying a pregnant woman as preterm (12.6% - 38/300). This imposes a higher cost for misclassifying the minority class (predicting that a pregnant woman is likely to deliver full term only to go home and deliver prematurely) than the majority class, (predicting a pregnant woman will deliver preterm only to go deliver at term).
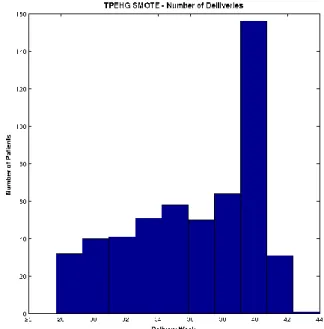
Several studies have shown that the Synthetic Minority Over Sampling Technique (SMOTE) can effectively solve the class skew problem [42]–[48]. Using SMOTE, the minority class (preterm) is oversampled using each minority class record, in order to generate new synthetic records along line segments joining the k minority class nearest neighbours. This forces the decision region of the minority class to become more general and ensures that the classifier creates larger and less specific decision regions, rather than smaller specific regions. In [49], the authors indicated that this approach is an accepted technique for solving the problems related to unbalanced datasets. Figure 2 shows the distribution of term and preterm records, using the SMOTE technique.
Figure 2: Distribution of deliveries in TPEHG dataset after the SMOTE technique is applied Figure 2 shows that using the SMOTE technique allows the term and preterm records to be more balanced, compared with the original TPEHG distribution shown in Figure 1.
While not idea, the justification for using an oversampling technique, resides in the fact that the TPEHG dataset does not have enough preterm observations. More importantly, the majority term observations significantly outnumber preterm observations. The dataset was initially down sampled resulting in a dataset that contained 38 term and 38 preterm. However, the results produced by the classifiers was little better than chance. Oversampling the minority observations produced better results as can be seen in this study. There are many techniques for oversampling data, however, the capabilities of SMOTE is well documented in the literature as a viable technique for achieving this.
5.1.4 Classification
This study evaluates the use of seven advanced artificial neural network classifiers. These are the Back-Propagation Trained Feed-Forward Neural Network Classifier (BPXNC),
Linear Classifier (PERLC), Radial Basis Function Neural Network Classifier (RBNC), Random Neural Network Classifier (RNNC), Voted Perceptron Classifier (VPC) and the Discriminative Restricted Boltzmann Classifier (DRBMC) [50].
The experimental configuration for both the BPXNC and the LMNC classifiers used one hidden layer. Our extensive experiments indicated that five hidden units were a suitable number of hidden units using the Logistic sigmoid activation function. For the PERLC classifier, the number of iterations was set to 100 and the learning rate was 0.1. The weights, as affine mappings, were randomly initialised and updated sequentially. In the case of the RBNC and RNNC classifiers, one hidden layer was used with 60 hidden units. For the VPC classifier, 10 sweeps were performed. Finally, the DRBMC was configured using one hidden layer and five hidden units and was trained with L2 regularisation in which the regularization parameter was set to zero.
The PRTools and Matlab Neural Network Toolboxes were utilised for the implementation of the neural network architectures and experiments were run on an Intel Core i7-2670QM (2.2 GHz) with 6G RAM under Windows 7 Professional.
5.1.5 Evaluation Measures
In order to determine the overall accuracy of each of the classifiers several validation techniques have been considered. These include Holdout Cross-validation, K-fold Cross-validation, Sensitivities (proportion of women with preterm activity who test positive), Specificities (proportion of women without preterm activity who test negative), Receiver Operating Curve (ROC) and Area Under the Curve (AUC).
6. EVALUATION
This section presents the classification results for term and preterm delivery records using the TPEHG dataset. The 0.34-1Hz filter on Channel 3 is used with the 80% holdout technique and k-fold cross-validation. The initial evaluation provides a base line for comparison against all subsequent evaluations, considered in this section.
6.1 Results for 0.34-1Hz TPEHG Filter on Channel 3
The performance for each classifier is evaluated, using the sensitivity, specificity, mean error,
standard deviation and AUC values with 100 simulations and randomly selected training and testing sets for each simulation.
6.1.1 Classifier Performance
The first evaluation uses the original TPEHG dataset (38 preterm and 262 term). Table 3, illustrates the mean average values obtained over 100 simulations for the sensitivity,
specificity, and AUC.
Sensitivity Specificity AUC
Classifier
BPXNC 0.0000 0.9987 54%
LMNC 0.0667 0.9519 58%
RBNC 0.1286 0.9622 56%
RNNC 0.0667 0.9474 56%
VPC 0.0000 1.0000 50%
DRBMC 0.0000 0.9981 58%
Table 3: Classifier Performance Results for the 0.34-1Hz Filter
Table 3 shows that the sensitivities (preterm), in this initial test, are low for all classifiers. This is expected because there are a limited number of preterm records from which the classifiers can learn. Consequently, specificities are higher than sensitivities. More specifically, there are 31 preterm records in the 80% holdout training set. This is a limited number of records for the classifier to learn from. Furthermore, the AUC indicates that all classifiers failed to generate results higher than 58%. Table 4 shows the results for k-fold
cross-validation.
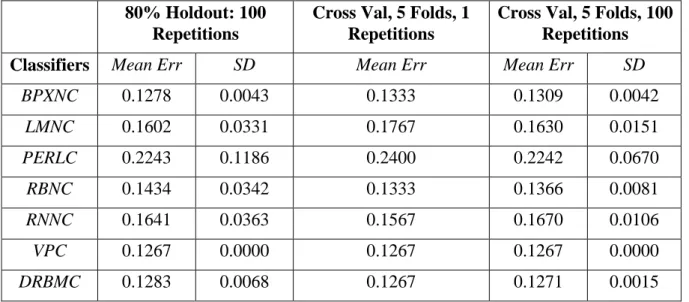
80% Holdout: 100 Repetitions
Cross Val, 5 Folds, 1 Repetitions
Cross Val, 5 Folds, 100 Repetitions
Classifiers Mean Err SD Mean Err Mean Err SD
BPXNC 0.1278 0.0043 0.1333 0.1309 0.0042 LMNC 0.1602 0.0331 0.1767 0.1630 0.0151 PERLC 0.2243 0.1186 0.2400 0.2242 0.0670 RBNC 0.1434 0.0342 0.1333 0.1366 0.0081 RNNC 0.1641 0.0363 0.1567 0.1670 0.0106 VPC 0.1267 0.0000 0.1267 0.1267 0.0000 DRBMC 0.1283 0.0068 0.1267 0.1271 0.0015
Table 4: Cross Validation Results for the 0.34-1Hz Filter
The k-fold cross-validation results use five folds and both one and one hundred repetitions and show that the k-fold cross-validation approach does not improve the error rates for most of the classifiers. The lowest error rates could not be improved below the minimum error rate expected, which is 12.67% (38 preterm/300 deliveries).
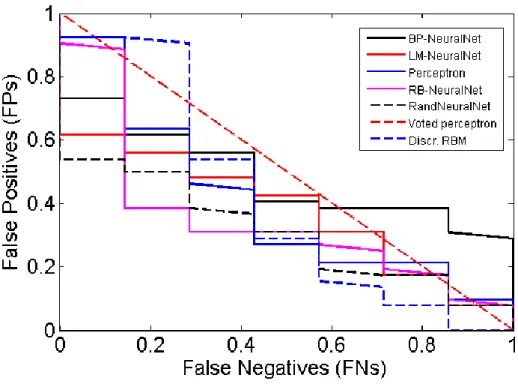
6.1.2 Model Selection
The Receiver Operator Characteristic (ROC) curve shows the cut-off values for the false negative and false positive rates. Each of the classifiers is represented using the original signals from the TPEHG dataset filtered between 0.34-1Hz. Figure 4 indicates that none of the classifiers performed particularly well. The AUC values in Table 4 support these findings with very low accuracy values.
Figure 4: Received Operator Curve for the 0.34-1Hz Filter
The poor results indicate that the classification algorithms do not have enough preterm
records to learn from, in comparison to term records. Consequently, sensitivities are low while specificities are high, which in this study are of lower importance. The main issue, in terms of machine learning, is that the dataset is skewed. Although this problem has not been widely reported in many recent EHG studies, imbalanced data is a common machine-learning problem. As such, re-sampling the classes (with the minority class – in this instance preterm
records) is a conventional way to balance the dataset [38].
6.2 Results for 0.34-1Hz TPEHG Filter on Channel 3 Oversampled
The 38 preterm records are re-sampled using the SMOTE technique. The SMOTE algorithm allows a new dataset to be generated that contains an even split between term and preterm
records (262 each) that has been oversampled using the original preterm records.
6.2.1 Classifier Performance
Table 5 illustrates the mean average values obtained over 100 simulations for the sensitivity,
specificity, and AUC. As it can be seen, the sensitivities, for all of the algorithms, have significantly improved, while specificities have decreased. In addition, the AUC results also show a significant improvement in accuracy for all of the classifiers. In particular, the LMNC
has dramatically improved with an accuracy of 94%.
Sensitivity Specificity AUC
Classifier
BPXNC 0.8058 0.6269 77%
LMNC 0.9256 0.8763 94%
RBNC 0.7705 0.8872 91%
RNNC 0.8699 0.7083 84%
VPC 1.0000 0.0000 50%
DRBMC 0.5929 0.5622 58%
Table 5: Classifier Performance Results for the 0.34-1Hz Filter
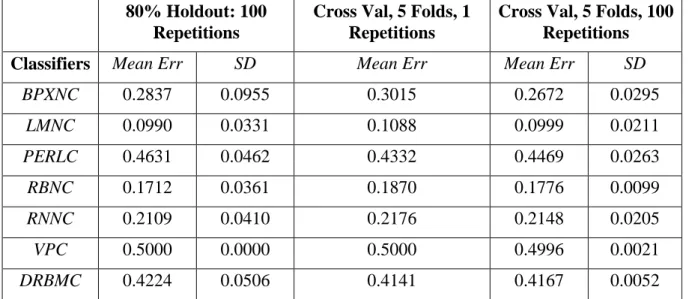
Table 6 illustrates the resulting mean error rates of the oversampled dataset. As it can be seen, the mean error rates, produced by all of the classifiers, are lower than the cross-validation mean errors and the expected error rate, which is 262/524, i.e. 50 %. The LMNC
produced a mean error of 9.90%, followed by the RBNC classifier with a mean error of 17.12%.
80% Holdout: 100 Repetitions
Cross Val, 5 Folds, 1 Repetitions
Cross Val, 5 Folds, 100 Repetitions
Classifiers Mean Err SD Mean Err Mean Err SD
BPXNC 0.2837 0.0955 0.3015 0.2672 0.0295 LMNC 0.0990 0.0331 0.1088 0.0999 0.0211 PERLC 0.4631 0.0462 0.4332 0.4469 0.0263 RBNC 0.1712 0.0361 0.1870 0.1776 0.0099 RNNC 0.2109 0.0410 0.2176 0.2148 0.0205 VPC 0.5000 0.0000 0.5000 0.4996 0.0021 DRBMC 0.4224 0.0506 0.4141 0.4167 0.0052
Table 6: Cross Validation Results for the 0.34-1Hz Filter
The k-fold cross-validation results, using five folds and both one and one hundred repetitions show that the k-fold cross-validation approach improved the error rates, for some classifiers. Furthermore, the lowest error rates are significantly lower than the expected 50% error rate for several of the classifiers.
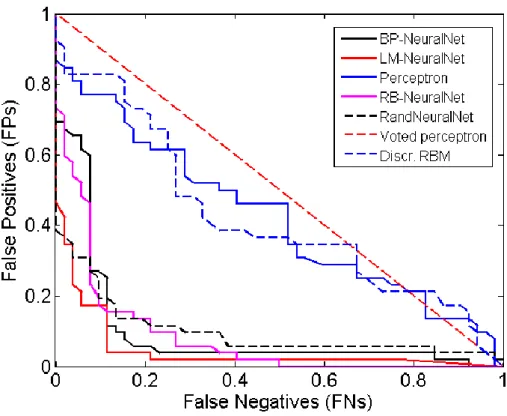
6.2.2 Model Selection
Again, the ROC curve (see Figure 5) illustrates the cut-off values for the false-negative and false-positive rates. Compared to Figure 4, there is a noticeable improvement in the accuracy of several classifiers. The values in Table 5 support these findings with the LMNC, RBNC and the RNNC producing the highest AUC, Sensitivity, and Specificity values.
Figure 5: Received Operator Curve for the 0.34-1Hz Filter
The results illustrate that using machine learning techniques are encouraging. Within a wider context, this approach could utilise real-life pregnancy data to predict, with high confidence, whether an expectant mother is likely to have a premature birth or proceed to full term.
7. DISCUSSION
The study in this paper has focused on discriminating between preterm and term EHG records across a group of 300 subjects. The classifiers are trained using 300 patients, and therefore, classification is generalised across the whole population in the TPEHG database. To achieve this, features from the raw EHG signals were used. In the initial classification results, all the features were used from the original unbalanced dataset (38 term and 262 preterm). This approach produced relatively poor results, with the LMNC classifier producing the best results, with 6.67% for Sensitivity, 95.19% for Specificity, 58% for the AUC, and a 16.02% global error. These results are expected given that machine-learning algorithms do not perform particularly well on unbalanced datasets. The classifiers were simply classifying by minimising the probability of error, in the absence of sufficient evidence to help them to classify otherwise. It appeared as though most of the classifiers were classifying according to the prior probabilities of the classes, in order to minimise the error.
Using and oversampled version of the dataset, improvements have been noticed in all of the classifiers with particularly good results achieved by the LMNC and RBNC classifiers, with accuracies of 94% and 91% respectively. The MLP network trained by the Levenberg-Marquartdt classifier produced the best results with 94%. This training algorithm approximates Newton’s method of least squares optimization and is an efficient learning algorithm, especially when applied to neural networks that have a few hundred weights. However, the efficiency of the algorithm is compromised by high computational
requirements. In the case of the RBNC network, the good results produced can be directly attributed to the properties of this kind of network, which is an effective multi-dimensional structure that can provide an alternative to polynomial values.
The simulation results have also shown that the random neural network’s ability to classify
term and preterm records is good, with an accuracy of 84%. This is a recurrent neural network model, which is inspired by the spiking behaviour of biological neuronal networks. As the problem domain of this paper is related to classification, rather than prediction, the use of recurring links has no effect on the decision of the classification. Hence, we believe that the RNNC did not generate the highest classification values. This is despite the fact that random neural networks are universal approximators for bounded continuous functions. The results also indicate that the SMOTE oversampling algorithm did not significantly affect the accuracy of the DRBMC or VPC classifiers. This is reasonable since DRBMCs are usually used for feature extraction and initialization procedures for other neural networks architectures rather than standalone classifiers.
A concluding remark to note from the results is that while 80% holdout classification does produce smaller errors than cross-validation, the average error increases for almost all of the classifiers. In addition, using SMOTE the minimum error (LMNC classifier) decreased (from 16.2% to 9.90%), but the variance increased. This is equivalent to saying that the uncertainty of classifiers is increased.
8. CONCLUSIONS AND FUTURE WORK
Within a supervised-learning paradigm, this paper utilises EHG signals to classify term and
preterm records. Most of the previous work in this area has focused on detecting preterm activity. In this paper however, the focus has been on assessing the use of artificial neural networks for ambulatory monitoring of patients with an unclear diagnosis and underlying problems that manifest as preterm activity using uterine electromyography data.
A rigorous, methodical, approach to data pre-processing was undertaken and features were extracted from the raw EHG signals using several formal feature extraction techniques. In the first evaluation, the feature space extracted from the original TPEHG dataset was used to train seven classifiers. The highest AUC value of 58% was obtained by the LMNC and DRBMC classifiers, with very low sensitivity and very high specificity values. In the secondevaluation, oversampling the minority class allowed the distribution between the two classes (term and
preterm) to be more balanced. This technique significantly improved the results, with a maximum AUC value of 94%, a sensitivity value of 92.56%, a specificity value of 87.63%, and a global error of 9.9% was achieved.
Despite these encouraging results, more in-depth research is still required. For example, regression analysis, using a larger number of classes, would be interesting. This would help to predict the expected delivery, in terms of the number of days or weeks, not just whether a woman is likely to deliver term or preterm. In addition, more advanced classification algorithms, and techniques, will be considered, including advanced Artificial Neural Network architectures, such as higher order and spiking neural networks. The investigation, and comparison, of features, such as fractal dimension and cepstrum analysis, autocorrelation zero crossing and correlation dimension, has also not been performed. Future work will investigate these techniques in a head-to-head comparison, with linear methods.
Overall, the study demonstrates that artificial neural network classification algorithms provide an interesting line of enquiry for separating term and preterm delivery records.
REFERENCES
[1] WHO, “Born too soon: The Global Action Report on Preterm Birth,” 2012.
[2] P. N. Baker and L. Kenny, Obstetrics by Ten Teachers, 19th ed. Hodder Arnold, 2011, p. 436.
[3] A. Greenough, “Long Term Respiratory Outcomes of very Premature Birth (<32 weeks),” Semin Fetal Neonatal Med., vol. 17, no. 2, pp. 73–76, 2012.
[4] L. J. Mangham, S. Petrou, L. W. Doyle, E. S. Draper, and N. Marlow, “The Cost of Preterm Birth Throughout Childhood in England and Wales,” Pediatrics2, vol. 123, no. 2, pp. 312–327, 2009.
[5] R. Rattihalli, L. Smith, and D. Field, “Prevention of preterm births: are we looking in the wrong place?,” Ed. Arch. Dis. childhood. Fetal an dneonatal, vol. 97, no. 3, pp. 160–1, 2012.
[6] R. L. Goldenberg, J. F. Culhane, J. D. Iams, and R. Romero, “Epidemiology and causes of preterm birth,” Lancet, vol. 371, no. 9606, pp. 75–84, 2008.
[7] M. Doret, “Uterine Electromyograpy Characteristics for early Diagnosis of
Mifepristone-induced Preterm Labour,” Obstet. Gynecol., vol. 105, no. 4, pp. 822–30, 2005.
[8] B. Moslem, M. Khalil, M. O. Diab, A. Chkeir, and C. Marque, “A Multisensor Data Fusion Approach for Improving the Classification Accuracy of Uterine EMG Signals,” in Electronics, Circuits and Systems (ICECS), 2011 18th IEEE International
Conference on 11th-14th Dec, 2011, no. Mv, pp. 93–96.
[9] B. Moslem, M. Khalil, M. O. Diab, and C. Marque, “Classification of multichannel uterine EMG signals by using a weighted majority voting decision fusion rule,” in
2012 16th IEEE Mediterranean Electrotechnical Conference - 25th-28th March, 2012, pp. 331–334.
[10] B. Moslem, M. Khalil, and M. Diab, “Combining multiple support vector machines for boosting the classification accuracy of uterine EMG signals,” in Electronics, Circuits and Systems (ICECS), 2011 18th IEEE International Conference on 11th-14th Dec, 2011, no. Mv, pp. 631–634.
[11] B. Moslem, B. Karlsson, M. O. Diab, M. Khalil, and C. Marque, “Classification Performance of the Frequency-Related Parameters Derived from Uterine EMG Signals,” in International Conference of the IEEE Engineering in Medicine and Biology Society, 2011, pp. 3371–4.
[12] B. Moslem, M. O. Diab, M. Khalil, and C. Marque, “Classification of multichannel uterine EMG signals by using unsupervised competitive learning,” in IEEE Workshop on Signal Processing Systems, 2011, pp. 267–272.
[13] B. Moslem, M. O. Diab, C. Marque, and M. Khalil, “Classification of multichannel Uterine EMG Signals,” in IEEE International Conference on Engineering in Medicine and Biology Society, 2011, pp. 2602–5.
[14] C. Rabotti, M. Mischi, S. G. Oei, and J. W. M. Bergmans, “Noninvasive estimation of the electrohysterographic action-potential conduction velocity.,” IEEE Trans. Biomed. Eng., vol. 57, no. 9, pp. 2178–87, 2010.
[15] C. Buhimschi, M. B. Boyle, and R. E. Garfield, “Electrical activity of the human uterus during pregnancy as recorded from the abdominal surface,” Obstet. Gynecol., vol. 90, no. 1, pp. 102–111, 1997.
[16] W. J. Lammers, “The Electrical Activities of the Uterus During Pregnancy,” Reprod. Sci., vol. 20, no. 2, pp. 182–9, 2013.
[17] R. E. Garfield and W. L. Maner, “Physiology and Electrical Activity of Uterine Contractions,” Semin. Cell Dev. Biol., vol. 18, no. 3, pp. 289–95, 2007.
[18] J. Gondry, C. Marque, J. Duchene, and D. Cabrol, “Electrohysterography during Pregnancy: Preliminary Report,” Biomed. Instrum. Technol. Adv. Med. Instrum., vol. 27, no. 4, pp. 318–324, 1993.
[19] M. Lucovnik, W. L. Maner, L. R. Chambliss, R. Blumrick, J. Balducci, Z. Novak-Antolic, and R. E. Garfield, “Noninvasive uterine electromyography for prediction of preterm delivery.,” Am. J. Obstet. Gynecol., vol. 204, no. 3, pp. 228.e1–10, Mar. 2011. [20] H. Leman, C. Marque, and J. Gondry, “Use of the electrohysterogram signal for
characterization of contractions during pregnancy.,” IEEE Trans. Biomed. Eng., vol. 46, no. 10, pp. 1222–9, Oct. 1999.
[21] I. Verdenik, M. Pajntar, and B. Leskosek, “Uterine electrical activity as predictor of preterm birth in women with preterm contractions.,” Eur. J. Obstet. Gynecol. Reprod. Biol., vol. 95, no. 2, pp. 149–53, Apr. 2001.
[22] W. L. Maner, R. E. Garfield, H. Maul, G. Olson, and G. Saade, “Predicting term and preterm delivery with transabdominal uterine electromyography,” Obstet. Gynecol., vol. 101, no. 6, pp. 1254–1260, Jun. 2003.
[23] C. K. Marque, J. Terrien, S. Rihana, and G. Germain, “Preterm labour detection by use of a biophysical marker: the uterine electrical activity.,” BMC Pregnancy Childbirth, vol. 7 Suppl 1, p. S5, Jan. 2007.
[24] W. L. Maner and R. E. Garfield, “Identification of human term and preterm labor using artificial neural networks on uterine electromyography data.,” Ann. Biomed. Eng., vol. 35, no. 3, pp. 465–73, Mar. 2007.
[25] M. P. G. . M. P. G. C. Vinken, C. Rabotti, M. Mischi, and S. G. Oei, “Accuracy of frequency-related parameters of the electrohysterogram for predicting preterm delivery.,” Obstet. Gynecol. Surv., vol. 64, no. 8, p. 529, Feb. 2009.
[26] C. Buhimschi, M. B. Boyle, G. R. Saade, and R. E. Garfield, “Uterine activity during pregnancy and labor assessed by simultaneous recordings from the myometrium and abdominal surface in the rat.,” Am. J. Obstet. Gynecol., vol. 178, no. 4, pp. 811–22, Apr. 1998.
[27] R. E. Garfiled, W. L. Maner, H. Maul, and G. R. Saade, “Use of Uterine EMG and cerical LIF in Monitoring Pregnant Patients,” BJOG An Int. J. Obstet. Gynaecol., vol. 112, pp. 103–8, 2005.
[28] G. Fele-Žorž, G. Kavšek, Z. Novak-Antolič, and F. Jager, “A comparison of various linear and non-linear signal processing techniques to separate uterine EMG records of term and pre-term delivery groups.,” Med. Biol. Eng. Comput., vol. 46, no. 9, pp. 911– 22, Sep. 2008.
[29] C. Buhimschi and R. E. Garfield, “Uterine contractility as assessed by abdominal surface recording of electromyographic activity in rats during pregnancy.,” Am. J. Obstet. Gynecol., vol. 174, no. 2, pp. 744–53, Feb. 1996.
[30] M. Hassan, J. Terrien, C. Marque, and B. Karlsson, “Comparison between
Approximate Entropy, Correntropy and Time Reversibility: Application to Uterine Electromyogram Signals,” Med. Eng. Phys., vol. 33, no. 8, pp. 980–6, 2011. [31] J. S. Richman and J. R. Moorman, “Physiological time-series analysis using
approximate entropy and sample entropy,” Am. J. Physiol. - Hear. Circ. Physiol., vol. 278: H2039, no. 6, 2000.
[32] A. Phinyomark, P. Phukpattaranont, and C. Limsakul, “Feature Reduction and
Selection for EMG Signal Classification,” Expert Syst. Appl., vol. 39, no. 8, pp. 7420– 7431, 2012.
[33] C. J. Miller, “Real-Time Feature Extraction and Classification of Prehensile EMG Signals,” 2008.
[34] E. Charniak, “Bayesian Networks without Tears,” AI Mag., vol. 12, no. 4, pp. 50–63, 1991.
[35] S. Baghamoradi, M. Naji, and H. Aryadoost, “Evaluation of cepstral analysis of EHG signals to prediction of preterm labor,” in 18th Iranian Conference on Biomedical Engineering, 2011, no. December, pp. 1–3.
[36] H. Al-Askar, L. Moores, and B. Street, “The Application of Self-Organised Network Inspired by Immune Algorithm for Prediction of Preterm Deliveries from EHG Signals,” cms.livjm.ac.uk, 2013.
[37] M. O. Diab, C. Marque, and M. A. Khalil, “Classification for Uterine EMG Signals : Comparison Between AR Model and Statistical Classification Method,” Int. J. Comput. Cogn., vol. 5, no. 1, pp. 8–14, 2007.
[38] L. Tong, Y. Change, and S. Lin, “Determining the optimal re-sampling strategy for a classification model with imbalanced data using design of experiments and response surface methodologies,” Expert Syst. Appl., vol. 38, no. 4, pp. 4222–4227, 2011. [39] C. L. and P. P. Angkoon Phinyomark, “A Novel Feature Extraction for Robust EMG
Pattern Recognition,” J. Comput., vol. 1, no. 1, pp. 71–79, 2009.
[40] C. L. Phinyomark, A. Nuidod, P.Phukpattaranont, “Feature Extraction and Reduction of Wavelet Transform Coefficients for EMG Pattern Classification.,” Electron. Electr. Eng., vol. 6, no. 6, 2012.
[41] G. Fele-Zorz, G. Kavsek, Z. Novak-Antolic, and F. Jager, “A comparison of various linear and non-linear signal processing techniques to separate uterine EMG records of term and pre-term delivery groups.,” Med. Biol. Eng. Comput., vol. 46, no. 9, pp. 911– 22, Sep. 2008.
[42] L. M. Taft, R. S. Evans, C. r. Shyu, M. J. Egger, N. Chawla, J. A. Mitchell, S. N. Thornton, B. Bray, and M. Varner, “Countering imbalanced datasets to improve adverse drug event predictive models in labor and delivery,” J. Biomed. Informatics2, vol. 42, no. 2, pp. 356–364, 9AD.
[43] T. Sun, R. Zhang, J. Wang, X. Li, and X. Guo, “Computer-Aided Diagnosis for Early-Stage Lung Cancer Based on Longitudinal and Balanced Data,” PLoS One, vol. 8, no. 5, p. e63559, 2013.
[44] W. Lin and J. J. Chen, “Class-imbalanced classifiers for high-dimensional data,” Brief. Bioinform., vol. 14, no. 1, pp. 13–26, 2013.
[45] T. Sun, R. Zhang, J. Wang, X. Li, and X. Guo, “Computer-Aided Diagnosis for Early-Stage Lung Cancer Based on Longitudal and Balanced Data,” PLoS One, vol. 8, no. 5, p. e63559, 2013.
[46] J. Nahar, T. Imam, K. S. Tickle, A. B. M. Shawkat Ali, and Y. P. Chen,
“Computational Intelligence for Microarray Data and Biomedical Image Analysis for the Early Diagnosis of Breast Cancer,” Expert Syst. Appl., vol. 39, no. 16, pp. 12371– 12377, 2012.
[47] R. Blagus and L. Lusa, “SMOTE for High-Dimensional Class-Imbalanced Data,” BMC Bioinformatics, vol. 14, no. 106, 2013.
[48] Y. Wang, M. Simon, P. Bonde, B. U. Harris, J. J. Teuteberg, R. L. Kormos, and J. F. Antaki, “Prognosis of Right Ventricular Failure in Patients with Left Ventricular Assist Device Based on Decision Tree with SMOTE,” Trans. Inf. Technol. Biomed., vol. 16, no. 3, 2012.
[49] N. V. Chawla, K. W. Bowyer, L. O. Hall, and W. P. Kegelmeyer, “SMOTE: Synthetic Minority Over-Sampling Technique,” J. Artif. Intell. Res., vol. 16, no. 1, pp. 321–357, 2002.