University of Nebraska - Lincoln
DigitalCommons@University of Nebraska - Lincoln
P. F. (Paul Frazer) Williams Publications
Electrical Engineering, Department of
2-1-1993
Using Spreadsheets to Teach Problem Solving in a
First Year Class
A. John Boye
IEEE
P. F. Williams
University of Nebraska - Lincoln
, [email protected]
Rodney J. Soukup
IEEE
This Article is brought to you for free and open access by the Electrical Engineering, Department of at DigitalCommons@University of Nebraska -Lincoln. It has been accepted for inclusion in P. F. (Paul Frazer) Williams Publications by an authorized administrator of DigitalCommons@University of Nebraska - Lincoln. For more information, please [email protected].
Boye, A. John; Williams, P. F.; and Soukup, Rodney J., "Using Spreadsheets to Teach Problem Solving in a First Year Class" (1993).P. F. (Paul Frazer) Williams Publications.Paper 11.
68 lEEE TRANSACTIONS ON EDUCATION. VOL. 36, NO. I , FEBRUARY 1993
Mary Jo Drozdowski (M’92) was born in Newport News, VA, in 1970, and received the B.S.E.E. degree from the U S . Air Force Academy, in 1992.
As an undergraduate, her work included research in neural networks for robust speech recognition. Her current areas of interest are speech recognition and computer engineering. She is presently pursuing a Masters degree at George Washington University, Washington, D.C., and working at Goddard Space Center, Washington, D.C.
Terry S. Duncan (M’92) was born in Cadiz, KY, in 1970, and received the B.S.E.E. degree from the U. S. Air Force Academy, in 1992.
As an undergraduate his work included develop- ment of a prototype system to be used in an ad- vanced undergraduate microprocessor design course at the Air Force Academy. His current area of interest is computer engineering. He is presently pursuing a Masters degree at George Washington University, Washington, D.C., and working at God- dard Space Center, Washington, D.C.
Using Spreadsheets to Teach Problem
Solving in a First Year Class
A. John Boye, Member, IEEE, P. Frazer Williams, and Rodney
J. Soukup,
Senior Member, IEEEAbstract- The “problem solving” portion of a two semester first year electrical engineering conrse is described. This course makes use of personal computers and spreadsheets to try to improve students’ problem solving skills. The goal is to give students a better understanding of engineering concepts and not just mathematical details. In addition to describing the course contents, a brief review of the rationale that was used in selecting the hardware and software used in the course is also given.
I. INTRODUCTION
HERE is often a tendency in teaching electrical en-
T
gineering to emphasize the mathematical statement of the problem and the steps required to obtain a mathedtical solution. This leads to students getting lost in the mathemat- ical details. They usually can perform the calculations, but do not have a very good understanding of the underlying concepts. They often do not make the connection between the mathematical statement and the actual engineering problem, nor between the mathematical solution and what is actually happening. In addition, students often have a hard time setting up a problem and determining what is necessary to solve it, unless the problem is already given in a mathematical form.We have introduced a two semester first year course to help students overcome this lack of understanding. About one half of this course involves teaching basic digital logic circuits, introducing the fundamentals of computer architecture, and introducing the C programming language. However, the other half makes use of personal computers and spreadsheets to try to improve students’ problem solving skills. It is this part of the course that is the subject of this paper. It is felt that if students are able to simulate an engineering problem easily, they will be more likely to vary different parameters and see the effects
Manuscript received June 1992.
The authors are with the Department of Electrical Engineering, University IEEE Log Number 9202854.
of Nebraska, Lincoln, NE 68588-05 11,
of changing them. Normally this would not be possible with tedious “hand solved” cases. This would help give students a better understanding of the actual concepts and help them make the connections between the mathematical statement of the problem and the concepts.
Sections I1 and 111 overview some of the rationale that was used in selecting the hardware (personal computers, workstations, or mainframes) and software. Advantages and disadvantages of each are given. Section IV gives a detailed spreadsheet example of one of the problems used in this course. Section V overviews some of the other types of problems used. Conclusions are given in Section VI.
11. SELECTlON OF HARDWARE [I]
A . Mainframes or Supermini Computers
The first issue that needs to be resolved, is the type of com- puter to use. Available at most universities is the mainframe or supermini computer. These have several advantages. They are able to handle large amounts of data and large programs easily and quickly. They are usually available to all students at no additional cost to the student and can be accessed from their home or room by means of a modem. In addition, since most schools already own such machines, there is little additional expense needed for their purchase, unless it is necessary to purchase additional terminals due to a higher student load.
However, there are some disadvantages with mainframes. They are only available for the students if they are allocated time and space on the machine. At many universities, the machines are not available to students unless they are taking a particular course. This precludes a student not taking the class from using the machine on his or her own. Upkeep and the purchase of software for mainframes is also fairly expensive. In addition, good graphic terminals are scarce and costly.
I
IEEE TRANSACTIONS ON EDUCATION, VOL. 36, NO. I. FEBRUARY 1993 69
B. Personal Computers
Many students can afford their own personal computers and software. As noted in [ 2 ] an estimated 25% of electrical engineering students own their own personal computer, and this percentage is expected to increase. With students having their own system readily available, they can (and usually do) use their equipment more often to simulate and illus- trate various problems. Personal computers also have very good graphic capabilities, compared with mainframes. Good graphics are especially necessary when it comes to problem solving. However, a disadvantage of personal computers is that they are limited in the size of the program and the data that they can handle. Speed may also be a problem, especially for large problems or those dealing with a large amount of data. However, this is not usually a major issue for most introductory educational examples and problems like those for this course. The relatively cheap cost, availability, and good graphic capabilities were the main reasons why we decided to use personal computers for this course.
C. Workstations
Currently, many universities are beginning to purchase workstations for use by students. These have some advan- tages of both mainframes and personal computers. As with mainframes, they are able to handle a large number of data, or large programs, easily and quickly. In addition, they have very powerful graphic capabilities. The main disadvantage of workstations, at least at present, is the cost for hardware and software.
111. SELECTION OF SOFTWARE
In this first year course, it was decided to use a spreadsheet program for a number of reasons [3]. Spreadsheets are easy to learn and simple to use. Advanced programming skills are not necessary and the student is less likely to get lost in the details of programming, because they were developed originally for use by people who have little or no interest in the operation of the software. Therefore, unlike high level languages, little start-up time is necessary to become fairly proficient with their use. Spreadsheets are also very versatile. Originally written for business applications, they have proven to be invaluable in solving engineering problems. They can handle quite complicated formulas and equations. Built-in functions include not only mathematical functions, but logical, statistical, and matrix operations as well. One of the main advantages of spreadsheets is their ability to make graphs easily and quickly. This is perhaps the main advantage of using spreadsheets and personal computers, and students seem to appreciate it. Finally, spreadsheets can show the effect of changing different variables on equations or graphs almost instantly. The use of this “what i f ’ capability greatly enhances the understanding of a particular problem and is something that probably would not be done, since it is otherwise very time consuming. The main disadvantages of spreadsheets are connected with the disadvantages of the hardware, namely the size of the problem that can be handled and the speed of calculation. Also the spreadsheet paradigm is not very
well suited to some types of problems. But, again, for most introductory examples and problems, this should not be a major issue. There is a large variety of good, reasonably priced, spreadsheet software available. We decided to use Borland’s Quattro Pro (tm) mainly because of the ease of use, inexpensive price, and good graphics capabilities.
IV. AN EXAMPLE
There have been a number of reports of the use of spreadsheets to teach various subjects in electrical engineering [4]-[6]. It is the purpose of our course merely to use the spreadsheet as a tool for helping students to get an understanding and insight into the art of problem solving. The course begins with first teaching the student the fundamentals of spreadsheet operation. The layout of the spreadsheet is discussed, and the students are taught how to enter information into a worksheet, how to save and retrieve worksheets, and how to edit contents of cells to fix mistakes. A specific problem is then given, and the spreadsheet is used to solve it several times, with increasing sophistication each time. During this process a number of other spreadsheet capabilities are covered. This problem is as follows:
A table containing “measured” values for current- voltage pairs for a box is provided. The measured data are known to contain random noise, and it is possible that one or two points are simply wrong. The student is told that the voltage and current are ex- pected to be related by an equation of the form
V = A
+
B I , where A andB
are constants. Theproblem is first to see if the measured data do in fact follow such a law, and, if so, to determine the best values for A and B [3].
The student is then taught how to obtain graphs on the spreadsheet. He or she then plots the data. It is fairly clear that the data fell nearly on a straight line, except for one obviously different point. This illustrates the difference between tabular and graphical representation of data quite well.
Next, the values for A and B are obtained. This is done in three ways. First, the linear equation V = A + B I is plotted on the same graph as the data. Then A and B are varied manually until a best appearing fit to the data is obtained. To do this, some parts of the worksheet need to be moved around, so the discussion is interrupted to explain how to do that.
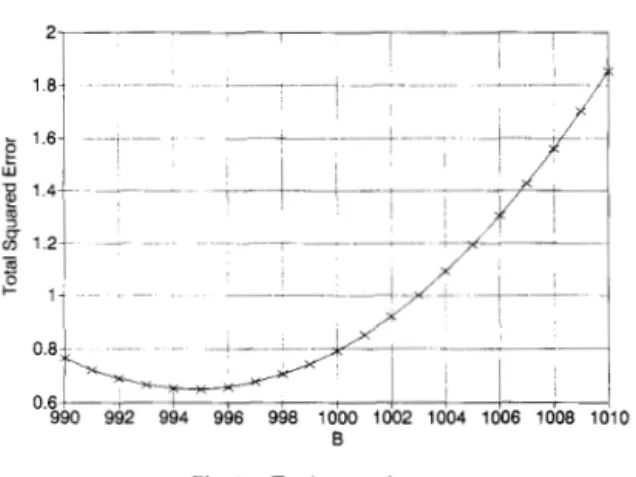
Second, the ideal of a squared deviation is introduced, and the worksheet is modified to calculate the total squared de- viation of the “theoretical” and measured values. The constants
A and B are manually varied in an attempt to minimize the total deviation. The process is automated somewhat by providing the student with a macro to automatically calculate the deviations for a range of values of either A or B . Using the macro, and a guessed value for one of the constants, say A,
the student makes a table of error versus the other constant,
B.
This table is graphed, and the presence of a minimum noted. Using the best value for B , the table of error versus A is then created and graphed, providing a best value for A . The process is iterated several times until the best values of A and B have converged sufficiently. Fig. 1 shows a typical graph70 IEEE TRANSACTIONS ON EDUCATION, VOL. 36, NO. 1, FEBRUARY 1993 2, I I 0 8; I 0 6 7 , ~, , ; , 1 1 , 990 992 994 996 998 1000 1002 1004 1006 1008 1010 0 8; I 0 6 7 , ~, , ; , 1 1 , 990 992 994 996 998 1000 1002 1004 1006 1008 1010 B
Fig. 1. Total squared error.
of error versus
B.
This makes it easier to find the value which minimize the deviation. It is pointed out to the student that the graphs of the deviation versus either A or B appear to be parabolas. With this observation, an algebraic relationship for the total deviation as a function of A and B is derived and shown actually to be a parabola.Finally, the student is reminded of a high school algebra result for the position of the extremum of a parabola in terms of the coefficients of the quadratic describing it, and the complete least-squares result is derived. This then can be programmed on the worksheet easily, and compared to the manual results.
V. ADDITIONAL TOPICS
Using a similar approach as the above example, a number of other topics are covered. Some of these are outlined below. For more details see [3] and [7].
1) The spreadsheet is used to solve simultaneous linear alge- braic equations in two ways. First, the Gauss-Seidel method is explained and a spreadsheet created to use this method. Second, matrices are introduced along with some basic matrix manipulations. The simultaneous algebraic equations are then put in matrix form and the spreadsheet is used to find the inverse of the matrix as well as the final solution.
2) Problems involving statistical simulations are also pre- sented. The spreadsheet is used to perform the numerical simulations and analytical results are given and compared to the numerical results. This helps give the student a bet- ter understanding of the relationship between numerical and analytical solutions, as well as to show him or her the relative advantages and disadvantages of each.
3 ) The student uses the spreadsheet to reinforce the concept of integration. A problem of estimating the volume of a sphere is approached by dividing the sphere into slices and adding their volumes. Both first-and second-order numerical techniques are used to estimate the volumes of the slices. The spreadsheet allows the student to compare these two techniques as well as to see the effects of various slice widths. Following this investigation, an analytical solution is obtained and the problem is restated as an integral relationship. This allows the student to make the connections between the actual visual problem and the integral relationship.
c
Following this, numerical evaluation of general integrals is discussed, using Euler, rectangular, and trapezoidal methods. With the aid of the spreadsheet the student is able to make comparisons between the different techniques as well as ex- amine the effects of different step sizes on the solutions. The student is then expected to solve a number of problems using numerical integration.
4) The concept of differentiation is also investigated. Ve- locity is calculated from a table of time and distance data, using the spreadsheet. Different approaches are taken such as forward and backward differences and comparisons made. The effects of the stepsize can also be visualized as well. Finally, the problem 7s restated as a derivative relationship, allowing the student to make the connection between the analytical and numerical evaluation of derivatives. The student is assigned problems emphasizing the numerical calculation of derivatives. 5) Extensions of the above two concepts are then made to solving ordinary differential equations. Since most students do not take a course on the topic until the semester of their sophomore year, the concept of differential equations needs to be explained in some detail. A simple first order differential equation is derived from an RC circuit. The analytical solution is obtained in detail. Following this, the equation is solved numerically using the spreadsheet. Euler’s method and a modified Euler’s method are used and compared. The numerical and analytical solutions are also compared.
The process is repeated using a second-order equation derived from an RLC circuit. Only a numerical solution is obtained, although the analytical solution is outlined. After this, the student is expected to be able to solve a number of ordinary differential equations, at least numerically. These in- clude nonhomogeneous and time-variant equations, which are either impossible or extremely difficult to solve analytically. The student finds that these can be solved easily using the numerical methods and the spreadsheet.
VI. CONCLUSIONS
We have described the “problem solving” portion of a two semester first year level course in electrical engineering. Our goal was to teach problem solving by use of the spreadsheet. We found that use of the spreadsheet was a good idea. Most students easily and readily took to its use and teaching the use of the spreadsheet was relatively easy. The difficult part is teaching students to recognize how these tools can be used to solve specific problems. We also found that most students liked the course and found it interesting. It is hoped that these students will be able to apply some of the principles and tools learned to solve problems in the future.
ACKNOWLEDGMENT
The authors wish to express appreciation to the anonymous reviewers for their suggestions.
REFERENCES
(11 A. J. Boye, “Using simulation to teach problem solving in systems and controls classes,” in Proc. Int. Conj Simulation Eng. Educ. -Simulation
IEEE TRANSACTIONS ON EDUCATION, VOL. 36, NO. 1. FEBRUARY 1YY3 71
L. P. Heulsman, “Personal computers in electrical and computer engineer- ing: Education survey,” IEEE Trans Educ., vol. 34, pp. 175-178, May 1991.
A. J. Boye, R. J. Soukup, and P. F. Williams, “Teaching engineering as the science of solving word problems,” in Proc. 1991 ASEE Annual Con f ,
pp. 1267-1271, June 1991.
A. El-Hajj and K . Y . Kabalan, “A spreadsheet simulation of logic networks,” IEEE Trans. Educ., vol. 34, pp. 43-46, Feb. 1991. L. P. Huelsman, “Electrical engineering applications of microcomputer spreadsheet analysis programs,” IEEE Trans. Educ., vol. 27, pp. 86-92, May 1984.
N. D. Rao, “Typical applications of microcomputer spreadsheets to elec- trical engineering problems,” IEEE Trans. Educ., vol. 27, pp. 237-242, Nov. 1984.
A. J. Boye, R. J. Soukup, and P. F. Williams, “Teaching engineering as the science of solving word prohlems-Part 11,” in Proc. 1992 ASEE
Annual Conf., pp. 1534-1537, June 1992.
Rodney J. Soukup (M’73-SM‘79) was born in Montgomery, MN. He received the B.S. (with high distinction), the M.S.E.E., and the Ph.D. degrees from the University of Minnesota, Minneapolis, in 1961, 1964, and 1969, respectively.
From 1969 through 1971 he was Principal Development Engineer at Sperry Randmnivac in Roseville, MN. In 1972, he began his academic career temporarily at the University of Minnesota, Minneapolis and then permanently at the University of Iowa. Iowa City, as Assistant Professor of electrical engineering. He moved to the University of Nebraska, Lincoln, in 1976 as Associate Professor, became Chairman in 1978, and Professor of Electrical Engineering in 1980. His research interests are in thin film solar cells. The paper reported here is a consequence of the third major curriculum change in electrical engineering at the University of Nebraska, Lincoln since he became Chairman.
Dr. Soukup is a member of the Administrative Committee of the IEEE Education Society, a member of the Centennial Committee of the EE Division of ASEE, a member of the Board of Directors of the National Electrical
Engineering Department Heads Association as Past Chairman, the position he held in 1990-1991 and is an ABET reviewer. He has served on the IEEE Educational Activities Board and as the IEEE Education Society representative on the Research Committee. He is also a member of Tau Beta Pi and Eta Kappa Nu and is listed in several Who’s Who Compilations.
P. Frazer Williams received the B.S. degree in Physics from the California Institute of Technology, Pasadena, in 1967, and the Ph.D. degree in electrical engineering from the University of Southern California, Los Angeles, in 1973. His professional experience includes: M. T. S. Bell Laboratories, Murray Hill, NJ; Assistant Professor in the Department of Physics, University of Puerto Rico, Rio Piedras; and Assistant Professor and Associate Professor of Electrical Engineering, and Associate Professor of Physics, Texas Tech. University, Lubbock. He is currently the Lott College Professor of Electrical Engineering at the University of Nebraska-Lincoln. Frazer’s current research interests center around surface flashover of semiconductors, the electrical breakdown of gases, and the numerical modeling of carrier transport in semiconductors and gases. Other interests include resonant and nonresonant Raman scattering from semiconductors and simple molecular gases, and the dielectric response of quasi-one-dimensional conductors. Dr. Frazer has published approximately 50 technical papers.
A. John Boye (S’66- M’71 -S’76- M’79 - M’80) received the B.S., M.S., and Ph.D. degrees in 1968, 1973, and 1984, respectively, from the University of Nebraska-Lincoln, all in electrical engineering. He has worked for Hughes Aircraft Company and has been at the University of Nebraska-Lincoln since 1974, where he is currently an Associate Professor and Assistant Chairman of Electrical Engineering. His research interests are in the area of control systems, especially with the theory and application of nonlinear stochastic systems, system modeling, and optimal control. He is currently involved with the application of neural networks to model reference adaptive control.