Butler University
Digital Commons @ Butler University
Scholarship and Professional Work - Business
Lacy School of Business
2014
Does Beating Cash Flow Benchmarks Reduce the
Cost of Debt?
Mauricio A. Melgarejo
Butler University, [email protected]
Follow this and additional works at:
http://digitalcommons.butler.edu/cob_papers
Part of the
Accounting Commons,
Corporate Finance Commons,
Management Sciences and
Quantitative Methods Commons, and the
Portfolio and Security Analysis Commons
This Article is brought to you for free and open access by the Lacy School of Business at Digital Commons @ Butler University. It has been accepted for inclusion in Scholarship and Professional Work - Business by an authorized administrator of Digital Commons @ Butler University. For more information, please [email protected].
Recommended Citation
Melgarejo, Mauricio A., "Does Beating Cash Flow Benchmarks Reduce the Cost of Debt?" (2014).Scholarship and Professional Work -Business.Paper 274.
* Assistant Professor, INCAE Business School, Managua, Nicaragua, Tel: +(505) 2265-8141 Ext 146 E-mail: [email protected]
The author would like to thank Mark Bagnoli, Susan Watts, workshop participants at Purdue University, and the discussant and participants at the 2009 American Accounting Association annual meeting for their comments and suggestions.
Does beating cash flow benchmarks reduce the cost of debt?
M Melgarejo*
ABSTRACT
This paper examines whether beating previous year cash flow values and analysts’ cash flow forecasts impact the firms’ cost of debt. Creditors are expected to be more concerned about firm solvency than firm profitability. Accordingly, if lenders have any reference point it may be related to cash flow numbers. This study finds that firms that beat analysts’ cash flow forecasts have smaller initial bond yield spreads in the next period and a decrease in their initial bond yield spreads between consecutive periods. This effect is more pronounced at short maturities and for observations with less informative earnings. Firms with lower earnings response coefficients that beat analysts’ cash flow forecasts show a higher probability of a credit rating upgrade.
1. INTRODUCTION*
Several studies have documented that firms tend to meet or beat three particular earnings benchmarks: zero earnings, previous year’s earnings, and analysts’ earnings forecasts. Burgstahler and Dichev (1997) and Degeorge et al. (1999) argue that market participants use these benchmarks in making their investment decisions. Bartov et al. (2002), and Brown and Caylor (2005) find that firms that beat earnings benchmarks enjoy higher returns than firms with similar quarterly earnings forecasts that fail to meet these reference points. Melendrez et al. (2008) present initial evidence that the market rewards a return premium for beating cash flow forecasts. Therefore, it seems that investors use cash flow reference points to evaluate a firm’s current and future performance. Lenders are expected to be more concerned about firm solvency and liquidity than firm’s profitability. Accordingly, if lenders have any reference point or heuristic, it may be related to cash flow values. This paper examines whether beating cash flow benchmarks (previous year cash flow numbers and analysts’ cash flow forecastsi) has an impact on firms’ cost of debt.
In recent years, the accounting literature shows an increase in the number of analysts who disseminate cash flow forecasts. DeFond and Hung (2003) conclude that analysts issue cash flow forecasts when earnings appear to be less informative and to meet investors demand for more value-relevant information. A firm beating last year’s cash flow numbers or analysts’ cash flow forecasts may signal satisfactory operating performance and a safe margin with respect to solvency and liquidity. Whether debt holders and credit rating agencies rely on cash flow benchmarks to evaluate firm solvency and liquidity is an open empirical question.
This paper may prove useful in several ways. First, firms increasingly rely on debt financing. According to the McKinsey Global Institute’s report the size of the global stock market capitalization stood at US$ 54 trillion and the outstanding global debt reached US$ 93 trillion in 2010. It is important to examine the factors affecting bond yields because small changes in bond prices represent large changes in capital allocation Second, bondholders consist mainly of institutional investors who tend to be more sophisticated and have greater access to private information. Thus, learning whether they rely on particular benchmarks to evaluate firm solvency will aid in understanding the institutional investor decision making process. Third, this study may improve our understanding of how debt investors use accounting information and, in particular, the value of cash flow numbers and cash flow forecasts.
2
To address whether beating cash flow reference points impacts a firm’s cost of debt, annual cash flow benchmarks are constructed based on previous year cash flow per share and the consensus (mean) of analysts’ cash flow per share forecasts. Based on prior literature, I use three proxies for a firm’s cost of debt: initial bond yield spread, change in initial bond yield spread, and firm credit rating score. The paper provides evidence that firms that beat analysts’ cash flow forecasts have smaller initial yield spreads next period compared with firms that miss them. These firms also show a decrease in their initial bond yield spreads between consecutive periods. This study also finds that the effects of beating cash flow benchmarks are more pronounced at short maturities and for firms with less informative earnings (firms that have lower earnings response coefficients). Firms that beat analysts’ earnings forecasts have a higher probability of a credit rating upgrade; in this case beating cash flow benchmarks are significant only for firm-year observations with low earnings response coefficients. These findings are consistent with the practice of bond investors and credit rating agencies using cash flow reference points to evaluate information about firms’ solvency, especially when earnings are less informative.
This paper proceeds as follows. Section 2 reviews the literature concerning the motivation to beat accounting reference points and the effects of beating them. It also summarizes the research on cash flow forecasts and the impact of accounting information on the debt market. In this section, I develop the main hypotheses. Section 3 describes this study’s research design. Section 4 presents the sample selection criteria and descriptive statistics of the variables analyzed. Section 5 presents the multivariate results, and Section 6 presents the conclusions.
2. LITERATURE REVIEW AND HYPOTHESES DEVELOPMENT 2.1 Motivation for and effects of beating accounting benchmarks
Burgstahler and Dichev (1997) and Degeorge et al. (1999) report that a disproportionately large number of firms report profits, earnings increases, and positive earnings surprises with reference to analysts’ expectations. It may be inferred that investors, boards of directors, and creditors use earnings benchmarks as reference points to evaluate a firm’s performance and that managers rationally try to meet or beat them. Consistent with this idea, accounting research finds that the stock market rewards firms that beat earnings benchmarks. Bartov et al. (2002) document that after controlling for quarterly forecast errors, firms that beat current analysts’ earnings expectations enjoy a higher return over the quarter than those firms that fail to meet these expectations. Brown and Caylor (2005) provide evidence of positive abnormal returns around quarterly earnings announcements for firms reporting profits and earnings increases and for firms beating analysts’ earnings forecasts. These authors also find that avoiding negative earnings quarterly surprises has become the most important reference point in recent years.
Graham et al. (2005) show that managers regard cash flow as the second most important benchmark that the market uses to evaluate firm performance. Consistent with this evidence, recent studies have documented that, similar to earnings thresholds, a significantly larger number of firms barely beat analysts’ cash flow forecasts. Melendrez et al. (2008) find that the market reacts more strongly to the unexpected cash flow component of earnings compared to the unexpected accrual component of earnings. This risk premium may provide significant incentives for managers to beat cash flow numbers. Investors might use cash flow reference points to evaluate a firm’s current and future performance. Yet there is little evidence regarding whether creditors use cash flow reference points in evaluating firm solvency and liquidity.
3
2.2 Analysts cash flow forecasts
In recent years an increasing number of analysts are issuing cash flow forecasts. Givoly et al. (2009) find that 57% of firms with analysts’ earnings forecasts also have cash flow forecasts by 2005. DeFond and Hung (2003) find that analysts tend to forecast cash flow numbers for firms with larger accruals, more heterogeneous accounting choices relative to industry peers, higher earnings volatility, higher capital intensity, and poorer financial health. They conclude that financial analysts respond to market-based incentives to provide market participants with value-relevant information. They also find that annual earnings have a lower association with 15-month returns among firms with cash flow forecasts, and that stock returns around annual earnings announcement dates for firms with cash flow forecasts are positively associated with cash flow forecast errors but that they are not associated with earnings forecast errors. All their results are consistent with the idea that market participants demand cash flow forecasts when earnings are less relevant to securities valuation.
DeFond and Hung (2007) find that analysts supplement their earnings forecasts with cash flow forecasts in countries where weak investor protection results in earnings data are less useful in the analysis of a firm’s underlying economic performance. Hail (2007) argues that the two main assumptions of DeFond and Huang (2007), that investors’ unsatisfied demand for accounting information and their willingness to rely on cash flow information as an important information signal, are a priori not obvious in an international context. In further analysis, the author tests whether changes in investor protections or earnings quality is related to changes in the frequency of cash flow forecasts. He finds that analysts supplement their earnings forecasts more frequently with cash flow forecasts after a country’s first prosecution under insider trading laws and after non-US firms have cross-listed their shares on a US exchange or when they voluntarily adopt IFRS or US GAAP. When analysts forecast both earnings and cash flow they are implicitly forecasting total operating accruals. This idea is explored by McInnis and Collins (2006), who find that firms with analysts’ earnings and cash flow forecasts exhibit higher accruals quality than firms of similar size, in the same industry and that lack cash flow forecasts. Therefore, analysts’ cash flow forecasts may serve as an effective earnings management constraint and may help improve the quality of financial information provided by managers.
Even though, Givoly et al. (2009) suggest that analysts’ cash flow forecasts appear to be of low quality and in essence may be naïve extensions of earnings forecasts, they further argue that a better understanding of the source of the signaling value associated with the presence of these forecasts is needed. In this line, prior research shows that analysts’ forecasts of earnings are more accurate when accompanied by cash flow forecasts (Call et al., 2009) suggesting that analysts adopt a more structured and disciplined approach to forecasting earnings when they also issue cash flow forecasts.
2.3 Earnings and the debt market
The accounting literature shows that earnings information impacts bond markets. Ziebart and Reiter (1992) find that higher return on assets (ROA) is associated with low bond yields. Datta and Dhillon (1993) find that bondholders appear to react positively to unexpected earnings increases. Further, bond and stock price responses to unexpected earnings announcements are symmetric. Jiang (2008) reports that debt holders and credit rating agencies seem to use earnings benchmarks to evaluate firm solvency. He finds that firms that report profits and firms that beat analysts’ earnings forecasts have a lower initial bond yield spreads and that firms that that report profits, beat previous year earnings and beat analysts’ earnings forecasts show a higher probability of a credit rating upgrade next period.
The ability of current cash flows to predict future cash flows is greater for firms whose analysts issue cash flow forecasts (Call, 2008). Cash flow information is incrementally useful because it helps investors to
4
interpret the information contained in earnings numbers. Moreover, cash flow numbers are less subjective (as compared to accruals); then, they can be regarded as more useful benchmarks in evaluating firm performance, notably solvency and liquidity, which are particularly important to debt investors. Studies have used both initial bond yield spreads and credit ratings to proxy for firm cost of debt (Ahmed et al., 2002; Shi, 2003; Jiang, 2008). Therefore, the first three hypotheses are stated as follows:
H1: Firms that beat cash flow benchmarks, previous year’s cash flow and analysts’ cash flow forecasts, exhibit smaller initial bond yield spreads in the following period (Spreadit+1) relative to firms that miss cash flow benchmarks.
H2: Firms that beat cash flow benchmarks, previous year’s cash flow and analysts’ cash flow forecasts, experience a decrease (or at least a smaller increase) in their initial bond yield spreads between consecutive periods (Spreadit+1 - Spreadit) relative to firms
that miss cash flow benchmarks.
H3: Firms that beat cash flow benchmarks, previous year’s cash flow and analysts’ cash flow forecasts, exhibit higher probabilities of credit rating upgrades compared to firms that miss these benchmarks.
Given that beating cash flow benchmarks updates the probability of a firm’s default risk and hence reduces the cost of debt, I argue that this effect might be more pronounced at short maturities than at long maturities. H4: The effect of beating cash flow benchmarks, previous year’s cash flow and analysts’ cash flow forecasts, on the initial bond yield spreads in the following period (Spreadit+1) is stronger at short maturities.
When earnings are less informative, debt holders and credit rating agencies might place more emphasis on cash flow information. Therefore, this study hypothesizes that the effects of beating cash flow benchmarks on a firm cost of debt are more pronounced for firms with less informative earnings.ii
H5: For observations with low earnings response coefficients, the effect of meeting or beating cash flow benchmarks, previous year’s cash flow and analysts’ cash flow forecasts, on the initial bond yield spreads in the following period (Spreadit+1) is stronger compared to firms with high earnings response coefficients.
H6: For observations with low earnings response coefficients, the effect of meeting or beating cash flow benchmarks, previous year’s cash flow and analysts’ cash flow forecasts, on the probability of credit rating upgrades is stronger compared to firms with high earnings response coefficients.
3. RESEARCH DESIGN 3.1 Models and sample selection
Following prior literature, this paper uses initial bond yield spread, change in initial bond yield spread and credit rating scores, as proxies for cost of debt. Initial bond yield spread, measured as the difference between the corporate bond yield at the issuance date and the Treasury bond yield with comparable maturity, represents the premium a firm must pay for the risk associated with its credit. A credit rating score is a qualified assessment and formal evaluation of a firm’s credit history and ability to repay obligations. It measures the borrower’s ability to fully repay financial debt obligations in a timely manner by assigning a default probability. The main purpose of credit ratings is to provide investors with comparable information on credit risk, based on a standard rating scale, abstracted from firm specifics.
To test the first two hypotheses, the study employs a methodology similar to that of Jiang (2008). I estimate a multiple regression model (Model 1), where the dependent variable is the initial spread on the largest bond issued at year t+1.iii
5 Model 1
To obtain further evidence that beating previous year cash flow benchmarks reduces the cost of debt, I run a multiple regression model (Model 2). The dependent variable is the change in the initial bond yield spread between years t+1 and t.
Model 2
To test the third hypothesis I estimate a logistic regression (Model 3) in which the dependent variable is a dichotomous variable that takes the value 1 if a firm receives a credit rating upgrade in year t+1, and 0 otherwise.
Model 3
In Model 1, Spreadit+1 represents the initial bond yield spread for largest new bonds issued within 360 days
after firm i’s cash flow announcement for year t. In Model 2, ΔSpreadit+1 represents the difference between
the initial bond yield spread of the largest bond issued by firm i in period t+1, and the initial bond yield spread of the largest bond issued by the same firm in period t. In model 3, ΔRatingit+1 reflects rating changes
between the end of the fiscal year t+1 and t, specifically it is measured as 1 if Ratingit+1 − Rating it<0
(upgrade), 0 otherwise. Rating it is the firm I Standard and Poor’s new issue debt rating in year t. I translate
ratings letters into rating numbers, with a smaller number indicating a better rating (AAA=1, AA+=2, AA=3, etc.).
Dichotomous variables are constructed to signal whether a firm beats cash flow benchmarks. CFO_ Surpriseit takes a value of 1 if firm i beats the mean value of analysts’ cash flow forecasts issued prior to
the cash flow announcement date in year t. CFO_ Changeit takes a value of 1 if firm i, in year t, beats the
previous year’s cash flow values, and 0 otherwise.iv In Model 1, I expect the coefficient β
1 to be negative
and significant. In Model 2, I expect the coefficient γ1 to be negative and significant. In Model 3, I expect
α1 to be positive and significant.
Prior literature has documented that firms with better performance and less risk have lower cost of debt (Ahmed et al., 2002, Shi, 2003, Jiang, 2008). Therefore, book-to-market ratio and the return on assets ratio (ROAit) are included to control for firm performance. Leverage, measured as long term debt divided by
6
total assets is added to control for risk. Additionally, based on Jiang (2008), indicator variables to denote whether a firm meets or beats analysts’ earnings forecasts (EPS_Surpirseit), or whether a firm meets or
beats previous year earnings values (EPS_changeit) are incorporated in the models.
In Models 2 and 3, the dependent variables initial bond yield spread and credit rating score are measured as one-year changes. Therefore, the control variables are transformed into one-year changes. I expect the performance proxies to be negatively related to initial yield bond spread and positively related to the probability of credit rating upgrades. Firms with better performance (i.e., lower book-to-market ratio and higher ROA) may enjoy a lower initial yield bond spread, a decrease in their initial bond yield spreads between periods and a higher probability of credit rating upgrade. I expect risk proxy to be negatively related to upgrade probability, and positively related to initial yield bond spread.
In Model 1, I control for specific bond characteristics. The numerical Standard and Poor’s bond rating SPit
(with a higher rating indicating higher default risk) in included in the models. A positive relationship between SP and the initial yield bond spread is expected. I also include the offering amount, measured as the natural log of the amount issued, in millions of dollars; an indicator variable, Seniorit, which takes the
value of 1 for senior bonds and 0 for subordinated bonds; and a variable (Callit) that measures the call
provision associated with the bond. I expect senior bonds to have a lower cost of debt. Holders of senior bonds are more protected than subordinated bondholders in case of default. Call provisions on bonds expose bondholders to interest risk. Therefore, I expect the variable Call to be negatively related to the cost of debt. A control variable (Price_Chit) is included in all models. This variable accounts for all other relevant
information affecting initial bond yield spreads and the credit rating scores between the dates on which the variables are measured. In Model 1, Price_Chit is the percentage change in stock price between the cash
flow announcement date and the day before the issuance day. In Model 2, Price_Chit measures the change
in stock price between the day after issuance in year t and the day before the new issuance in year t+1. In Model 3, Price_Chit measures the percentage change in stock price between the ends of fiscal periods. A
negative relationship between Price_Chit and the initial bond yield spread and the change in the initial bond
yield spread, and a positive relation between Price_Chit and the probability of a credit rating upgrade are
expected. This assumes that all other value-relevant information is captured by stock prices and that higher stock prices are good news for bondholders.
3.2 Term structure effect of the credit spreads
In order to model the term structure effect of the credit spreads, this study follows the methodology used by Yu (2005). I construct a piecewise linear function of bond maturity that has four knots, at zero, five, ten and thirty years of maturity.
7
I define:
where Maturity is measure as the years to maturity corresponding to the new bond issuance.
I modify the formulation so that the coefficients of the new variables m0, m1, m2 and m3 (defined below) represent the level of the credit spread curves at the four knots. I define,
and the interaction effects between the dummy variable CFO_Surprise and m0, m1, m2 m3, denoted as dm0,
dm1, dm2, dm3, which measures the term structure effect of the credit spreads for firms that meet or beat
analysts’ cash flow forecasts.
I run the following cross-sectional regression (Model 4):
Model 4
Consistent with my fourth hypothesis I expect that the effect of beating analysts’ cash flow forecasts be more pronounced for bonds at short maturities, as reflected in negative, decreasing in absolute value, coefficients dm0, dm1, dm2, dm3. Graphic 1 presents graphically my fourth hypothesis.
8
Graph 1: Impact of beating analysts’ cash flow forecasts on the credit spread term structure
3.3 Earnings informativeness and the firm cost of debt
In order to analyze whether the effect of beating cash flow benchmark on a firm’s cost of debt is more pronounced for firms with are less informative earnings numbers, I rerun models 2 and 4 for two subsamples of firm-year observations, firms with higher and lower earnings response coefficient (ERC). Lui and Thomas (2000) provide evidence on the use of ERC as a measure of earnings informativeness. Following previous studies, I estimate each firm-year’s ERC by regressing two-day [0, +1] (where 0 is the annual earnings announcement day) cumulative market adjusted stock returns on the earnings surprise using data from the previous 10 years. Earnings surprise is calculated as the difference between the actual EPS minus the most recent mean analysts’ earnings forecast. I update the estimate of each firm’s ERC on a rolling basis from 1995 to 2009. I classify a firm-year observation as having less informative earnings if its ERC is below the fourth lower decile of the ERC distribution corresponding to that year. On the other hand, I classify a firm-year observation as having more informative earnings if its ERC is above the fourth upper decile of the ERC distribution corresponding to that year.v
I expect the coefficient of the dummy variable CFO_Surprise in model 2 to be more negative for the subsample of firm-year observations in which earnings are less informative. Moreover, I expect the coefficient of the dummy variable CFO_Surprise in model 3 to be more positive, and significant, for the subsample of firm-year observations in which earnings are less informative.
4. DATA SAMPLE AND DESCRIPTIVE STATISTICS
This paper uses 1995–2009 cash flow actual values and analysts’ cash flow forecasts from the I/B/E/S database to construct cash flow surprise indicators. US COMPUSTAT database is used to construct changes in cash flow and earnings per share indicators and to compute accounting ratios. I collect data on both convertible and nonconvertible, fixed-rate bonds issued by US firms from 1995 to 2009 from Securities Data Company’s Global New Issues database. If a firm has multiple issues in a given year, I use the one with the largest offering amount. The final sample consists of 994 new bond issuances. The sample containing the change in initial bond yield spreads consists of 447 observations.
9
Debt credit ratings for new issue bonds are collected from the Securities Data Company’s Global New Issues database from 1995 to 2009. The final sample consists of 491 complete observations. All other data are collected from US COMPUSTAT and the CRSP database.
4.1 Descriptive statistics
Table 1 presents the descriptive statistics of the dependent and independent variables used in Model 1. As shown in Table 2, the mean value of the initial bond yield spread (Spreadit) in the sample is 1.57 percent, with a median value of 1.25 percent. Almost 62% of the firms in the sample beat the mean value of analysts’ cash flow forecasts, and almost 60% beat previous year’s cash flow. Firm size in the sample ranges from a minimum of $181 million to a maximum of $188 billion. The mean amount issued is $363 million. The mean bond maturity is almost 10 years.
Table 1: Descriptive statistics: Initial bond yield spread sample
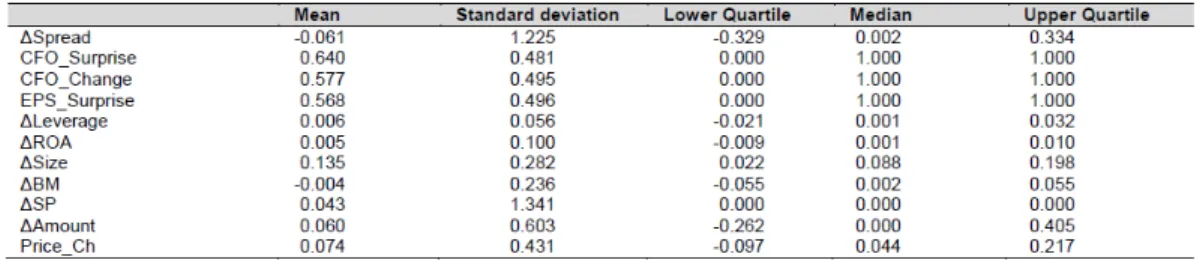
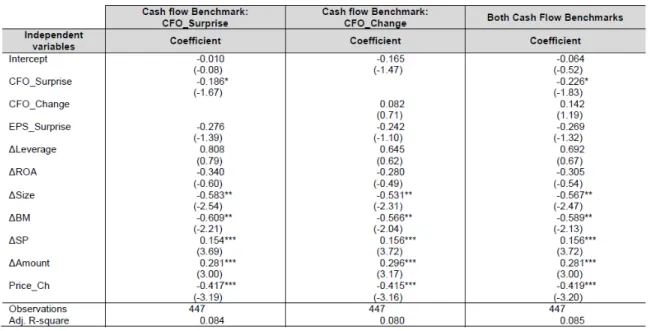
Table 2 presents descriptive statistics on dependent and independent variables used in estimating Model 2. The mean change in the initial bond yield spread in the sample is -0.06 percent. Almost 64% of the firms meet or beat analysts’ cash flow forecasts and 57% of the firms meet or beat previous year’s cash flow numbers.
Table 2: Descriptive statistics: Change in initial bond yield spread sample
Table 3 presents the descriptive statistics of the credit rating sample. Almost 56% of firms in the full sample report a rating upgrade, 55.2% report a positive cash flow surprise, and 54.4% report a positive change in cash flow per share. The mean change in stock price between the ends of fiscal periods is 7.2%, with a median value of 3.3%.
10 Table 3: Descriptive statistics: Credit rating sample
5. RESULTS
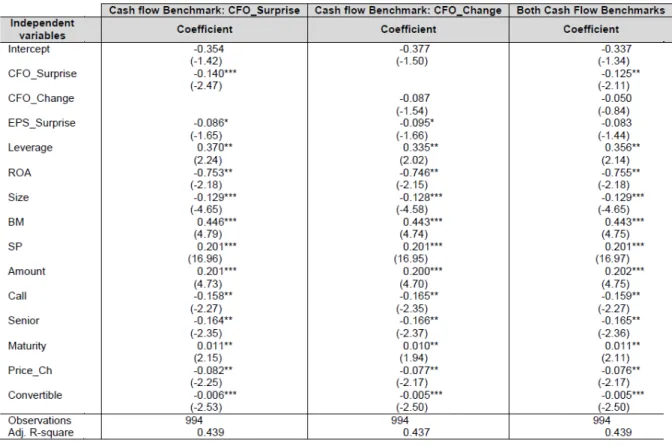
5.1 Results for the cost of debt
Tables 4, 5 and 6 present multivariate analyses of the initial bond yield, the change in initial bond yield, and credit rating upgrade sample. (Models 1, 2 and 3). The first column reports the regression results using only analysts’ cash flow forecasts as the cash flow benchmark, the second column reports the results using the previous year’s cash flow as the benchmark, and the third column reports the results using both cash flow benchmarks
11
Table 5: Multiple regression results based on the change in the initial bond yield spread sample
Table 6: Logistic regression results based on the credit rating sample
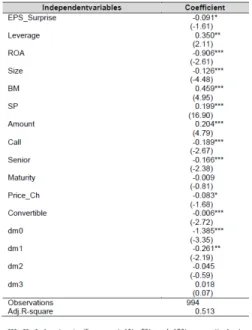
5.2 Results for the term structure effect of the credit spreads
Table 7 reports the cross-sectional regression results of Model 4. As hypothesized (H4), the interaction effects of the dummy variables denoting firms that beat analysts’ cash flow forecasts and the knots of the piecewise linear function of bond maturities are negative and significant.vi Moreover, the impact of beating
analysts’ cash flow forecasts on the firm’s cost of debt is more pronounced for bonds with short maturities, at zero and five years (-1.385, p-value<0.01 and -0.261, p-value<0.05).
12
Table 7: Multiple regression results based on the initial bond yield spread sample and the effect of the term structure effect of the credit spreads
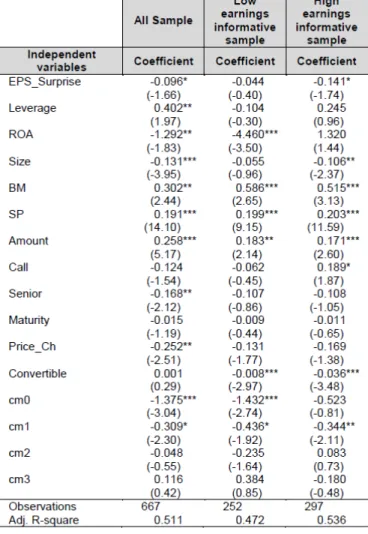
5.3 Earnings informativeness and the firm cost of debt results
Tables 8 and 9 present the results of the multivariate analysis of the initial bond yield sample and credit rating sample (Models 1 and 3) partitioned into two subsamples based on the informativeness of the earnings numbers.vii The first column reports the results of the full sample, the next column shows the
results of the low informative earnings group; and the last column presents the results of the high informative earnings group.
Table 8: Multiple regression results based on the initial bond yield spread sample, and subsamples based on the informativeness of earnings
13
Table 9: Logistic regression results based on the credit rating sample, and subsamples based on the informativeness of earnings
The main results are summarized as follow:
Overall, the reduction on the initial bond yield spread for firms that beat cash flow forecasts is more pronounced for firms with less informativeness earnings and the probability of a credit rating upgrade is significant for firms that beat analysts’ earnings forecasts for the high informative earnings group.
Table 10 presents the results of the multivariate analysis of the initial bond yield sample and the term structure effect of the credit spreads (Model 4) partitioned into two subsamples based on the informativeness of the earnings numbers. As shown, the reduction in the initial bond yield spreads, at short maturities, for firms that meet or beat analysts is more pronounced for firms with less informativeness
14
earnings. Moreover, the coefficient of the indicator variable that denotes firms that meet or beat analysts’ earnings forecasts is only significant for the high informative earnings group.
Table 10: Multiple regression results based on the initial bond yield spread sample and the effect of the term structure effect of the credit spreads, and subsamples based on the informativeness of earnings
Overall these results are consistent with the hypotheses that the effects of beating analysts’ cash flow forecasts on a firm’s cost of debt are more pronounced when earnings numbers are less informative.
5. CONCLUSIONS
Whether bondholders and credit rating agencies rely on particular reference points in their decision making process is an open empirical question. This paper argues that lenders are concerned with firm solvency over profitability. Therefore, if lenders have any reference point or heuristic, it may be related to cash flow numbers.
The results presented in this paper support the idea that firms that meet or beat cash flow benchmarks enjoy a lower cost of debt. Specifically, firms that meet or beat analysts’ cash flow forecasts have smaller initial bond yield spreads in the following period. The magnitude of this effect is more pronounced at short maturities and for observations with less informative earnings numbers. Furthermore, firms that meet or
15
beat analysts’ cash flow forecasts see a decrease in their initial bond yield spreads between consecutive periods.
Concerning credit rating scores, this study finds that firms that meet or beat analysts’ earnings forecasts face a higher probability of rating upgrades. Firms that meet or beat cash flow forecasts have a higher probability of a credit rating upgrade only when their earnings are less informative.
REFERENCES
Ahmed, A., Billing, B., Morton, R. & Stanford-Harris, M. 2002. The role of accounting conservatism in mitigating bondholder-shareholder conflicts over dividend policy and in reducing cost of debts, The Accounting Review, 77(4): 867-890.
Bartov, E., Givoly, D. & Hayn, C. 2002. The rewards to meeting or beating earnings expectations, Journal of Accounting and Economics, 33(2): 173-204.
Brown, L. & Caylor, M. 2005. A temporal analysis of thresholds: propensities and valuation consequences, The Accounting Review, 80(2): 423-440.
Burgstahler, D. & Dichev, I. 1997. Earnings management to avoid earnings decreases and losses, Journal of Accounting Economics, 24(1): 99-126.
Call, A. 2008. Analysts’ cash flow forecasts and the predictive ability and pricing of operating cash flow, Working Paper. Call, A., Chen, S. & Tong, Y. 2009. Are analysts’ earnings forecasts more accurate when accompanied by cash flow forecasts?, Review of Accounting Studies, 14(2-3): 358 – 391.
Datta, S. & Dhillon, U. 1993. Bond and stock market response to unexpected earnings announcements, Journal of Financial and Quantitative Analysis, 28(4): 565-577.
DeFond, M. & Hung, M. 2003. An empirical analysis of analysts’ cash flow forecast, Journal of Accounting and Economics, 35(1): 73 – 100.
Degeorge, F., Patel, J. & Zeckhauser, R. 1999. Earnings management to exceed thresholds, Journal of Business, 72(1): 1–32. DeFond, M. & Hung, M. 2007. Investor protection and analysts’ cash flow forecast around the world, Review of Accounting Studies, 12(2-3): 377 – 419.
Givoly, D., Hayn, C. & Lehavy, R. 2009. The quality of analysts’ cash flow forecasts, The Accounting Review, 84(6): 1877–1911. Graham, J., Harvey, C. & Rajgopal, S. 2005. The economic implications of corporate financial reporting, Journal of Accounting and Economics, 40(1-3): 3-73.
Hail, L. 2007. Discussion of investor protection and analysts’ cash flow forecast around the world, Review of Accounting Studies, 12(2-3): 421 – 441.
Jiang, J. 2008. Beating earnings benchmarks and the cost of debt, The Accounting Review, 83(2): 377 – 416. Liu, J. & Thomas, J. 2000. ‘Stock returns and accounting earnings’, Journal of Accounting Research, 38(1): 71–101. McInnis, J. & Collins, D. 2006. Do cash flow forecasts deter earnings management?, Working paper University of Iowa. Melendrez, K., Schwartz, W. & Trombley, M. 2008. Cash flow and accrual surprises: Persistence and return implications, Journal of Accounting, Auditing and Finance, 23(4): 573-592
Shi, C. 2003. On the trade-off between the future benefits and riskiness of R&D: A bondholders’ perspective, Journal of Accounting and Economics, 35(2): 227 – 254.
Yu, F. 2005. Accounting transparency and the term structure of credit spreads, Journal of Financial Economics, 75(1): 53-84. Ziebart, D. & Reiter, S. 1992. Bond ratings, bond yields and financial information, Contemporary Accounting Research, 9(1): 252-282.
16
Footnotes
i Analysts issue forecasts for cash flow from operations. Therefore, when I refer to cash flow, this means cash flow from operations.
ii I measure firm earnings informativeness by calculating the firm’s historic earnings response coefficient. iii In a robustness test, I use the weighted average spread, where the weights reflect the size of the offering. The main conclusions remain unchanged.
iv In a robustness test, in all of my models, I use two continuous variables for each cash flow benchmark instead of using indicator variables; one variable is the magnitude of positive cash flow surprise scaled by firm’s stock price (0 otherwise) and the other is the magnitude of the negative cash flow surprise scaled by the firm’s stock price (0 otherwise). The main conclusions of the paper remain unchanged.
v The main results remain if I classify a firm-year observation as having more (less) informative earnings if its ERC is above (below) the median ERC distribution corresponding to that year.
vi The coefficients of m0, m1, m2 and m3 are not shown for simplicity.
vii The number of observations is small due to data requirements to calculate firms’ ERC. The mean ERC for the full sample is 16.08. The mean ERC for the low informative earnings group is -6.84, while the mean ERC for the high informative earnings group is 40.48.