Department of
Wind Energy
Master Report
Frequency control in power systems without must-run
units
Guillermo Dominguez Lopez DTU Wind Energy-M-0156 June 2017
Authors: Guillermo Dominguez Lopez
Title: Frequency control in power systems without must-run units
DTU Wind Energy-M-0156 June 2017
DTU Wind Energy is a department of the Technical University of Denmark with a unique integration of research, education, innovation and public/private sector consulting in the field of wind energy. Our activities develop new opportunities and technology for the global and Danish exploitation of wind energy. Research focuses on key technical-scientific fields, which are central for the development, innovation and use of wind energy and provides the basis for advanced education at the education.
We have more than 240 staff members of which approximately 60 are PhD students. Research is conducted within nine research programmes organized into three main topics: Wind energy systems, Wind turbine technology and Basics for wind energy.
Project Period: January - June 2017
ECTS: 30
Education: Master of Science
Supervisors:
Anca D. Hansen Kaushik Das Müfit Altin
DTU Wind Energy
Remarks:
This report is submitted as partial fulfillment of the requirements for graduation in the above education at the Technical University of Denmark.
Technical University of Denmark
Department of Wind Energy Frederiksborgvej 399 4000 Roskilde Denmark
i
Abstract
Nowadays, most of the ancillary services such as reserve capacity, inertia and frequency control relies on large conventional power plants. Approaching future power systems with high penetration of renewable energy sources (RES) has resulted in imperative need for the evaluation of ancillary services. This research focuses on the frequency stability which must be ensured in order to maintain the grid stability against imbalances between generation and load. This large conventional power plants that provide ancillary services are called “must-run” units. These facilities are generation power plants necessary during certain operating conditions and they are responsible for providing enough ancillary services to ensure a reliable operation of power systems. Given a high RES penetration in the future, must-run units are expected to be reduced or totally decommissioned reducing the power system inertia. This may result in insecure operation threatening the reliability of the power supply. This project investigates the frequency stability support from renewable energy generation such as wind power plants (WPPs) and solar photovoltaic systems (SPVSs) in future power systems with high penetration of RES and without must-run units. Sensitivity studies for frequency stability are performed on a simulated 2030 scenario for western Denmark (DK1) power system.
The objective of this master thesis is to study the DK1 power system to analyse the ability of modern controllable WPPs to provide frequency stability without must-run units in a future scenario dominated by RES generation. This project examines the primary frequency control in DK1 simulating an overfrequency event islanding DK1 from the CE power system with high wind forecast.
The main results of this project reveal that the fast deploy of active power by the RES generation counterbalances the reduced inertia in the power system, which can operate without a lack of stability of the power supply for overfrequency events without must-run units. However, there are technical capabilities and limitations that curtail the RES penetration. Recommendations on the parameters of the WPPs frequency control are made according to the droop, the ramp rate and the RES penetration. The virtual inertia is recommended for frequency control of WPPs and increases its importance when the RES penetration is high. The support of HVDC interconnections is an interesting facility to increase the RES penetration allowing the power system to operate with even less inertia online maintaining a stable supply. Although, the measurement and communication delay by the frequency controllers increases its importance when increasing the RES penetration as faster power deploy is needed.
iii
Acknowledgments
I would like to express my special gratitude and thanks to my supervisors: Anca Daniela Hansen, Kaushik Das and Müfit Altin for their guidance, coaching, support, encouragement and valuable contributions throughout my master thesis. This project would not be possible without the continuous support from my supervisors, who are always disposed to discuss ideas and share knowledge.
I am thankful to José Luis Domínguez García1, Oriol Gomis Bellmunt2 and specially Mikel de Prada Gil1 from Catalonia Institute for Energy Research (IREC)1 and CITCEA2 for their advice on doing the master thesis in DTU and for introducing me to my main supervisor in this project, Anca Daniela Hansen.
I gratefully acknowledge Escola Tècnica Superior d’Enginyeria Industrial de Barcelona (ETSEIB) to give me the possibility of doing the master thesis in Denmark.
I would also like to thank to my colleagues, master students and PhD students, which I met in DTU for their knowledge sharing, friendship and very good times together. It has been a privilege to know such an amazing people and I enjoyed the experience of studying abroad thanks to them.
Special thanks to my family: Miguel, Pilar, Miki and Sergio. Words cannot express how grateful I am to my parents and brothers for all the sacrifices that they have made on my behalf. I would like to mention my girlfriend Mònica for her unconditional support in every step of the project and for me she was what sustained me thus far. I would also like to thank to all my relatives and friends that also support me through this stage of my life. I love you all.
v
Table of contents
Abstract ... i Acknowledgments ... iii Table of contents ... v List of Figures ... 1 List of Tables ... 3List of abbreviations and symbols ... 4
Chapter 1 Introduction ... 6
1.1. Background and motivation ... 6
1.2. Objectives ... 10
1.3. Assumptions and Limitations ... 11
1.4. Content of the report ... 12
Chapter 2 Frequency control aspects ... 14
2.1. Primary frequency control ... 15
2.2. Primary frequency control performance ... 19
2.2.1. Conventional power plants ... 19
2.2.2. Solar PV systems (SPVSs) ... 21
2.2.3. Wind power plants (WPPs) ... 22
Chapter 3 Modelling of western Danish power system ... 24
3.1. Power system characterization ... 25
3.2. Modelling the system interconnections ... 33
3.3. Modelling CHP and must-run units ... 34
3.4. Modelling DCHP units ... 36
3.5. Modelling the SPVSs ... 37
3.6. Modelling the WPPs ... 40
3.7. Single bus model, load model and outage ... 42
Chapter 4 Scenario description and test cases ... 45
4.1. Definition of the scenario ... 45
4.2. Definition of test cases ... 48
4.3. Definition of key parameters and success criteria ... 51
vi
Chapter 5 Sensitivity studies ... 55
5.1. Simulation of the base case ... 55
5.2. Study on the droop and the ramp rate... 56
5.3. Study on the virtual inertia implementation ... 62
5.4. Study on frequency support of the HVDC cross-border connections ... 67
5.5. Study on the delay in the measurement and communications ... 69
5.6. Summary ... 72
Chapter 6 Conclusions and future work ... 74
6.1. Main conclusions ... 74
6.2. Future work ... 76
References ... 78
1
List of Figures
Figure 1.1 Power system operating states [6] ... 7
Figure 1.2 Classification of power system stability with instability phenomena by major incidents [9] ... 8
Figure 2.1 The three steps of frequency control over time [28] ... 14
Figure 2.2 Frequency excursion for an overfrequency event [30] ... 15
Figure 2.3 Frequency power characteristics of a generating unit ... 17
Figure 2.4 Load sharing by parallel units with different droop ... 17
Figure 2.5 Overall requirements for active power production for frequency and voltage fluctuations for conventional power plants [34] ... 19
Figure 2.6 Primary frequency control for a conventional power plant [34] ... 20
Figure 2.7 Primary frequency control for SPVSs [35] ... 21
Figure 2.8 Primary frequency control for WPPs [36]... 22
Figure 3.1 Simplified illustration of DK1 delta and per-unit model ... 24
Figure 3.2 Danish map of international cable connections [38] ... 25
Figure 3.3 CHP and DCHP locations in Denmark by production [51] ... 29
Figure 3.4 Wind power electricity production and wind share in the net electricity production [57] [58] .... 31
Figure 3.5 Wind power installed capacity and number of turbines active [57] [58] ... 31
Figure 3.6 Aggregated CHP and must-run generic model ... 34
Figure 3.7 Speed governor for the must-run and CHP units ... 35
Figure 3.8 General turbine model for the must-run and CHP units ... 35
Figure 3.9 GAST model to simulate the aggregated DCHP units ... 37
Figure 3.10 Aggregated SPVS model ... 38
Figure 3.11 Aggregated WPP model ... 41
Figure 4.1 The four scenarios for the Danish energy system in 2030 [26] [82] ... 46
Figure 4.2 DK1 2030 scenario considered for the study based on data from [42]... 47
Figure 4.3 Measurement values for the Danish islanding in 29/05/2007 [9] ... 53
Figure 5.1 Frequency excursion for the base case with and without RES participation ... 55
Figure 5.2 Comparison between the base case and the test case with the same RES penetration ... 56
Figure 5.3 Frequency excursion for 0,5 pu/s ramp rate and 0,04 pu droop by RES penetration ... 57
Figure 5.4 Maximum instantaneous frequency by ramp rate, droop and RES penetration ... 58
2
Figure 5.6 RoCoF contour plot by droop and ramp rate in 70% and 85% RES penetration ... 60
Figure 5.7 Frequency excursion for the base case and 67% RES penetration by virtual inertia gain (Kd) ... 62
Figure 5.8 a) Maximum frequency reached in every simulation with and without virtual inertia. b) Maximum frequency contour plot with virtual inertia (Kd=60) ... 63
Figure 5.9 Maximum instantaneous frequency in 67% RES penetration by virtual inertia gain ... 64
Figure 5.10 Area with maximum frequency below 51 Hz by virtual inertia in 85% RES penetration ... 64
Figure 5.11 Oscillations in the frequency excursion by using a too low droop ... 65
Figure 5.12 Frequency excursion in 80% RES penetration for 60 pu, 30 pu and 0 gain for virtual inertia ... 66
Figure 5.13 RoCoF contour plot for 85% RES penetration with and without virtual inertia (Kd=60) ... 66
Figure 5.14 Maximum instantaneous frequency by ramp rate, RES penetration and HVDC capacity ... 67
Figure 5.15 Frequency excursion in 85% RES penetration by HVDC capacity available ... 69
Figure 5.16 Maximum frequency deviation by ramp rate, RES penetration and time delay ... 70
3
List of Tables
Table 3.1 Planned system interconnection capacities for 2030 scenario in DK1 by type of connection and
country [42] ... 26
Table 3.2 Future conventional power generation in Danish power system by 2015 predictions [45] ... 27
Table 3.3 Capacity and type of fuel for CHPs of DK1 [46] [47] [48] [49] ... 28
Table 4.1 Installed Capacities for Denmark and DK1 in 2030 in the Green Europe scenario [42] ... 46
Table 4.2 Power flow of the specific hour in 2030 scenario chosen [42] ... 47
Table 4.3 Test cases to be simulated in the sensitivity studies ... 50
Table 5.1 Recommended droop for WPPs by RES penetration and ramp rate performed ... 61
Table A.1 Parameters of the aggregated CHP and must-run unit ... 87
Table A.2 Parameters of the aggregated DCHP unit ... 88
Table A.3 Parameters of the aggregated SPVS ... 89
Table A.4 Parameters of the aggregated WPP ... 90
4
List of abbreviations and symbols
Abbreviation/symbol DefinitionAC Alternative Current
CE Continental Europe
CHP Combined Heat and Power
D Damping
DCHP Decentralized Combined Heat and Power
DK1 Western Danish grid
DK2 Eastern Danish grid
ENTSO-E European Network of Transmission System Operators for Electricity
FCR Frequency containment reserves
FFR Fast frequency response
FRR Frequency restoration reserves HVDC High Voltage Direct Current
Hz Hertz
Kd Virtual inertia gain constant
KPI Key performance indicator
M(2H) Inertia constant
MPPT Maximum power point tracking
ms Millisecond
MVA Mega volt ampere
MW Megawatt
NE Northern Europe
PCC Point of common coupling
PI Proportional integral
pu Per unit
R Governor Droop setting or droop
RES Renewable Energy Sources
RoCoF Rate of change of frequency
RR Replacement reserves
5
𝑇𝑓 Measurement and communication delay
TSO Transmission System Operator
TYNDP Ten-Year Network Development Plan
WPP Wind Power Plant
WT Wind Turbine
Δf Frequency deviation
ΔP Power deviation
6
Chapter 1
Introduction
This chapter describes the background and objectives of this project. The motivation, assumptions and limitations of the project are explained as well.
1.1.
Background and motivation
Many modern power systems are intensifying efforts on reducing their needs in fossil fuels and moving towards a 100% renewable generation [1]. This strategic change has been given as a consequence of the raising engagement for meeting environmental challenges and sustainable development.
Historically, the Danish power system, as many others, based the energy production on fossil fuels and it was not since late 90s when the renewable generation became relevant in electricity production [2]. Since then, the renewable energy sources (RES) have been increasing over the years and Denmark is involved into a green transition from a system based on large central fossil fired power plants towards an entirely renewable energy based system in 2050 [3]. Furthermore, the government’s goal for being independent of fossil fuels in electricity and heating generation was set in 2035 [4].
The power system stability is defined as the ability of a power system to recover a state of operating balance after being disturbed, with most system variables confined in certain boundaries, thereby, the entire system remains practically intact for given initial operating conditions [5]. According to [6] and [7], there are five operating states for power system security and stability purposes: Normal state, Alert state, Emergency state, Black out and Restoration. The illustration of these states is presented in Figure 1.1. In case of highly reliable system protection schemes, the power system operation could be shifted from normal state to alert state. The violation of the operational limits in case of extreme events, such as N-2 or more, would bring the system to an emergency state and there is risk of black out in case of loss of stability. The “N”, “N-1” or “N-2” terminology refers to number of failures for single or multiple elements that are linked and failed together as one where “N” is the normal operation of the power system [8].
7
Figure 1.1 Power system operating states [6]
Power systems are very complex since they are continuously growing to satisfy an increasing demand. Furthermore, power systems are interconnected with each other, so an instability phenomena that appears in one particular power system can end up being a global threat. Normal operation of the whole interconnected power systems can be threatened by a single instability in one of them. Figure 1.2 shows a classification of the power system stability [9]. For each classified stability issue, the different causes of instability phenomena are underlined. Examples of major incidents by each instability can be seen, like large disturbances and black outs which took place on the European Network of Transmission System Operators for Electricity (ENTSO-E) and in the United States power systems.
This study is focused on the frequency stability. Frequency stability refers to the ability of a power system to maintain a steady frequency after a severe disturbance resulting in a significant imbalance between generation and load [5]. A severe power imbalance in a power system generally results not only in large excursions of frequency, but outages in power flows, voltage and other system variables. These circumstances invoke the controls and protections, such as boiler and steam turbine dynamics, and the coordination of these controls must be considered. In highly interconnected power systems like Denmark, frequency stability is most commonly associated with islanding events leaded by the disconnection of AC lines between the western Danish power system (DK1) and Continental Europe (CE). The disconnection of multiple generators is usually correlated to handle with frequency stability as well. A power system islanding is an extreme event and some challenges are associated as long as the frequency is a system parameter and while one power system will manage an overfrequency event, the other will handle an underfrequency event.
8
Figure 1.2 Classification of power system stability with instability phenomena by major incidents [9]
Nowadays, the power system stability is mainly ensured and maintained through the so called “must-run units”. These units are necessary to provide ancillary services. There are different definitions for the ancillary services, but the definition considered in this study is that ancillary services are all the support services required by the power system to maintain the integrity of the transmission or distribution grid that ensures a stable and reliable power system operation. Examples of ancillary services are the voltage stability, the inertia or the frequency stability. The term ”must-run units” is explained in literature [10], [11] and [12], as large conventional power plants which are required to be online in order to provide ancillary services and are also required to run for technical reasons. It is known as conventional power plant all the power plants that are based on the combustion of fossil fuels and, in this study, the term includes: the must-run units, combined head and power (CHP) units and decentralized CHP (DCHP) units. The must-run units can be classified in two types according to the covered need:
Units which provide voltage control and grid stability that can supply ancillary services.
Combined heat and power (CHP) units which are required because of the heat production.
These units provide support to increase the flexibility in a power system. The flexibility describes the ability of a power system to handle with variability and uncertainty in both generation and demand showing imbalances up, while maintaining a satisfactory level of reliability at a reasonable cost, over different time
9
horizons [13]. Due to the adaptability of the CHP, these power plants are currently starting not to be considered as must-run units, hence they can shift production using heat storage, produce heat on alternative units such as boilers or bypass turbines altogether and operate in heat only mode.
According to ENTSO-E, the highest growth in generation capacity between 2020 and 2025 at the whole Pan-European zone correspond to both wind and solar where the wind generation is the one which has the highest net growth [14]. On the other hand, the fossil fuel based generation decreases, despite the gas fired power plants are the only one that increase its sharing. The energy scenarios developed by ENTSO-E following this transition plan imply that must-run and CHPs are likely going to be phased out and, consequently, this might result in an insecure operation of a power system without appropriate ancillary services provided by RES. The increment share of RES over the years together with the fact that these must-run units are very costly have already resulted in the decommissioning of these units [15]. For example, in Denmark, the transmission system operator (TSO, Energinet.dk) remunerates intensively for the ancillary services to secure and maintain the stability of the power system, and there are consequently strong financial incentives to significantly reduce the number and operational duration of must-run units [16]. Furthermore, the increasing use of electric boilers, heat pumps and heat storage reduce generation from CHP and also provides flexibility to the system increasing or decreasing power demand. Moreover, must-run units can be sometimes replaced by synchronous condensers when only voltage control is needed. As a result, the requirements from must-run units have been reduced to the usage of 1 unit in the western Danish grid (DK1) and in the eastern Danish grid (DK2) to 2 units [15]. Last year, for the first time, the Danish TSO tested the operation of the Danish power system without any must-run units for one day. It was demonstrated that it is possible to operate the Danish power system without must-run units for a short period. However, for this to become a day to day reality in the future when power system will operate with very high penetration of RES, many challenges for ensuring and maintaining the stability of the system should be investigated and solved.
Must-run units traditionally have been playing major role in both frequency regulation and frequency control following a large disturbance. The frequency regulation refers to the power adjustment in order to control the frequency around the nominal value in normal operation. The frequency control is the automatic performance, upward or downward adjustment of active power, after a large imbalance when a certain threshold in the frequency is reached to ensure the grid stability. Their unavailability in the future can therefore have a severe impact on the power system frequency without appropriate contribution from RES sources, such as wind power, because of the appearance of new challenges when the complexity of the power system is increased by adding the RES frequency stability support [17] [18] [19]. Many solutions
10
contributing to the green transition through ancillary services provision from RES have already been intensively investigated in the academia and industry in recent years [20] [21] [22]. However, the literature review reveals that until now the research into the capabilities of RES delivering critical properties to the power system has been conducted based on the assumption that the power system operates with must-run units. Furthermore, the research to date has not been focused on the possibility to exploit a joint and coordinated system support contribution from RES. This means that a through insight and understanding of the increasing complexity of a RES dominated Danish power system without must-run units is missing in the current research activities. Additionally, modern power electronics interfaced WPPs are capable of providing ancillary services [23] [24] [25]. However, the required responses from these WPPs should be identified through different control parameters and sensitivity studies.
1.2.
Objectives
The main objective of thesis is to answer the following question: Can the power system operate without the must-run units? And if so, which are the technical capabilities and limitations that allow the system to operate without must-run units?
The future scenario with a high RES penetration joined together with the electrification of the heat demand and the appearance of new consumptions like the electric vehicle will be a reality in the near future. These will increase the power generation, highly relied on variable power sources as wind and solar generation. Currently, CHPs and must-run units are in charge of providing support on frequency stability and other ancillary services and they will be decommissioned due to the increasing RES penetration and the high cost of maintaining a power plant online which only provides ancillary services. TSOs must ensure a secure operation against power imbalances on their power systems and, with the decommissioning of the must-run units, there is a need for the evaluation of the ancillary services. This project investigates the wind power frequency stability support in future power systems with very high penetration of RES without the must-run units. The aim of this study is to develop recommendations and new understanding on the frequency stability support performed by modern controllable WPPs in a low inertia scenario. In this study, primary frequency control is focused in a 2030 DK1 scenario and parameters for the frequency control for WPPs are studied focusing on overfrequency events.
Summarizing, the future 2030 DK1 power system operation without must-run units is evaluated. Recommendations on control strategies and control parameters are developed and tested to evaluate the technical capabilities and limitations in a power system with high penetration of RES in a low inertia
11
scenario. In order to meet the main objective of the project, specific objectives are defined. First, primary frequency control characteristics for DK1 power system are identified to provide the state of the art for this ancillary service of frequency stability. Then, a model of DK1 for a severe overfrequency event is modelled where a power imbalance take place in 2030 scenario when islanding DK1 from CE. The WPPs’ capabilities to provide ancillary services participating in primary frequency control are studied when the power system is operating with low inertia. Key parameters, such as power system inertia, are identified and their sensitivity is studied for frequency stability. The HVDC cross-border connectors are introduced in the power system frequency control and the coordinated frequency control of these connectors with the WPPs in a high RES penetration scenario is studied. Finally, a set of recommendations for overfrequency control for WPPs on a power system without must-run units and dominated by wind are proposed.
1.3.
Assumptions and Limitations
This study will focus on the 2030 scenario for DK1 based on the Ten-Year Network Development Plan (TYNDP) presented by ENTSO-E [26]. It is difficult to predict how the grid will develop until 2030. However, four scenarios were developed by ENTSO-E for 2030 and the scenario with the highest RES capacity is chosen for this research. The installed power capacity, the power demand and data from the cross-border power exchange between DK1 and the neighbour countries are established from [26] and [27]. When choosing the scenario with the highest RES penetration of the four developed by ENTSO-E for this study, a European focus on energy policies to be on track of the 2050 roadmap to achieve a fossil fuel free power system is considered.
High penetration of RES generation in a power system will be a challenge for TSOs to ensure the stability of the grid. Additionally, in a system leaded by wind and solar generation, not only frequency stability is affected, but rotor angle and voltage stability will present challenges to be solved in the future. However, the scope for this project is the study of the frequency stability and not the other forms of stabilities. Even though the frequency stability involves three different controls (primary, secondary and tertiary control), this research gives recommendations of better practices for primary frequency control on a high wind penetration power system based on test cases. The primary frequency control maintains the frequency in an acceptable range when a power imbalance take place in the first 30 seconds after the imbalance happens. The secondary and tertiary control are related to bring the system frequency into its nominal value and rescheduling the power hourly, but these two controls are out of the scope of this work.
12
The simulations of the case studies are made under the general assumption that the power system has enough frequency containment reserves to handle the power imbalance in the system. The worst case to be considered in frequency stability is an islanding event and the imbalance studied is an extreme event (i.e. N-4) where DK1 is islanded from CE due to a failure in all the AC lines. This study considers a base case where the must-run units are online and different test cases are developed by increasing the RES penetration and decommissioning first, the must-runs and then, the rest of the power plants that provide inertia to the system.
Aggregated models are developed with the available data of the power plants that will compose the future 2030 DK1 power system to simplify the mathematical effort of the simulations. So, the general conditions assumed in this study such as the high wind forecast are generalized while every WPP would have a different wind condition in the real scenario. Also, by aggregating the models, the congestion on the lines are neglected and it is assumed that they can handle all the power deviations.
This study is made under the assumption that the must-run, CHP and DCHP units are operating in a high set point (90% of the total capacity) and all the wind power is available, but it is curtailed to meet the hourly power dispatched. This assumption is made since there is not a market model providing the hour ahead generation. It can be a conservative consideration because, if the conventional power plants work in a low set point (and they probably will do), for the same power delivered, the capacity online of these power plants will increase together with the system inertia since the RES power online will not change.
Finally, the study is planned so the DK1 power system is capable to handle the outage and maintain the system frequency in an acceptable range even if it is in an emergency state without the need of a defence plan like a tripping strategy for the generators. This assumption is made because it is considered that providing the system to have enough reserves (i.e. downgrading the power in overfrequency events) is a cheaper solution than having a large tripping strategy of generators.
1.4.
Content of the report
The report is organised as follows:
In chapter 2, an overview of the frequency control aspects for this study is given. The key parameters for the primary frequency control are introduced. Moreover, the primary frequency control is explained for each power source provided in the Danish grid codes in which the frequency controllers of the developed model are based on.
13
In chapter 3, the DK1 power system, in which the simulation model is based on, is presented. A general structure of the facilities and interconnections is introduced in the actual and future Danish grid. For each component of the power system, the model implemented for the study is shown, underlining the clue components in each technology considered.
In chapter 4, the scenario and the test cases in which the project is based on are explained. The key parameters, the specific power flow studied and the evaluation criteria are presented. An example of a severe event islanding DK1 is presented at the end of this chapter.
In chapter 5, several sensitivity studies based on the considered key parameters are shown. A summary concludes the chapter where the main results and comments are included.
In the last chapter, the main conclusions of the research are summarized and discussed. Also, some suggestions and open questions for future projects are underlined.
14
Chapter 2
Frequency control aspects
This chapter gives an overview of frequency control aspects and the state of art of the ancillary service that ensures the primary frequency stability studied in this project. The primary frequency stability for conventional power plants (must-run, CHP and DCHP) and RES generation is underlined.
TSOs must guarantee a stable operation of their grid. The generation of the power units and consumption of the loads connected to the grid needs to be controlled to secure a high-quality performance of the grid and also to maintain a balance between the generation and the consumption. During normal operation of a power system, the generation follows the load and when there is an imbalance between them, the system frequency is affected. When there is a lack of generation, the frequency goes down and when there is a surplus of generation, the frequency goes up. Frequency control is required to prevent problems leaded by large frequency deviations from its nominal value such as the loss of synchronism of a synchronous generator. By means of frequency stability, there are three control steps: primary frequency control, secondary frequency control and tertiary frequency control. These three steps are respectively enabled over time to ensure a good sequential operation on the frequency recovery and an illustration can be seen in Figure 2.1.
Figure 2.1 The three steps of frequency control over time [28]
Power reserves are needed for underfrequency situations to supply frequency stability services. The active power produced by the generators has to increase or decrease in order to response to the power imbalance and control the frequency deviation. This power reserves are related to the three steps of
15
frequency control and they are named Frequency Containment Reserves (FCR), Frequency Restoration Reserves (FRR) and Replacement Reserves (RR) respectively by each primary, secondary and tertiary control, according to ENTSO-E and the European next System Operation Guideline [29]. In this study, the name FCR is used to mention the reserves dispatched by the power plants in the primary frequency control.
Figure 2.2 Frequency excursion for an overfrequency event [30]
In Figure 2.2, it can be seen the frequency excursion when a power imbalance takes place for an overfrequency event. The frequency excursion refers to the evolution of the frequency over time when there is a power imbalance in a power system. In this project, the primary frequency control when DK1 is islanded from CE is analysed. In the following sections, the dynamics of the primary frequency control is explained and reviewed from the Danish grid code to understand its performance to implement this control to the model developed in this study.
2.1.
Primary frequency control
The primary frequency control enables the FCR. This control ensures the balance between generation and demand in a synchronous area during the first 30 seconds after a disturbance. It is the first step of the frequency control (Figure 2.1) and it is an automatic function performed by the speed governors and other frequency controllers implemented in the different interconnected conventional power plants. The power output of the power plants is adjusted as according to the frequency deviation stabilizing it at a stationary value. The frequency deviation appears after a precipitous disturbance or imbalance of the active power and it does not return to its nominal value until the secondary control, or a defence plan if the power
16
system is threatened to loss its stability, is activated. A defence plan is the last action of a power system to prevent a black out when the grid is in emergency state and threatening to loss its stability [31].
The deployment of FCR is needed to keep the frequency within the design limits when a power imbalance takes place. The FCR are delivered with an activation time up to 30 seconds. The amount of FCR established in the CE is 3000 MW [30], the same value as the reference incident defined by ENTSO-E. Denmark has to contribute with 27 MW from DK1 to CE and also the eastern Danish power system (DK2) has to contribute with 160 MW to Northern Europe (NE) since the Danish power system is synchronized separately, DK1 and DK2, to both CE and NE, respectively [32].
According to the ENTSO-E handbook, the maximum permissible quasi-steady-state frequency deviation after a reference incident is ±200 mHz where the primary frequency control is fully activated and the FCR must be fully deployed after 30 seconds from the detection of the imbalance. The minimum and maximum instantaneous frequency after a loss of generation or load, respectively, are 49,2 Hz and 50,8 Hz that correspond to ±800 mHz from the nominal frequency. In this study, the maximum instantaneous frequency is also referred as maximum frequency deviation or frequency peak. The maximum and minimum instantaneous frequency that will be considered in this study are 51 and 49 Hz which are limits that reach the ±800 mHz mentioned before, so the system operates in emergency state. The limits chosen correspond to the normal operation zone for the power plants modelled according to Energinet.dk (Danish TSO) as it would be seen in following sections for conventional power plants, WPP and SPVS.
A frequency controller, speed governor in case of the conventional power plants, is implemented in the generators to perform primary frequency control. This governor implements the governor droop setting, or just droop (R), which is the main characteristic of this governor and it is the relation between the frequency deviation in the power system and the power deviation dispatched by the power plant. It is defined as the percentage of the frequency deviation required for a governor to drive a unit into a 100% change in the power output.
𝑅 [𝑝𝑢] = −𝛥𝑓/𝑓𝑛 𝛥𝑃/𝑃𝑛
= −𝛥𝑓 [𝑝𝑢]
𝛥𝑃[𝑝𝑢] (1)
Equation (1) means that for a 6% of droop, a 6% of frequency deviation will cause a 100% change on the power output of the generating unit. In Figure 2.3, it can be seen the frequency power characteristic of a generating unit [7] [33].
17
Figure 2.3 Frequency power characteristics of a generating unit
In Figure 2.4, the power deviation for two different generating units with different droop in the speed governor is shown. The same deviation on the frequency does a different power change in the generating units. The higher the droop is, the less it will respond to a frequency deviation. Furthermore, the power delivered by the two power plants is related to equation (2).
Figure 2.4 Load sharing by parallel units with different droop
𝑅1 𝑅2
=𝛥𝑃2 𝛥𝑃1
18
Finally, it is worth mentioning that the operation set point of the power plant maters during a power imbalance because if the generator is working at high level, it may not have enough reserves to support a underfrequency event, for example. This also happens in overfrequency events when the generator is working at minimum level and a positive frequency deviation takes places so the power plant cannot reduce the power output and the only option to reduce the power is the disconnection of the generator. The power system frequency characteristic (𝛽𝑃𝑆) represents the total action of the primary frequency control provided by generators and self-regulating effects of the load. This parameter relates the steady state change in the system frequency (𝛥𝑓) when a power imbalance (𝛥𝑃) appears:
𝛽𝑃𝑆 = − 𝛥𝑃 𝛥𝑓
(3)
The power frequency characteristic is also referred as composite frequency response characteristic or the stiffness of the system and it is expressed in MW/Hz [7]. After an imbalance, the frequency goes through a transitory state before stabilizing on a steady-state value. This value does not only depend on the frequency characteristic of each single unit, but also depends on the load damping constant (D) which is supposed as 1 %/Hz of the total load in this study. Further comments about the load damping constant are given in chapter 3.
The power system frequency characteristic can be calculated as a summation of the individual frequency characteristics of every generating unit ‘i’ (𝛽𝑖 [MW/Hz]) and the load damping constant. To calculate the frequency characteristic for a generating unit: the droop (𝑅𝑖 [pu]), the nominal power (𝑃𝑛,𝑖 [MW]) and the nominal frequency (𝑓𝑛 [Hz]) for each power plant is required as it is presented in equation (4) [7].
𝛽𝑃𝑆= ∑ 𝛽𝑖 𝑁 𝑖=1 + 𝐷 = 1 𝑓𝑛 ∑𝑃𝑛,𝑖 𝑅𝑖 𝑁 𝑖=1 + 𝐷 (4)
Where N is the number of generating units in the power system participating in the primary frequency control. The more generators are participating in the primary frequency control, the less frequency deviation will experience the synchronous area. The droop of the governor does not only affect the steady-state value of the frequency deviation given an imbalance in the power system, but the transient steady-state is affected as well because this parameter defines the velocity of the power response against a frequency deviation in a power system.
19
2.2.
Primary frequency control performance
The Danish power generation is spread in different technologies, but the power plants can all be aggregated in three types: conventional power plants, SPVS and WPP. From these three types of power plants, the must-run units are included in the conventional power plants. In this section, a review of the Danish grid code is presented to stablish the state of art in primary frequency control for these three generation power plants.
2.2.1.
Conventional power plants
Traditionally, the power systems rely on conventional power plants to keep the grid stable when it has to face an event that produces an imbalance. The rotating parts of this kind of generators provide inertia to the grid and it helps to have slower frequency excursions. CHPs and DCHPs are conventional power plants and they can be qualified as must-run units if they are online to provide ancillary services while selling the generation to the system. They must follow the Danish grid code to be online in the DK1 power system. In Figure 2.5, the operational limits of these power plants are illustrated. It can be seen that between 49 and 51 Hz the generator will work under normal production, but when the frequency goes below or above these limits, the generator will trip. If the frequency returns to the normal production range before the specified time, the generator will not trip.
Figure 2.5 Overall requirements for active power production for frequency and voltage fluctuations for conventional power plants [34]
20
With the decommission of conventional power plants due to the increasing RES penetration, the inertia and also the FCR provided by these generators will decrease. This means that if RES generation is increasing, a review on the calculation of the FCR is needed to allow them to participate in the primary frequency control to keep the system stable and with enough reserves. This is also challenging due to the variable generation from wind and solar and to the forecasting errors that would happen, so FCR are thought to increase in the future to counterbalance the mentioned before.
This study is focused on the frequency control, neglecting the frequency regulation, when an outage happens on the grid. The frequency control for conventional power plants above 1,5 MW is shown in Figure 2.6.
Figure 2.6 Primary frequency control for a conventional power plant [34]
In the power frequency characteristic, there is a dead band stablished by 𝑓𝑟𝑚𝑖𝑛 and 𝑓𝑟𝑚𝑎𝑥 that can be set at any value between 47,0-49,9 Hz and 50,1-52,0 Hz, respectively. Common values that are going to be used are 49,8 Hz and 50,2 Hz for 𝑓𝑟𝑚𝑖𝑛 and 𝑓𝑟𝑚𝑎𝑥. The droop for the speed governor must be possible to set in the range 2-8%, while a standard value is 6%. The primary frequency control must activate within 2 seconds after a detection of a frequency deviation and the measurement of the frequency is made continuously obtaining the average value for the frequency in a 80-100 ms range. A new value of the frequency is calculated every 20 ms. Also, the limit for the rate of change of frequency (RoCoF) is ±2,5 Hz/s. If the limit for the RoCoF is exceeded, the frequency goes below 47 Hz or above 52 Hz, the conventional power plants must be shot down with a trip time of 80 ms in the RoCoF case or 300 ms on the other two cases depending on which protective function is activated [34]. The limit for the RoCoF is the same for SPVSs and WPPs so it will not be explained again in the following sections.
21
2.2.2.
Solar PV systems (SPVSs)
The SPVS generation is the less present in the Danish grid compared to wind and conventional power plants and SPVSs are not performing frequency control normally because of the need of a specific agreement with the TSO. In a European scenario where the RES penetration is increasing, SPVSs are supposed to keep growing. However, Denmark would make greater investments in WPP than in SPVS.
SPVSs can operate in normal conditions between 47,0 and 52,0 Hz, unlike the conventional power plants presented before. The SPVS generation is decoupled from the grid by a converter and it does not have any rotating mass. These are the main reasons why SPVSs can operate normally in the whole range of frequency. The frequency control of a SPVS is presented in Figure 2.7.
Figure 2.7 Primary frequency control for SPVSs [35]
The SPVSs downgrade the output power to maintain the grid stability when a frequency threshold is reached in overfrequency events, but its generation is set to produce all the available power so the SPVSs cannot participate in underfrequency events. The frequency threshold can be set to any value between 50,0 and 52,0 Hz range with a standard value is 50,2 Hz. The droop of the governor must be possible to set between 2-12%, while a standard value is 4%. The primary frequency control must start no later than 2 seconds after a frequency deviation and must be completed within 15 seconds [35].
22
2.2.3.
Wind power plants (WPPs)
WPPs are going to become the muscle of the future Danish grid and, according to ENTSO-E, it will cover almost 66% of the installed capacity in 2030 Danish power system [26]. In this situation, the TSO has to continue ensuring the stability of the grid so the WPPs are expected to participate with ancillary services. WPPs above 50 kW must operate in normal conditions in a 49-51 Hz range of frequency and if the frequency goes up or down these limits, the WPP must trip the generation in a stablished range of time. In fact, the behaviour of WPPs has to be the same as the conventional power plants seen in Figure 2.5.
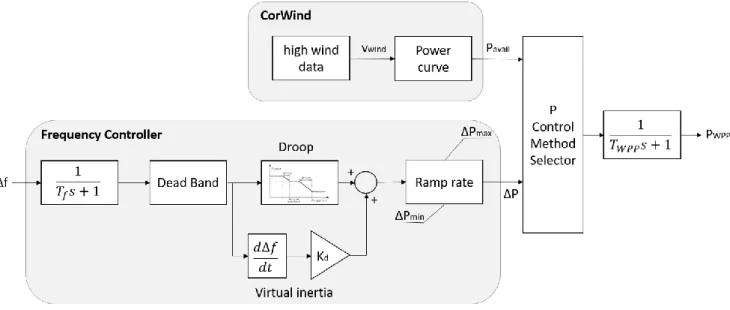
Every WPP must contribute on the frequency regulation reducing active power when frequency goes above a threshold and only plants above 25 MW with a prior specific agreement with the TSO can perform frequency control [36]. By the aim of this study, WPPs are supposed to perform primary frequency control and support the grid ensuring stability when a severe disturbance happens. The primary frequency control for WPPs is presented in Figure 2.8.
Figure 2.8 Primary frequency control for WPPs [36]
It must be possible to set 𝑓𝑟𝑚𝑖𝑛, 𝑓𝑟𝑚𝑎𝑥 and 𝑓1 to 𝑓7 that are given by Energinet.dk. The purpose of these points is to be able to produce different primary frequency control curves according to the delivery requirements. There are several droops in the curve, from droop 1 to droop 4, and they can be set between 2 and 12%, being 4% a standard value given by Energinet.dk [36]. To simplify the study, all the droops are considered to be the same value so the frequency control would be not a curve with different slopes, but a line with a constant slope that would be varied to do the sensitivity studies. Finally, 𝑃𝐷𝑒𝑙𝑡𝑎 is the capacity
23
reserve that the power plant is leaving to upregulate the power and it is related to the operation point of the WPP [36].
24
Chapter 3
Modelling of western Danish power system
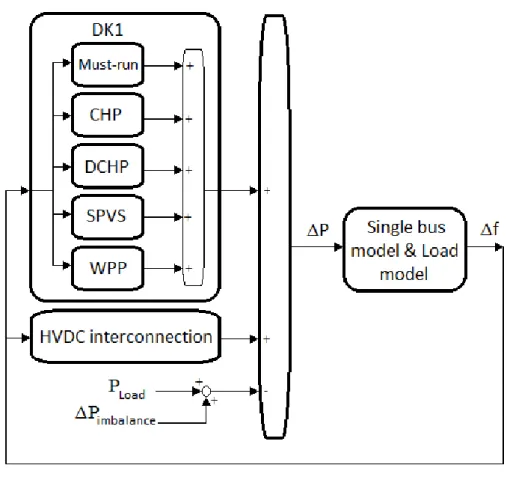
To study the WPP capabilities and develop sensitivity studies on the key parameters considered in this research, this chapter reviews the generating units and system interconnections on western Danish (DK1) to build up a suitable model for overfrequency studies in a 2030 scenario.
Firstly, this chapter gives an overview of the DK1 power system where the system interconnections and the different generating units are reviewed in its actual state and for 2030 future DK1 scenario. Secondly, aggregated models for the generating units are reviewed starting from the conventional power plants (must-run, CHP and DCHP) based on steam turbines and gas turbines. Also, aggregated WPP and SPVS models are developed, simplified for primary frequency control purposes, including the relevant dynamics for overfrequency event simulations. A simplified illustration of the model developed is presented in Figure 3.1. This is a delta model because both power plants and single bus model consider delta signals and it is also in per-unit.
25
3.1.
Power system characterization
The Danish power system is split in 2 different synchronous zones where DK1 is connected to CE through AC lines between Germany and Denmark and DK2 is connected to NE through Sweden. Both areas are connected with an HVDC link called “Great Belt” that is a 600 MW connection. DK1 is a highly interconnected power system that consists in HVDC and AC cross-border connections, must-run units (and other CHPs), DCHPs, SPVSs and WPPs and, in this section, an overall description for every component of the power system is presented.
The system interconnections are highly important in a power system based on variable RES generation as wind or solar. As an example of this importance in a power system with high wind power penetration like DK1, the HVDC links have enough capacity to supply more power than the maximum consumption from the first 4 months recorded of 2017 in DK1 if all the interconnections import energy [37].
Figure 3.2 Danish map of international cable connections [38]
Some studies analyse the wind production and the power exports showing that there is a correlation between the power exported to Sweden and Norway and the wind production [15] [39] [40]. This
26
correlation is explained due to the hydro based NE power system and these hydro power plants are able to store the wind power generated. Then, the Danish power system exports energy during high RES generation, almost exclusively wind generation, and the Danish power system imports energy during low RES generation. Also, The Danish power system is planned to be a net exporter of renewable energy in the future. There is not a correlation between the wind production and the power exported for the exchange of power with Germany. This can be explained due to a bottleneck on the capacity of the power exchanged by the congestion on the northern part of Germany when the German WPPs are online [41]. This problem is intended to be solved by increasing the HVDC links between Denmark and CE with a new connection to the Netherlands and Great Britain. A map where all the HVDC and AC connections that permit the cross-border power exchange between DK1 and neighbour power systems in 2030 scenario is shown in Figure 3.2. Also, the planned system interconnections to DK1 are shown in Table 3.1 where the capacity for each link is presented and the type of interconnection is also outlined based on data from [42].
Table 3.1 Planned system interconnection capacities for 2030 scenario in DK1 by type of connection and country [42]
System interconnections
HVDC AC
Netherlands Great Britain Norway Sweden DK1 Germany
Capacity [MW] 700 1400 740 1640 600 3000
The activation of cross-border exchanges for power balancing is explained and used for secondary and tertiary frequency control by the European commission, but they are not extensively used for primary frequency control [29].
The HVDC connections in normal operation are performing ramp rates with different time resolutions depending on where the link is connected, to NE or to CE, because of the composition of both synchronous areas. The CE is composed by a mix of power plants that can afford higher ramp rates and the NE area needs a lower ramp rate forced by the high hydro connected in the system. The maximum ramp rate for each connection is set to a maximum value of 30 MW/min. In the CE power system, the power exchanged considers a restriction of at least 10 minutes for the duration of change of the power flow where it starts 5 minutes before and ends 5 minutes after each hour shift. However, in the NE power system, the restriction is set to 30 minutes (15 minutes before and 15 minutes after each hour shift) [43].
The conventional power generation in Denmark is typically based on three types of generators as introduced in previous chapters: CHPs, DCHPs and the must-run units, which are also facilities englobed in the CHPs, but in charge of providing inertia and frequency control, among other ancillary services.
27
The widespread use of district heating combined with the cogeneration of heating and electricity are the main reasons why it is possible to increase the efficiency and reduce carbon emissions in Denmark [44]. The heat and electricity generated using CHP has a significantly higher efficiency than heat and power generated separately. A CHP plant may have a total efficiency combined heating and power of 85-93% resulting in an overall fuel saving of approximately 30% compared to separate production of heat and electricity. DK1 is composed by 7 large CHPs and around 400 small and medium CHPs, DCHPs, in whole Denmark. The large CHPs are located in big cities while DCHP are located in smaller towns or centres. In DK1, there is a need of 1 must-run unit online in the system from this 7 large power plants. In 2015, the predictions made in 2015 for the future conventional power generation in the Danish power system can be seen in Table 3.2.
Table 3.2 Future conventional power generation in Danish power system by 2015 predictions [45]
In both DK1 and DK2, DCHPs are mainly using gas for electricity generation and CHPs are mainly using coal as a fuel. Other sources of generation for these power plants are waste, oil or bio mass. The electricity production of these plants has been increasing in the last years. The Danish power system is increasing its flexibility and achieving low production set points of the conventional power plants which helps the integration of the wind power generation. To provide the conventional power plants with heat storage is a short term option for flexibility and decouples the heat and the electricity demand. Also, the Danish CHPs and DCHPs can perform faster response comparing with other conventional power plants in Europe. Some examples of this increased flexibility are the improve ways of co-producing heat and electricity like allowing
DCHP CHP Fuel Generation capacity [MW] Fuel Generation capacity [MW] Eastern Danish power system (DK2)
Bio Mass 124 Coal 1166
Coal 35 Gas 560 Gas 624 Oil 692 Waste 96 Internal Combustion 20 Oil 34 - - Western Danish power system (DK1)
Bio Mass 193 Bio Mass 350
Waste 154 Coal 1130
28
a bypass for the turbines where the facility can continue providing heat while no electricity is needed without turning down the plant [13].
In Figure 3.3, the different CHP and DCHP of the Danish power system are shown. These power plants provide system inertia and reserves for the frequency control. The 7 CHPs of DK1 are briefly summarized in Table 3.3 with their capacity and type of fuel.
Table 3.3 Capacity and type of fuel for CHPs of DK1 [46] [47] [48] [49]
Power station Electricity
power [MW] Heating production [MJ/s] Type of Fuel (Main/secondary) Skærbæk
Power Station 392 447 Gas
Studstrup
Power Station 714 986 Coal/Biomass
Esbjerg Power Station 371 460 Coal Herning Power Station 88 171 Gas/Biomass Viborg Power Station 57 57 Gas/Coal Fyn Power Station 397 - Coal/Biomass Nordjylland
Power Station 741 462 Coal/Gas
The future of the conventional power plants and the district heating in DK1 power system is to increase the flexibility of the conventional power plants. Some of these alternatives are mentioned before such as: the usage of heating storage, which allows the CHP to decrease their production when there is sufficient electricity generation; bypass the power turbines to avoid generating electricity or increasing the usage of electric boilers and heat pumps. The district heating plants can become loads to use the excess electricity from the wind directly for heating production. The increase of electric boilers will be also used to increase the demand for electricity when prices are very low by the large penetration of renewables. What is more, installing large heating storage, which is able to store heat several days, combined with the electric boilers can be also a solution for the frequency control services of the power system. Nevertheless, the remaining
29
conventional power plants will experience a change from coal to biomass and gas as it can be seen in [50] and probably they will not be considered must-runs anymore.
Figure 3.3 CHP and DCHP locations in Denmark by production [51]
The main focus of the renewable transition in the Danish power system is the wind integration and the solar is still seen as a minor option despite a proven growing degree of competitiveness. There is not a unified national programme for SPVSs in Denmark, but several number of projects supported by the Danish energy Authority’s and Energinet.dk. In the recent years, SPVSs have been growing very fast. In 2012, the photovoltaic (PV) installed capacity grew from 13 MW to 380 MW approximately. Also, from 2014 to 2015, the PV generation grew a 30% from 602 MW to 783 MW. The main SPVS capacity by 2014 and 2015 was located in small solar generation corresponding to the cells installed in residences. However, in 2015, SPVSs above 400 kW increase in a 440% (from 38 to 170 MW approximately) and it will continue increasing in the future [52] [53].
In 2012, the government goal for 2020 for the SPVS capacity installed was 200 MW, which now it can be seen as a non-ambitious goal since by the end of 2016 the installed SPVS capacity in Denmark was estimated in more than 800 MW. However, the incredible increase of 30 times the installed capacity in 2012 was obviously not expected. By those years, it was thought that Denmark’s solar would reach 1 GW by 2020 and 3,4 GW by 2030. In early 2016 the Danish Energy Agency forecasted that SPVSs will reach 1,75 GW by 2020 and more than 3 GW by 2025. One of the main reasons of the incredible growth in the solar
30
capacity was the net metering implemented in 2010. This policy allows the SPVS owners to generate and store the surplus production in the public grid. Consequently, it makes the variable generation of the solar more attractive so the energy generated in a shiny day could be used at night.
The scenario considered in this study developed by ENTSO-E, that is explained in the next chapter, is conservative and contemplate a SPVS capacity installed by 2030 of 1,4 GW, when this installed capacity will be probably achieved in 2020. The installed capacity in DK1 by the given scenario is 985 MW and it is considered that all the capacity is online and operating in the study. Given the 3,4 GW of SPVS capacity reviewed in the literature, having 985 MW online in the grid is considered a feasible scenario.
Some studies start including and analysing the solar in frequency stability analysis [54] [55] [56]. The main challenge when integrating solar, and also wind to the power system, increasing the RES penetration replacing conventional power plants is the loose of inertia and the variable power dispatching related to the maximum power point tracking (MPPT). To deal with the capabilities of the PV to support the frequency control, a delta power control can be used. In order to implement this control scheme, there are three approaches: integrating energy storage systems, applying a dump load to dissipate excess power or limiting the extracted PV power by modifying the MPPT algorithms.
The loose of inertia is introduced in this study as a problem for the renewable penetration because of the faster frequency excursions when an imbalance happens, hence, a need for faster deployment of FCR. However, full controlled generation as the SPVSs can achieve high ramp rates on the power output that can help the power system to response faster against a frequency deviation. There is a proposal found to denote the frequency stability support capability of inertia-less generation units during primary frequency control after major power imbalances known as fast frequency response (FFR) [56]. The favourable conditions for PV generation and the decreasing investment costs will probably lead to a continued implementation of PV generation even if the Danish road map is focused on WPP.
WPPs are in the focus for the green transition of Denmark for the next years. The power generated from wind power has been increasing from its beginning in the seventies and it experienced a fast raise in late nineties to the present. In Figure 3.4, the electricity generation by WPPs is shown with the wind power share of the net electricity production from 2000 to 2016, while Figure 3.5 presents the wind installed capacity and the number of wind turbines active. Both figures based on data from [57] and [58]. Denmark set a new world record in 2015 with a total share of 51% of the net production and 42% of the total electricity consumption being the top country in wind share in the world [59]. However, a reduction on the power produced can be seen in 2016 caused by a low windy year. The variability of an intermittent
31
generation like the wind, and also the solar, is present, but the wind share was still above 44% of the net production and 37% of the domestic consumption.
Figure 3.4 Wind power electricity production and wind share in the net electricity production [57] [58]
Figure 3.5 Wind power installed capacity and number of turbines active [57] [58]
What is more, the capacity installed is increasing year by year from a 2390 MW in 2000 to 5245 MW the last year, 2016. Although, while the number of turbines was kept between 5 and 6 thousand, the capacity
12 12 13 13 17 19 14 19 20 20 21 29 35 34 43 51 44 0 10 20 30 40 50 60 70 80 90 100 2000 2002 2004 2006 2008 2010 2012 2014 2016 0 2000 4000 6000 8000 10000 12000 14000 16000 WIN D P OWE R SH ARE [%] TIME [YEARS] WIN D P OWE R P ROD UCTION [G
WH]
Wind Power Production
Wind Power Share
0 1.000 2.000 3.000 4.000 5.000 6.000 7.000 2000 2002 2004 2006 2008 2010 2012 2014 2016 0 1.000 2.000 3.000 4.000 5.000 6.000 N UM BER OF TURBIN ES [U N ITS] TIME [YEARS] WIN D P OWE R CA P AC ITY [MW]
Wind Power Capacity
Number of turbines
32
was increasing every year by the continuous commission and decommission of new and old turbines to increase the nominal power of the turbines installed. As an example of the huge generation that the WPPs installed in Denmark can achieve, some special days are mentioned: the power from WPPs shared 140% of Denmark’s electricity demand in a particular day in July of 2015, in 15 October of 2016 a 139% wind share was reached and in 22 February of this year (2017) WPPs shared 104% of the domestic power consumption [60] [61] [62] [63]. Denmark is not normally capable to supply their entire needs with wind power if DK1 and DK2 are considered, despite it can be found some periods of the year that this happens if DK1 is focused. This specific days demonstrate that renewables can be a truly alternative to the conventional generators and a solid reference for the green transition that Europe is focusing. The surplus of power generated by these windy days are normally stored in the hydro of the Nordic countries, despite some power can be exported or imported from Germany depending on their congestion in the northern part of the German grid where their WPPs are placed.
The different WPPs online in the system can be implemented with different technologies of the wind turbine-generator. Four standard types of wind turbine topologies are presented below [64] [65]:
Type 1: it is described by a fixed-speed induction generator directly connected to the grid. This type of WT can have pitch angle control or not. This type of generator can absorb reactive power and some stages of capacitor banks are switched to correct the power factor.
Type 2: it is similar to the Type 1, but the turbine is equipped with electronics to vary the rotor resistance. The dynamic of the rapidly rotor resistance control and the slower pitch control work to control the speed, reduce mechanical stress and improve stability during a disturbance.
Type 3: it is a variable speed, double-fed asynchronous generator with rotor-side converter. This allow the system to control the dynamic characteristics by the power converter. They can operate in a wide range of speeds and control active and reactive power independently. The WT can participate in steady-state and dynamic voltage and reactive control and provide frequency control as well. This type and the next one also implement the pitch control to optimize energy capture.
Type 4: it is the model where the generator is full decoupled from the grid by a full converter where the AC grid is switched to DC and then to a controllable AC wave connected to the generator. This allows to completely control the generator speed and the grid side converter separately.
33
For type 3 and 4, although the wind power is considered non-dispatchable because of its variable nature, the reactive power can be dispatchable within the capability of the WT and the WPP level of reactive compensation, what makes these types economically advantageous. This reason together with the increasing control capabilities when adopting these types of technology for WTs will lead to be the most deployed technologies in the future. However, these types do not provide any inertia to the power system since the generator is not directly connected to the grid as it happens for type 1.
In 2015, the capacity of WPPs was divided as 3625 MW onshore and 1272 MW offshore in Denmark [38]. However, the future changes on the Danish system suggest that it will be more increase of power installed on the offshore option. WPP facilities are the cornerstone of the future in the Danish power system and the green transition to a 100% renewable generation by 2050. The offshore wind capacity will increase in a 1400-1600 MW range to attain the 2020 goal of achieve a stable 50% power share by wind. Some new offshore are being under construction to meet this goal: Horns Rev 3 with a capacity of 400 MW and Krieger Flak with a capacity of 600 MW. The wind power capacity will increase till the 2030 goal reaching more than 12 GW in the best scenario made by ENTSO-E and Energinet.dk, presented in the next chapter. The wind expansion also considers 400 MW near-coast offshore installations and 500-600 MW of added capacity on land before 2020. This capacity will come for repowering 1300 MW to 1800 MW new land-based WTs [66]. Relying the power supply in WPPs can cause problems because of the forecasting errors that can deviate the power exchange from its schedule. This forecast errors may compromise the normal operation of the grid leading to balancing problems. Also, in extreme weather conditions, the excess of wind speed can bring to the disconnection of an important amount of wind generation for a meaningful time. These new challenges should be taken into account in the future.
3.2.
Modelling the system interconnections
For this study, the HVDC connections are developed as an emergency block that will be activated if the frequency reaches 50,6 Hz and delivers the available capacity with a ramp rate of 1 pu/s. Also, the activation delay is 100 ms that corresponds to the measurement of the frequency by the HVDC. If the frequency goes below 50 Hz, the power deliver of the HVDC is deactivated [6]. Otherwise, all the available capacity will be dispatched. The chosen ramp rate is achievable given the fact that these connections are fully controlled, so they can achieve this fast deployment of power when the emergency control is activated. The scenario that is simulated in this study is a failure on the AC lines isolating DK1, so the AC lines are not modelled for this study.
![Figure 1.1 Power system operating states [6]](https://thumb-us.123doks.com/thumbv2/123dok_us/1440512.2692918/15.892.189.698.129.426/figure-power-system-operating-states.webp)
![Figure 1.2 Classification of power system stability with instability phenomena by major incidents [9]](https://thumb-us.123doks.com/thumbv2/123dok_us/1440512.2692918/16.892.133.782.129.505/figure-classification-power-stability-instability-phenomena-major-incidents.webp)
![Figure 2.5 Overall requirements for active power production for frequency and voltage fluctuations for conventional power plants [34]](https://thumb-us.123doks.com/thumbv2/123dok_us/1440512.2692918/27.892.193.699.734.1060/figure-overall-requirements-production-frequency-voltage-fluctuations-conventional.webp)
![Table 3.2 Future conventional power generation in Danish power system by 2015 predictions [45]](https://thumb-us.123doks.com/thumbv2/123dok_us/1440512.2692918/35.892.97.814.468.835/table-future-conventional-power-generation-danish-power-predictions.webp)
![Table 3.3 Capacity and type of fuel for CHPs of DK1 [46] [47] [48] [49]](https://thumb-us.123doks.com/thumbv2/123dok_us/1440512.2692918/36.892.197.733.339.795/table-capacity-type-fuel-chps-dk.webp)
![Figure 3.4 Wind power electricity production and wind share in the net electricity production [57] [58]](https://thumb-us.123doks.com/thumbv2/123dok_us/1440512.2692918/39.892.128.769.195.570/figure-wind-power-electricity-production-share-electricity-production.webp)
![Figure 4.1 The four scenarios for the Danish energy system in 2030 [26] [82]](https://thumb-us.123doks.com/thumbv2/123dok_us/1440512.2692918/54.892.223.678.128.468/figure-scenarios-danish-energy.webp)