Advancing Data Envelopment Analysis (DEA) with a Focus on the
Evaluation of Hospital Efficiencies
Kumulative Dissertation
Der Wirtschaftswissenschaftlichen Fakultät
Der Universität Augsburg
Zur Erlangung des Grades eines
Doktors der Wirtschaftswissenschaften
(Dr. rer. pol.)
Vorgelegt von
Sebastian Bernhard Kohl
(Dipl. informationsorientierte VWL)
Erstgutachter: Prof. Dr. Jens O. Brunner
Zweitgutachter: Prof. Dr. Susanne Warning
Drittgutachter: Prof. Dr. Axel Tuma
Vorsitzender der mündlichen Prüfung: Prof. Dr. Marco Meier
2
Table of Contents
1 Introduction and motivation ... 5
2 Summary of the contributions ... 9
2.1 The use of Data Envelopment Analysis (DEA) in healthcare with a focus on hospitals ... 9
2.2 Benchmarking the Benchmarks – Comparing the accuracy of Data Envelopment Analysis models in constant returns to scale settings. ... 12
2.3 Using Data Envelopment to Estimate Hospital Efficiencies – A Teaching Case ... 15
3 Discussion of the contributions ... 17
4 Conclusion ... 20
5 References ... 21
A. Appendix ... 25
A1. The use of Data Envelopment Analysis (DEA) in healthcare with a focus on hospitals ... 25
A2. Benchmarking the Benchmarks – Comparing the accuracy of Data Envelopment Analysis models in constant returns to scale settings ... 26
3
This dissertation is comprised of the following contributions submitted to or published in scientific journals. The specified categories relate to the journal ranking JOURQUAL 3 of the “Verband der Hochschullehrer für Betriebswirtschaft e.V. (VHB)”.
The order of the contributions corresponds to the order of print in this dissertation:
Contribution 1:
Kohl, S., Schoenfelder, J., Fügener, A., & Brunner, J. O. (2019). The use of Data Envelopment Analysis (DEA) in healthcare with a focus on hospitals. Health care management science, 22(2), 245-286.
The printed version is a pre-print of an article published in Health Care Management Science. The final authenticated version is available online at: https://doi.org/10.1007/s10729-018-9436-8 Status: Published in Health Care Management Science, category A.
Contribution 2:
Kohl, S., Brunner, J. O. (2019). Benchmarking the Benchmarks – Comparing the accuracy of Data Envelopment Analysis models in constant returns to scale settings.
Status: Under revision (“revise and resubmit”, May 15, 2019); submitted February 2, 2019. European Journal of Operational Research, category A.
Contribution 3:
Kohl, S. (2019). Using Data Envelopment to Estimate Hospital Efficiencies – A Teaching Case. Status: Under revision; submitted June 28, 2019. MSOR Connections, no category available.
4 Acknowledgement
Special gratitude goes to my academic advisor Prof. Dr. Jens O. Brunner: I am very thankful for all the support and freedom, the inspiring and reassuring discussions, and the trust you showed in me during my PhD studies.
Moreover, I want to thank my colleagues at the chair for fruitful discussions and the provision of help, whenever I needed it. Thank you all for and a great time at the UNIKA-T.
I am very grateful for the support of my parents, who encourage me in every path I take! Thanks as well to my friends, especially those, who helped me to reach the finish line in windy conditions.
5
1
Introduction and motivation
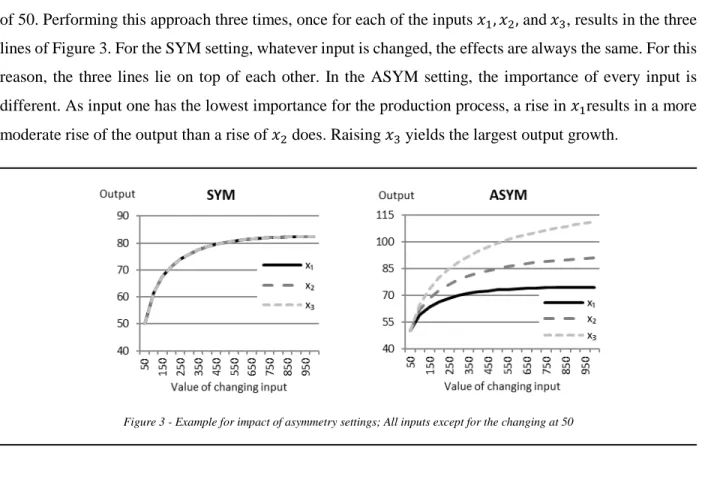
The importance of the health sector for the well-being of a population is undoubted. The economic dimension of the health sector, on the other hand, is often underestimated. This is especially true for the case of Germany, as it is one of the countries with the highest expenditures on healthcare in the world. With 11.3% of the GDP (Gross Domestic Product), Germany is ranked third in the worldwide comparison of health spending behind the United States of America and Switzerland (OECD 2017). Considering only the government/compulsory expenditures as a share of the GDP, Germany is even ranked first. The federal statistical office of Germany reported recently that for the first time in history, the daily health expenditures in Germany had passed the value of 1 billion Euros (Federal Statistical Office of Germany 2018). Issues in healthcare are high on the agenda of newspaper reports and the political discussion, as problems in the nursing sector currently show. Many hospitals and other healthcare institutions are struggling to cover the demand for nursing care. Nurses, on the other side, complain about bad working condition and low wages. Furthermore, the German government passed a law, restricting the number of patients a nurse is allowed to be responsible for, to improve the provision of patients with nursing care (Federal Ministry of Health 2018). All these circumstances will force affected institutions to spend more money on nursing care, causing a further increase of short to medium term expenditures. Due to an aging population as a result of the demographic change, the importance of the healthcare sector will increase additionally in the long run (Federal Statistical Office of Germany 2019b).
Within the healthcare sector, hospitals take a vital position. They are responsible for up to 40% of the healthcare expenditures in a country (OECD 2017). On the supply side, the pressure for hospitals to work cost efficient has increased significantly within the last 20 years. The introduction of the DRG (diagnosis related groups) system is responsible for a considerable part of the effect (Geissler et al. 2011). Hospitals now receive a fixed rate per case. Before the DRG introduction, all the costs of a patient’s stay had been covered. As a result, the length of stay of inpatients has decreased significantly from 9.2 days in 2000 to 6.7 days in 2017 (Federal Ministry of Health 2019). More and more hospitals are closing or merging due to the increased cost pressure. While 2,242 hospitals existed in 2000, the number shrank to 1,942 in 2017 (Federal Statistical Office of Germany 2019a). This effect is evaluated diversly. While some fear for the supply of rural areas, others regard a thinning of the oversized German hospital sector as overdue (Busse & Berger 2018).
Looking at the demand for hospitals in Germany, a substantial rise in hospital admissions is visible. One of the main reasons is the changing age structure of the population (Krämer & Schreyögg 2019). Besides, the emergency departments of hospitals struggle with a growing share of outpatient cases that do not need emergency treatment (Scherer et al. 2017). These patients appreciate the immediate treatment possibilities without the need to apply for an appointment. This behavior worsens the situation of the hospitals as these cases cause congestion in the emergency departments while refunding is relatively low. Strategies have been developed to induce these people to use primary care resources instead (Köster et al. 2016).
6
Overall, the described situation causes pressure for hospitals to work efficiently. The latest edition of Health at a Glance: Europe (OECD/EU 2018) underlines the actuality of the topic. One of the two thematic chapters addresses “Strategies to reduce wasteful spending: Turning the lens to hospitals and pharmaceuticals”. They argue that evidence suggests that up to one-fifth of health spendings is caused by inefficiencies and can be reduced without the performance of the health system. Therefore, the assessment of efficiency and identification of causes for inefficiency is an unavoidable first step. Furthermore, the identification of best practice examples is helpful for the adaption of commendable structures and processes. The scientific literature differentiates between two basic approaches for the estimation of efficiency: Parametric and non-parametric approaches (Jacobs et al. 2006)
While parametric approaches need the specification of the production process in a functional form, non-parametric methods can treat it as a black box. As a consequence, non-non-parametric models are superior in settings with multiple outputs and have prevailed in the estimation of hospital efficiencies (Hollingsworth 2003). The most popular method within the non-parametric approaches is the Data Envelopment Analysis (DEA). It is based on the theories of Farrell (1957) and was originated by the seminal paper of Abraham Charnes, William Cooper, and Edwardo Rhodes (Charnes et al. 1978). The basic CCR model has been named after their initials. The idea of the model is quite simple. Efficiency is expressed by the sum of weighted outputs divided by the sum of weighted inputs. The weights are decision variables in the resulting optimization model and necessary for several reasons. They assure flexibility and fairness of the model, as its most favorable set of weights evaluates every decision making unit (DMU). In doing so, no DMU can complain that its performance is the result of unfair weighting. Furthermore, the system of complete weight flexibility allows the mixture of highly diverse inputs and outputs, which do not have to be measured on the same scale or even in the same unit. The resulting efficiency term is maximized for the DMU under observation and yields the DMU’s efficiency score. The constraint for the optimization problem restricts any DMU in the data sample to receive an efficiency score larger than 1 with the weights of the DMU under observation. Furthermore, weights are restricted to non-negative values. The optimization problem is given in (1).
Parameters & Sets:
𝑛𝑛 Number of DMUs
𝑚𝑚 Number of Inputs
𝑠𝑠 Number of Outputs
7 𝑖𝑖 = 1, … ,𝑚𝑚 Set of inputs with index 𝑖𝑖 𝑟𝑟= 1, … ,𝑠𝑠 Set of outputs with index 𝑟𝑟 𝑜𝑜 ∈1, … ,𝑛𝑛 DMU under observation 𝑥𝑥𝑖𝑖𝑖𝑖 Input 𝑖𝑖 of DMU 𝑗𝑗 𝑦𝑦𝑟𝑟𝑖𝑖 Output 𝑟𝑟 of DMU 𝑗𝑗
Decision variables:
𝑣𝑣𝑖𝑖 Weight for input 𝑖𝑖 𝑢𝑢𝑟𝑟 Weight for output 𝑟𝑟
max∑∑𝑠𝑠𝑟𝑟=1𝑢𝑢𝑣𝑣𝑟𝑟𝑦𝑦𝑟𝑟𝑟𝑟 𝑖𝑖𝑥𝑥𝑖𝑖𝑟𝑟 𝑚𝑚 𝑖𝑖=1 (1a) ∑𝑠𝑠𝑟𝑟=1𝑢𝑢𝑟𝑟𝑦𝑦𝑟𝑟𝑖𝑖 ∑𝑚𝑚𝑖𝑖=1𝑣𝑣𝑖𝑖𝑥𝑥𝑖𝑖𝑖𝑖 ≤1 ∀𝑗𝑗 (1b) 𝑣𝑣𝑖𝑖,𝑢𝑢𝑟𝑟 ≥0 ∀𝑖𝑖,𝑟𝑟 (1c)
A problem of (1) is its solvability, as decision variables appear as well in the nominator and denominator of (1a) and (1b). Therefore, (1) is a nonlinear problem and cannot be solved by the simplex algorithm. To alleviate the solution process, Charnes et al. (1978) used the Charnes-Cooper transformation (Charnes & Cooper 1962), which linearises the problem. They get rid of the denominator in (1a) by fixing it to 1 and adding it as a new constraint. Besides, (1b) is rewritten slightly. The results yield the typical CCR formulation (2). max� 𝑢𝑢𝑟𝑟𝑦𝑦𝑟𝑟𝑟𝑟 𝑠𝑠 𝑟𝑟=1 (2a) � 𝑢𝑢𝑟𝑟𝑦𝑦𝑟𝑟𝑖𝑖 𝑠𝑠 𝑟𝑟=1 ≤ � 𝑣𝑣𝑖𝑖𝑥𝑥𝑖𝑖𝑖𝑖 𝑚𝑚 𝑖𝑖=1 ∀𝑗𝑗 (2b) � 𝑣𝑣𝑖𝑖𝑥𝑥𝑖𝑖𝑟𝑟 𝑚𝑚 𝑖𝑖=1 = 1 (2c) 𝑣𝑣𝑖𝑖,𝑢𝑢𝑟𝑟 ≥0 ∀𝑖𝑖,𝑟𝑟 (2d)
8
To receive an efficiency score for every DMU of a data sample, the mathematical program (2) needs to be solved 𝑛𝑛 times, with every DMU being once the DMU under observation 𝑜𝑜. All efficient DMUs form a convex efficiency frontier, which “envelops” all other data points. This property was name-giving for the Data Envelopment Analysis.
In addition to the efficiency score, an optimal production plan for every DMU is created by DEA. For inefficient DMUs, this plan shows the changes they need to implement in order to become efficient. The DEA model obtains this plan from a linear combination of efficient reference units. This thinking is palpable in the dual problem of (2) (Charnes et al. 1978). The orientation of the optimal production plan can be modified with the mathematical program. (2) represents the CCR model with input-orientation. Input-oriented DEA models provide information on how to remove inefficiency by reducing inputs while keeping outputs constant until the DMU under observation is located on the efficient frontier. Output oriented models work the other way round. They expand the outputs until the DMU is located on the frontier until while holding all inputs at the initial level.
Beginning with the invention of DEA in 1978, a steady increase of publications in the field is visible. This trend has gained additional pace in the last ten years and shows signs of exponential growth (Emrouznejad & Yang 2018). Emrouznejad & Yang (2018) report the enormous number of 10,300 DEA related published journal articles, in total. Currently, around 1,000 new research articles are published every year. Since its foundation, the DEA methodology has been developed in a multitude of directions. While the basic CCR model is responsible for constant returns to scale (CRS) environments, a first model development (Banker et al. 1984) enabled the use of DEA in variable returns to scale (VRS) settings. This BCC model, which received its name again according to the initials of its founders (Rajiv Banker, Abraham Charnes, and William Cooper), is the second of the two basic models in DEA. The concept of constant and variable returns to scale modeling has been adapted to the vast majority of all later model developments. Further model developments try to overcome different shortfalls of the basic models or try to provide additional advancements. AR (assurance region) models, for example, restrict the weights to specific regions (Thompson et al. 1986). SBM (slacks-based measurement) models use the slacks of the dual LP to calculate the efficiency score (Tone 2001). Network DEA models (Färe & Grosskopf 2000) try to shed light on the transformation process from inputs to outputs, while fuzzy DEA models work with imprecise data (Kao & Liu 2000). These models are only some examples to illustrate the variety of DEA modeling. More information on existing DEA models can be found in Cooper et al. (2007).
Among the existing applications, Liu et al. (2013) identified the five areas, which are addressed most frequently. Their research shows the significance of DEA for healthcare, as it is the area with the second most publications. More DEA implementations are only available for the banking sector. Other popular fields of application are agriculture & farm, transportation, and education. According to Liu et al. (2013), within the healthcare field, the vast majority of publications is concerned with hospitals. Other healthcare applications deal with nursing homes, primary care, and care programs. Healthcare is not only one of the
9
sectors with the most applications, but also with the longest application history. The early adaption of DEA for healthcare indicates a natural fit of the method for the sector. The very first healthcare DEA study was conducted by Nunamaker (1983), who evaluated the performance of nursing services. The first hospital application (Sherman 1984) followed only slightly later. Nowadays, authors as Yasar A. Ozcan and Vivian Valdmanis are the leading contributors in the field. Added up, they published more than 70 research articles on the topic of healthcare DEA.
Some research questions drive this dissertation. In the beginning, an inventory should answer the questions: 1) What are the current developments in the field of healthcare DEA?
2) Which DEA models are famous in healthcare applications?
The first contribution addresses these questions. As the answers were as well surprising, as unsatisfactory, the main research question of this dissertation emerged:
3) What can be done to advance DEA in healthcare?
On purpose, the formulation of this central research question is very general. Therefore, not a single answer to the question exists. Instead, a pool of answers and suggestions is provided, which is influenced by all three contributions.
2
Summary of the contributions
This section discusses each contribution of this dissertation. The individual contributions are attached in the appendix.
2.1
The use of Data Envelopment Analysis (DEA) in healthcare with a focus on hospitals
As discussed in the last section, the dimensions of DEA research have reached an immense volume. To keep an overview of all publications is a physical impossibility. This emphasizes the need to divide the body of literature into subsections. The different fields of application seem a natural boundary for these subsections. The overwhelming body of literature, even within such a subsection, causes the need for additional guidance. In the field of healthcare applications, the literature reviews of Hollingsworth et al. (1999), Hollingsworth (2003, 2008), and O’Neill et al. (2008) help to gain an overview over the publications until 2004. Contribution 1 reviews the connecting period from 2005 to 2016 and closes a gap of over ten years of unreviewed publications. Furthermore, due to the increase in publications, the need for guidance in addition to the reprocessing of the existing publications is tangible. Contribution 1
10
addresses this need and acts as a roadmap for lessons learned regarding the conduction of DEA in the healthcare sector, especially for hospital applications.
Contribution 1 includes 262 publications from peer-reviewed journals in the review. As for the whole DEA literature, an increase in healthcare publications over the period under review is visible. Interesting trends are apparent when looking at the geographical focus of the studies. While studies regarding North America tend to stay at a constant level, European and Asian studies are on the rise. Other than at the beginning of the century, the annual publication rate of both regions now exceeds North America’s. Furthermore, studies on the African continent arrived on the scene during the last decade. Nevertheless, their scope stays far behind the other regions. Health Care Management Science, the Journal of Medical Systems, and Health Policy have been identified as the journals with the most publications in the subsection. Furthermore, the research questions scientist are addressing have been reviewed systematically for the first time. Four main research clusters become visible:
Cluster
Number of publications in the period under review Specific Management Questions 100
Pure DEA efficiency analysis 99
New methodology 48
Effects of reform 36
Figure 1: Research question clusters identified by contribution 1
Most studies are concerned with specific management questions. Within this cluster, a variety of different research objectives can be found. Some are trying to examine if quality affects efficiency. Others investigate if certain ownership types foster efficient hospital management or if specialization has a positive effect on efficiency. A large fraction of the publications under review is merely concerned with the conduction of a DEA study. They are summarized in the cluster pure DEA efficiency analysis. They often apply DEA for the first time in a particular country or use a model, which has not been applied to healthcare settings before. All 99 studies of the cluster share the property that the efficiency estimation itself is the reason for publication and not a tool to answer other questions. A surprisingly high number of publications (48) is concerned with the development of new methodology for healthcare settings or use healthcare applications to demonstrate their developments. This high number of methodological advancements in the subsection underpins the relevance and presence of the healthcare field in DEA. Although it is the smallest of the four clusters, a considerable number of publications uses DEA to identify the effects of reforms in the healthcare sector. The count of 36 publications should be valued even higher, as the cluster is far more specific than the others are. Therefore, the identification of the consequences of reforms on the efficiency in healthcare can be regarded as the most pressing single research question in
11
healthcare DEA. Especially publications concerning new methodology and specific management questions have seen considerable growth.
Regarding the methodology of the current publications, contribution 1 identifies and reviews three areas: data selection, model specification, and subsequent techniques. In the first area, the most relevant inputs and outputs are discussed. Little surprising, beds, medical staff, and nurses are the most commonly used inputs, while outpatients, inpatients, and other measures for the number of cases are the outputs on top of the list. These measures are the basis for a meaningful hospital analysis. However, the review shows plenty of other input and output categories, which can be used as inspiration for future studies. Especially the inclusion of quality data has been identified as a relevant topic for future studies. The trend shows an increasing rate of publications using quality measure in their studies. Furthermore, more and more studies that did not include quality measures designate this fact as a drawback and possible improvement for future studies. The increasing availability of the corresponding data will clear the way in this direction. In general, 3.8 inputs and 3.2 outputs have been used on average for a DEA study over the period of review. While a slight increase in the number of inputs is visible, the average number of outputs is decreasing to the same extent.
Apart from reviewing the model settings, contribution 1 raises awareness for some common mistakes concerning data usage. Although widely known as a pitfall, a significant amount of publications still uses an insufficient number of DMUs with regard to the number of inputs and outputs in their study. Different rules on the subject can be found in the literature. Dyson et al. (2001) advocate for the use of at least 2⋅ (#inputs + #outputs) DMUs in order to ensure sufficient discrimination between the units. However, 19 of the studies under review neglected this rule. Another problem in DEA applications concerning the data setup is the mixture of absolute and relative measures (Dyson et al. 2001). Distortion arises because absolute values depend on the size of a unit, while relative values share the same level for all units, independent of their size. In hospital applications, the issue mainly occurs, when bed occupancy rates or mortality rates are included in a study.
With regard to the model selection, contribution 1 found quite surprising results: Despite huge efforts in model development, the basic CCR and BCC models are by far the most utilized models. This seems even more surprising, as issues of these models like the missing integration of slack values into the efficiency score, or the assignment of zero weights are known for a long time.
The use of subsequent techniques is widely spread in DEA. Over two-thirds of the reviewed publications apply one of the techniques. With the term subsequent techniques, we summarize all methods that process DEA efficiency scores. The most common subsequent techniques are the Malmquist index, regression, and bootstrapping. While the use of the Malmquist index is slightly declining, the usage of regression and the bootstrapping has grown significantly. Regression as a second stage analysis is already in use for some time. Bootstrapping of DEA scores, on the other hand, is a more recent development. The publications of Simar & Wilson (2000a, 2000b, 2007) are mainly responsible for the trend to bootstrap DEA scores. The procedure provides two benefits: It enables the calculation of confidence intervals for DEA scores and
12
allows for the calculation of bias-corrected estimates. A bias of DEA scores is known to arise because the data at hand cannot entirely describe the true (unknown) efficient frontier. Efficient units might be missing in the data set, or no DMU has realized theoretically possible efficient production plans in reality. An overestimation of the frontier by all DEA models is the result (Bogetoft & Otto 2011). Because of these benefits, the bootstrapping procedure has become the most significant methodological trend of the last decade.
In order to enhance the quality of DEA studies in healthcare and to keep track of guidelines and other helpful publications, contribution 1 serves as a roadmap for lessons learned. Books and publications aside from the reviewed period or general publications outside the healthcare sector are as well considered. Through the combination of healthcare specific and unspecific publications, researchers find beneficial guidance for the conduction of state of the art DEA studies in healthcare. Finally, contribution 1 discusses relevant topics for future publications. The transformation of DEA from an almost exclusively scientific tool to an accepted instrument, which is deployed in practice, should be the ultimate target for the research community. The development of advanced models might be helpful in this regard. However, as long as the reliability of the results can be questioned, even the most advanced model will not be able to earn a sufficient amount of acceptance. Two ways are imaginable to foster confidence in DEA. The development of a procedure to prove the correctness and reliability of the results would be the most promising way. Another possibility lies in the further investigation of the results. A direct implementation of DEA results, as the calculation of a “projected DMU” or “improved activities” might pretend, is usually not applicable. No unit, independent of the economic sector, can cut down all relevant resources by a significant amount and keep the present output level. However, DEA is able to generate valuable insights by the identification of best practice examples and pointing at resources that are primarily responsible for inefficiency. Studies reporting additional profound process analyses about these resources might help to extend the understanding of DEA results. In addition, publications reporting the opinion of various experts on the results of a DEA study and their utilization possibilities would be of high value for the scientific community and might establish trust in DEA results for practitioners.
2.2
Benchmarking the Benchmarks – Comparing the accuracy of Data Envelopment Analysis
models in constant returns to scale settings.
Despite the considerable effort spent on model development, the basic models are still those, which are applied most commonly in DEA. The CCR model (Charnes et al. 1978) is the basic model for constant returns to scale settings (CRS). Its counterpart for variable returns to scale (VRS) is the BCC model (Banker et al. 1984). The main reason for the high popularity of these models in applications is the lack of knowledge for more suitable options. The purpose of contribution 2 is to fill this gap and provide a benchmark for constant returns to scale settings that makes the accuracy of DEA models comparable. Based on this benchmark, contribution 2 evaluates the performance of different models and assess, if the
13
predominant position of the CCR model is justified. In doing so, the CCR model has to compete against the SBM (Tone 2001) and AR (Thompson et al. 1986) models. Furthermore, the BCC model and a random number generator are evaluated. The performance of these two models is expected to be inferior, as they are no suitable options for the evaluation of CRS data. Nevertheless, useful insights for the validation of the benchmarking procedure can be drawn from them.
The underlying idea of the procedure is to generate artificial data based on a sophisticated data generation process (DGP). For the generation of complete data samples, a Monte Carlo procedure is applied. The DGP utilizes a production function to generate meaningful input and output data for every DMU. Furthermore, the true efficiency score for every DMU is obtainable. The true efficiency score, which is unknown in real life applications, is a vital aspect of the procedure. It allows running a DEA with the input and output data in order to perform a comparison between the generated true efficiency scores and the efficiency scores estimated by the DEA model. A sophisticated DGP is essential for obtaining robust and trustworthy results and the derivation of general guidance. The existing literature in the field exposes several shortcomings in this regard. A sophisticated DGP consists of three key features.
First, a suitable production function is necessary. Most researchers in the field applied a Cobb-Douglas production function. However, due to its limited flexibility, it has been replaced by the Translog production function as state of the art over recent years. Contribution 2 develops the applicability of the Translog production function by providing a way for its utilization in pure CRS settings.
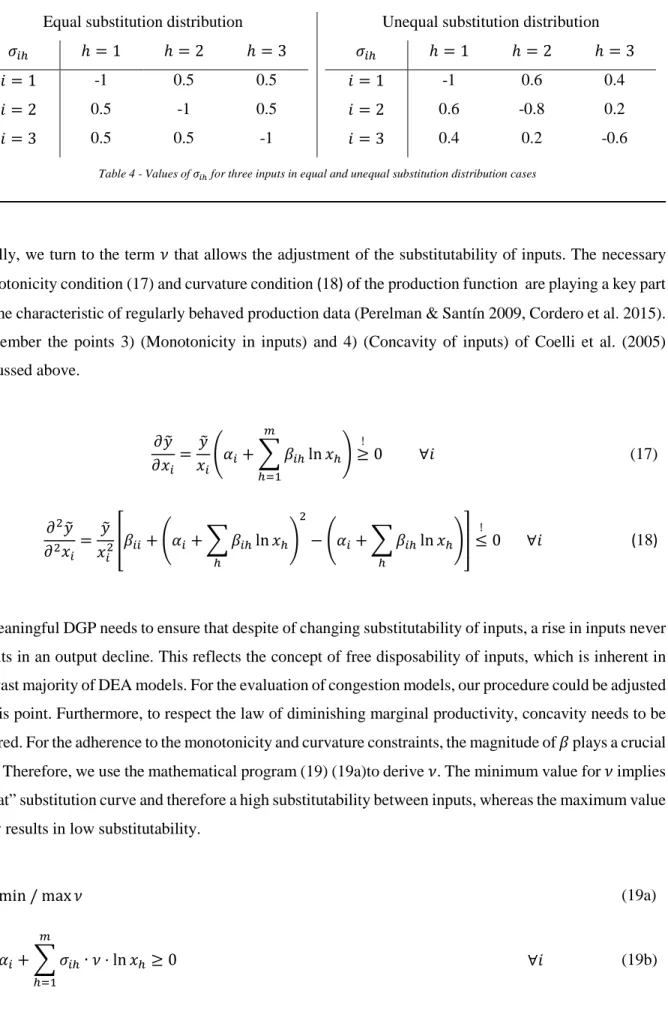
Second, the inclusion of a variety of characteristics, e.g., the number of inputs or the substitutability of inputs, is essential. These characteristics allow for the generation of different production scenarios. Almost all previous publications considered only two to four different characteristics. Contribution 2 uses eight different characteristics to ensure the results are not only valid for very particular production environments. The existing literature is extended in particular with regard to substitution effects. Contribution 2 develops two characteristics to adjust different settings on the substitution between inputs.
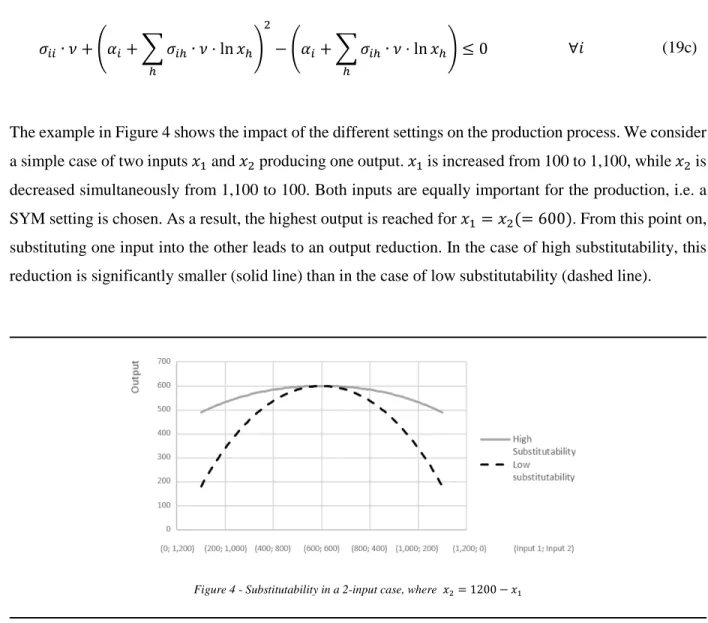
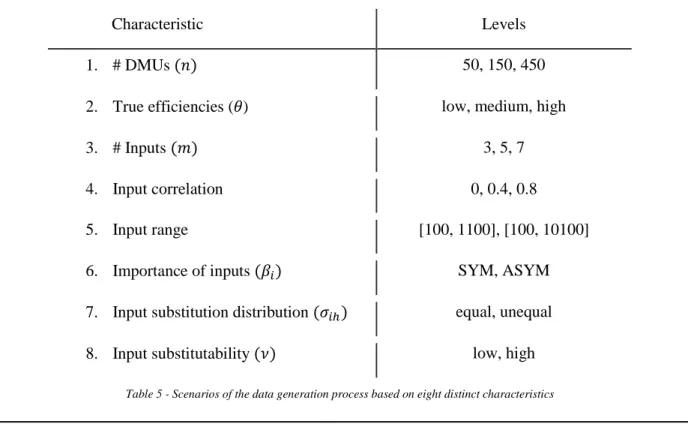
Finally, employing a sufficient number of levels for each characteristic is essential. In doing so, the levels should cover meaningful properties. For example, implementing the number of inputs characteristic with the levels one and two does not adequately reflect the majority of production processes, as these numbers are too small. Hence, the levels three, five, and seven are utilized in contribution 2, to represent a small, midsized, and large production process. Similarly, contribution 2 implements appropriate levels for all characteristics. Setting all characteristics to a certain level results in a specific production scenario. In combining all levels of all characteristics, contribution 2 employs 1,296 different scenarios. This multitude is a significant enhancement of the present literature, as no publication used more than 200 scenarios, so far.
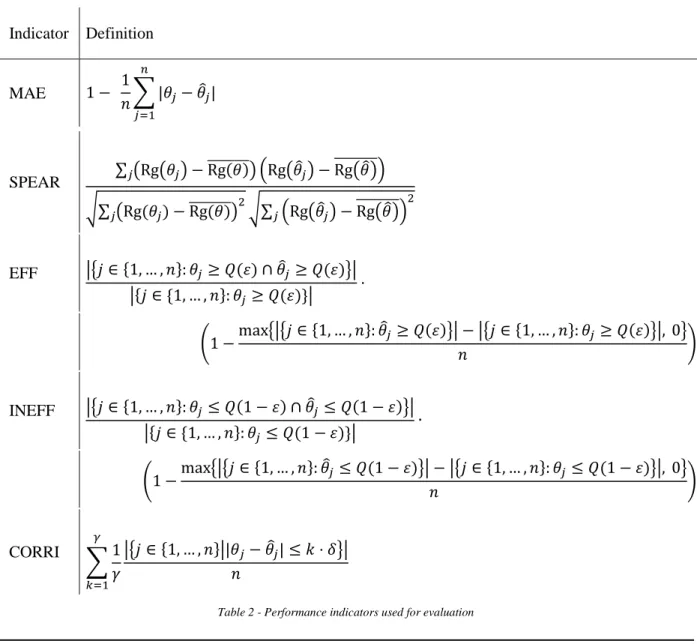
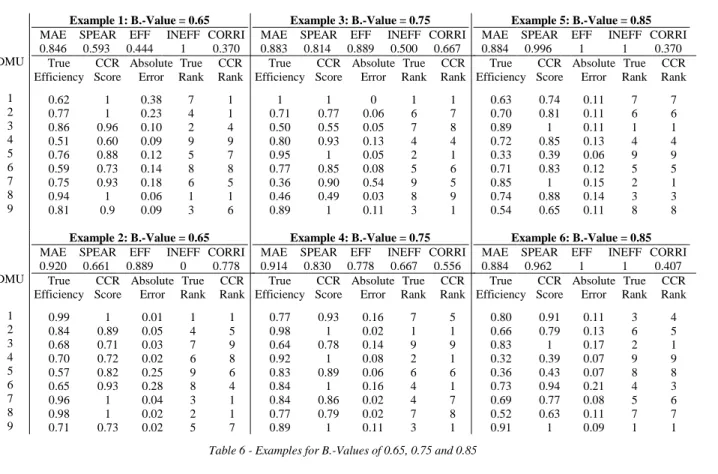
In order to evaluate the scenario results, five different performance indicators are developed. They all compare the true efficiency scores with the estimates of the DEA model under evaluation. Every performance indicator covers a different area. Contribution 2 assess the ability of a DEA model to
14
1. minimize the deviation between the true efficiency score and the estimate 2. reproduce the correct ordering of the DMUs concerning their efficiency 3. identify efficient units
4. identify inefficient units
5. hit a corridor close to the true efficiency score with the estimate
A suitable efficiency estimator should be able to convince in all five dimensions. In order to receive a single benchmark for the accuracy of a DEA model, the average over the five dimensions is calculated. The resulting benchmark is called B.-Score and allows the comparison of the performance of different DEA models.
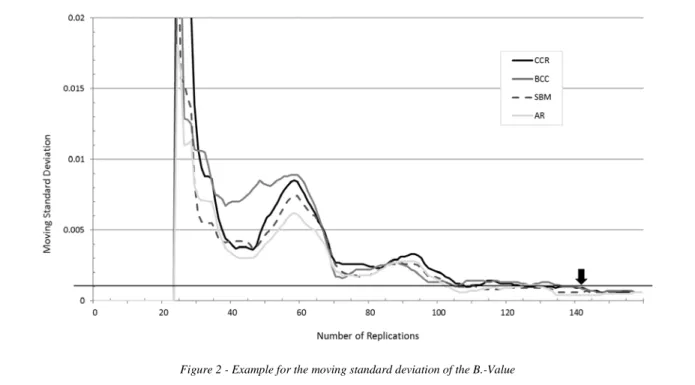
The robustness of results is a crucial issue, as the result of a scenario is stochastic. Therefore, the execution of replications is necessary. A scenario’s final result is the average over all performed replications. Almost all previous studies use a fixed number of replications. Contribution 2 develops a flexible stopping criterion to take account of the increased computational effort due to the extension of scenarios while ensuring the robustness of the results at the same time.
The comparison of the five models with the benchmarking procedure shows an unambiguous dominance of the SBM and AR model over the basic CCR model. As expected, the BCC and random number generator perform worse than the remaining models. The characteristics having the largest effect on the results are the number of DMUs and the number of inputs of a scenario. Using more inputs leads to a decrease in the accuracy of the models. On a similar page, fewer DMUs lead to a deterioration in the accuracy of the models. Both observations are valid for all models analyzed in contribution 2. However, the SBM and AR models present themselves as less vulnerable in adverse scenarios. With regard to all 1,296 scenarios, both models are more robust than the others. Especially the reduced weight flexibility of the AR model seems to decrease the volatility of results.
When analyzing the influence of the number of inputs in more detail, a significant impact of the input correlation characteristic becomes visible. In general, the higher the correlation, the better the accuracy of the DEA models. While only a slight effect of the input correlation in an isolated view is visible, the situation changes significantly, when conducting a combined analysis with the number of inputs. For higher numbers of inputs, the accuracy of all models drops considerably, if no correlation between the inputs exists. Reassuring is the finding, that a slight correlation of 0.35 between the inputs is sufficient to mitigate the effect substantially.
Looking at the performance indicators, the overall results find support in every single performance indicator. Even on this level, the CCR performs always worse than the AR and SBM models. The inferiority of the CCR model in our overall result is therefore not depending on a single shortcoming or indicator definition, but visible over all relevant areas.
As contribution 2 identifies the number of DMUs and the number of inputs as characteristics with the largest impact on the accuracy of a DEA, an investigation of the prominent rule of thumb regarding the
15
usage of inputs and outputs is apparent. Several authors (i.a. Golany & Roll 1989, Dyson et al. 2001, Cooper et al. 2007) emphasized the importance to keep the ratio of DMUs to inputs and outputs at a reasonable level and formulated different rules of thumb. All these authors reason that disregarding the issue leads to insufficient discrimination and correctness of DEA results. Cook et al. (2014) argue that a statistical background for these rules is missing and their implementation often occurs out of convenience. Contribution 2 performs a separate study to elaborate on the subject. This study evaluates in succession different input levels. For every input level, the number of DMUs is examined, which is necessary to reach a predefined B.-Score with the CCR model. This predefined B.-Score represents the minimum accuracy a DEA study should achieve. The study is based on the property of the B.-Score to rise continually with higher DMU numbers. Therefore, an examination of an exact number of DMUs, which is necessary to reach the predefined value, is possible. With the results, contribution 2 can provide the background and reasoning for the utilization of a rule of thumb regarding the use of sufficient DMUs with regard to the number of inputs and outputs. Furthermore, contribution 2 shows that the existing rules of thumb underestimate the number of DMUs, which are necessary to conduct DEA studies of sufficient accuracy. In addition, the results do not support the linear dependency between the number of DMUs and inputs, which the existing rules of thumb assume. Therefore, contribution 2 suggests a new rule of thumb, representing the findings of the study.
2.3
Using Data Envelopment to Estimate Hospital Efficiencies – A Teaching Case
The conduction of meaningful Data Envelopment Analysis studies contains more pitfalls than many researchers are expecting. Contribution 3 provides a teaching case with a hands-on learning experience on the topic of hospital DEA. The teaching case addresses relevant issues regarding data, models, and result improvement. The data set of the case study is based on mid-sized German hospitals and provides a data set containing 70 DMUs. For every DMU, the number of beds, physicians, and nurses as inputs and the number of inpatients and outpatients as outputs are provided. These measures portray the service process of a hospital and are typical for hospital DEA studies. In addition, the Case Mix Index (CMI) and seven quality measures are included for every hospital in the data set. The CMI represents the average case severity of a hospital. It is a standard procedure to adjust the patient cases by the CMI to include the case severity in the analysis. Overall, contribution 3 leads through the process of conducting a DEA study with 15 questions, divided into the sections DEA modeling, data description, and results. While the teaching case mainly addresses junior DEA users, some parts are also of interest for more advanced DEA practitioners. Especially the implementation of the bootstrapping algorithm (Simar & Wilson 2000a) has to be highlighted in this context. The bootstrapping approach is a subsequent method that uses resampling techniques for result verification. It allows the calculation of bias-corrected efficiency scores. Although the inclusion of bootstrapping in DEA studies is more relevant than ever before, researchers often struggle
16
with the implementation, as replicable examples are rare and the existing publications on the subject are not always straightforward.
With regard to the utilized DEA models, the conductor of the case study is concerned with the CCR and SBM model. In doing so, the impact of weights and slacks for the analysis is brought into focus. In this way, the vast number of zero weights, the CCR model assigns, becomes apparent. Furthermore, the super-efficiency model finds utilization in the detection of data outliers. The exclusion of these outliers is essential, as otherwise, the results of the study are likely to be distorted. Besides the outlier detection, the data section addresses as well the treatment of missing values. This issue is widespread for the conduction of DEA studies, as a comprehensive data set hardly ever exists.
Another central component of the case study is the inclusion of quality measures in DEA. In the data section, the conductor of the case study gets to know the different dimensions of hospital quality. The topic is as well part of the modeling section. A rarely applied two-stage procedure is used to include the quality indicators into DEA. In this two-stage procedure, the Helmsman DEA is used in the first stage to create a single quality indicator out of the quality measures at hand. The single quality indicator is then multiplied with the patient cases in order to weight the case number with the quality of the hospital. In the second stage, a regular DEA with the adjusted measures is conducted. The approach has the benefit to prevent the DEA model from excluding quality completely by assigning zero weights. This often occurs, when quality indicators are used as additional outputs in a DEA study. Furthermore, the procedure is not increasing the number of inputs and outputs in the main DEA study. This is in line with the advice of Dyson et al. (2001) to be parsimonious with the number of inputs and outputs.
17
3
Discussion of the contributions
In this section, the research questions posed at the beginning of this dissertation are discussed. The findings of all contributions are brought together to answer these questions.
Research question 1: What are the current developments in the field of healthcare DEA?
Finding the answer to this question is one of the main goals of contribution 1. A first finding is that the trend to apply DEA in healthcare settings, especially in hospital environments, is undaunted. Similar to the overall trend, a significant increase in DEA studies related to the healthcare field is visible. This fact represents a basis for the relevance of this thesis. The geographical origin of the studies, however, changed significantly. The annual number of publications from Europe and Asia now exceeds the one from North America. Furthermore, the African continent is no longer a blank spot for healthcare DEA studies. The examination of the reasons for researchers to conduct healthcare DEA studies exposed two main trends: The analysis of specific management questions and the development of new methodology. The increased use of DEA for the examination of specific management questions is a good sign. It documents the variety of specific fields of application for healthcare DEA and the need for a multicriterial benchmarking method. One of the main subjects in this regard is the effect of quality. These studies explicitly investigate whether the quality of provided services affects as well the unit's efficiency. Furthermore, more and more researchers care about the inclusion of quality indicators in healthcare DEA studies. The ongoing development of the methodology is driven by the apparent shortcomings of the basic models. Although a vast body of publications exists, the doubts in the results of DEA have not vanished. Another development in the field is the utilization of the bootstrapping method in applications. It serves as a tool for bias correction and the calculation of significance intervals for the results. The popularity of the bootstrap is a further expression for the desire to improve the DEA methodology and provide consistent and robust results. Contribution 1 reports a significant increase in the usage of the bootstrap between 2005 and 2016. Finally, a trend to use regression in a second stage of the study is apparent. In doing so, researchers try to understand the coherence of efficiency with environmental factors. Finding the factors that mainly affect a DMUs efficiency allows the provision of more detailed guidance for managers or politicians.
Research question 2: Which DEA models are famous in healthcare applications?
As shown in research question 1, the development of models is one of the primary research purposes in the field. This leads to the question, which models healthcare DEA applications utilize most frequently. The insights of contribution 1 on this issue are quite unexpected. The models with by far the most applications are the basic CCR and BCC models. At the first moment, this finding might seem natural, as the CCR and BCC models are the embodiment of DEA. On second thought, the finding is astonishing, considering the efforts spent on model development for over 40 years. However, as no other model has
18
gained acceptance as a new standard, researchers still apply the basic models. Especially surprising is the gap in utilization, in comparison to all other models. The model utilized most after the basic ones, is the super-efficiency model. It has been applied in 14 out of 262 studies, while the CCR model records 112 and the BCC model 144 applications.
Almost 80% of studies utilize at least one of the two models. Quite rightly, some compare the results of new model developments with the established ones or use multiple models for other reasons. Nevertheless, almost 65% of the publications use only the basic models for the efficiency estimation of their studies. One in four studies is entirely limited to the use of a basic model. Not even subsequent techniques or second stage analyses as Malmquist indices, regression, or bootstrapping find application in these studies. These findings express a deficiency of DEA, as essential developments do not access the actual applications.
Research question 3: What can be done to advance DEA in healthcare?
Research question 3 is the core question of this dissertation and the answers are manifold. All three contributions are used to provide answers to this question.
First, it is essential to stop study misspecifications, where approved rules are existing. By addressing these issues in a literature review (contribution 1) and a teaching case (contribution 3), they are made visible and distributed for a broad audience. Examples are the mixture of absolute and relative data or the usage of an insufficient number of DMUs, considering the number of inputs and outputs. Both problems are known to lead to a distortion of results (Dyson et al. 2001). As studies with these issues get published, even reviewers seem unaware of the problems. Contribution 1 and contribution 3 especially raise the awareness of junior DEA researchers to these issues, as literature reviews and teaching cases are natural starting points into a research area. Contribution 3 also addresses the identification of data outliers and the treatment of missing data. The neglection of these topics leads as well to avoidable study misspecifications.
Second, many helpful guidelines for the conduction of DEA in general, as well as for healthcare DEA, are existing. These encompass lessons learned for several topics, as model usage or the identification of suitable inputs and outputs. The vast body of literature is complicating the knowledge about all these valuable publications. Especially for researchers, who are new to the field, this presents a tough challenge. To gather the information on existing guidelines, contribution 1 provides a roadmap to lessons learned. Third, contribution 1 dedicates a whole section on essential topics for future publications. The enhancement of DEA study quality is the core issue of this section and should raise awareness for the subject. The section addresses two particular paths to foster confidence in DEA studies. One is the creation of a method to assess the accuracy of DEA models. The other is to prove the validity of results by documenting successful result implementations in real cases. By addressing these issues, further research might dedicate more effort on the enhancement of healthcare DEA and pursue these two directions. Fourth, more effort is necessary to represent the service process of hospitals more precisely. The meaningful inclusion of quality indicators in all hospital DEA studies is essential in this matter. Contribution 1 shows that some authors already try to proceed in this matter. However, the share of hospital
19
studies including quality still needs to grow significantly. More importantly, methods that ensure the actual consideration of quality measures need to prevail. Most common is the inclusion of quality indicators as additional output. However, most DEA models can erase the indicator for units with a poor quality performance from the analysis. As a result, using quality parameters as additional outputs can never lead to a decline in efficiency scores. The results of such studies are highly misleading, as DMUs with poor quality might arise with higher scores than without the inclusion of the quality output. Spreading a method, which overcomes this obstacle is one of the goals of contribution 3. The promoted two-stage procedure has two major benefits. First, it allows the calculation of a single quality indicator out of various measures via the helmsman method in the first stage. This facilitates the inclusion of different quality dimensions, while at the same time, the number of outputs is not inflated. Second, the procedure prevents a neglection of quality in the final score through a multiplication of the single quality indicator with the case numbers in the second stage.
Fifth, the usage of the bootstrapping method raises the quality of DEA studies, as it allows for the calculation of confidence intervals and bias correction of results. Contribution 1 promotes the method by showing its increased relevance in healthcare DEA studies. Furthermore, contribution 3 demands the implementation of the bootstrap in the teaching case. By providing an example with a comprehensive explanation of the solution and the corresponding implementation, the hurdle for the use of bootstrapped DEA is lowered. So far, comprehensible examples on the implementation of the bootstrap are rare. Sixth, contribution 3 fosters the understanding of the DEA mechanics in comparing the weight assignment of the CCR and SBM models in detail. With more researchers being aware of the differences, more reasonable conclusions will be drawn from DEA studies. Besides, highlighting the issues of the basic models might encourage more researchers to use advanced models.
Seventh, as concluded in contribution 1, a method to assess the accuracy of DEA models would be extremely beneficial in advancing the DEA methodology. Contribution 2 provides precisely such a system. The invention of the B.-Value enables the judgment of a model’s accuracy based on a single score. In addition, the development of the B.-Rank in contribution 2 facilitates the comparison of models with similar B.-Values. Therefore, the methodology allows the comparison of the accuracy of existing DEA models. Furthermore, researchers inventing new model developments can prove their reasonability with the help of the method. For a start, contribution 2 shows that the CCR results are less accurate in constant returns to scale settings, than these of the SBM and AR model. Due to a slight dominance of the SBM in the B.-Rank and more natural feasibility, the use of the SBM as the new gold standard for DEA is advocated.
Eighth, contribution 2 provides valuable general insights for the applicability of DEA. Delivering information, under which circumstances DEA grants results of satisfying accuracy is a major contribution to the advancement of future studies. In this regard, especially the usage of a sufficient number of DMUs depending on the number of inputs and outputs is of interest. Contribution 2 shows that existing rules on the subject do not assure adequate study quality as the supposed number of DMUs is too low. Furthermore,
20
the linear dependency, existing rules assume, is not supported by the study results. This amplifies the issue in settings with larger numbers of inputs and outputs. Contribution 2 develops a new rule to overcome these shortcomings. Adherence to this rule will advance the quality of future DEA studies significantly.
4
Conclusion
This dissertation is concerned with the advancement of data envelopment analysis, especially for the implementation in hospital settings. It comprises three contributions: The first contribution is a literature review, which fills an unreviewed gap of over ten years and encompasses 262 publications. The second contribution develops a methodology to assess the accuracy of DEA models. The third contribution sets up an advanced teaching case to distribute knowledge on the DEA methodology among researchers and practitioners. After a motivation of the topic at the beginning of this theses, three research questions are derived that guide the dissertation. The findings of contribution 1 concerning research questions 1 and 2 lead the way towards the central topic of this thesis, which is stated in research question 3:
What can be done to advance DEA in healthcare?
The answers to this central question comprise findings of all contributions. Most importantly, the development of a method to compare the accuracy of DEA models is an essential step for the advancement of DEA. For the first time, different DEA models can be compared and evaluated based on a neutral criterion. The benchmarking method allows the judgment of existing models, as well as the trial of new model developments. This procedure allows the formation of new gold standards in DEA, which can replace the basic CCR model. An experimental study in the second contribution shows that the SBM outperforms the CCR model and should be the new standard for the evaluation of constant returns to scale studies. This finding is generally valid for all DEA applications. Its particular relevance for healthcare DEA is supported by the answer to research question 2, which highlights an inadequate representation of sophisticated models in healthcare applications.
One of the answers to research question 1 reveals another main field for advancing healthcare DEA studies: A trend to include quality measures into the analysis has started. The contributions 1 and 3 promote the topic, in order to raise the share of studies considering quality in their analysis. Besides a rising share of studies considering quality, meaningful implementation of quality indicators into the studies is of prime importance. Contribution 3 presents a two-stage approach using a Helmsman DEA in the first stage. Its benefits lie in a suitable inclusion of multiple indicators. Furthermore, it assures that the DMUs cannot evade the evaluation of quality. In doing so, the inclusion of quality parameters via the Helmsman DEA method is not automatically increasing the average efficiency in a data sample, as other conventional methods do. Finally, the method is parsimonious with inputs and outputs, which supports another core finding of this thesis: The adherence to meaningful settings for DEA is without any alternative. In this regard, the setting with the most substantial impact is the restrainment of inputs and outputs with regard to
21
the available DMU number. Contribution 2 underpins the influence of this setting on the accuracy of results and shows that existing guidelines cannot guarantee a sufficient estimation accuracy. Therefore, a new guideline is developed, which ensures a higher quality of results for future studies.
The contributions of this thesis open plenty of possibilities for future research. First of all, the presented benchmarking procedure for the accuracy of DEA models focusses on constant returns to scale settings. An extension of the method to variable returns to scale settings is a natural next step. Furthermore, the models under assessment in the experimental study of contribution 2 are a first selection. Further evaluations can reveal other existing models that outperform the SBM model. Examining a combination of the SBM and AR models, as suggested in Tone (2001) or testing for the best AR restrictions are as well suitable future research projects.
Besides, advancing the development and application of the bootstrap for other models than the CCR is desirable for future research. As the method evolves to become state of the art in DEA, a shift of the standard DEA model to more sophisticated models should not be prevented by missing bootstrapping procedures for these models.
In general, the contributions present encouraging results regarding the accuracy of DEA. Not every DEA model delivers satisfying results, and in some settings, DEA should not be applied at all. However, if sophisticated models are used in an appropriate environment, DEA is a valuable method for supporting decision makers. The contributions of this thesis are meant to advance DEA for healthcare settings and help the methodology to find acceptance and application in actual management support.
5
References
Banker, R. D., A. Charnes, W. W. Cooper (1984). Some Models for Estimating Technical and Scale Inefficiencies in Data Envelopment Analysis. Management Science 30(9) 1078-1092.
Bogetoft, P., L. Otto. Benchmarking with DEA, SFA, and R. Springer New York. New York, NY: Busse, R., E. Berger (2018). Weniger (Standorte, Betten und Fälle) ist mehr (Zugang, Qualität und
Ergebnisse). Standpunkte der Gesundheitsökonomie. In Krankenhauslandschaft in Deutschland: Zukunftsperspektiven-Entwicklungstendenzen-Handlungsstrategien, Böcken, Bühler, Lasserre, Simic, Stock, Henriksen, Knieps, Zich, Jendges and Leber (eds.), Kohlhammer Verlag.
Charnes, A., W. W. Cooper (1962). Programming with linear fractional functionals. Naval Research Logistics Quarterly 9(3-4) 181–186.
Charnes, A., W. W. Cooper, E. Rhodes (1978). Measuring the efficiency of decision making units. European Journal of Operational Research 2(6) 429–444.
Cook, W. D., K. Tone, J. Zhu (2014). Data envelopment analysis: Prior to choosing a model. Omega 44
22
Cooper, W. W., L. M. Seiford, K. Tone. Data envelopment analysis: a comprehensive text with models, applications, references and DEA-solver software. Springer Science & Business Media. :
Dyson, R. G., R. Allen, A. S. Camanho, V. V. Podinovski, C. S. Sarrico, E. A. Shale (2001). Pitfalls and protocols in DEA. European Journal of Operational Research 132(2) 245–259.
Emrouznejad, A., B. R. Parker, G. Tavares (2008). Evaluation of research in efficiency and productivity: A survey and analysis of the first 30 years of scholarly literature in DEA. Socio-Economic Planning Sciences 42(3) 151–157.
Emrouznejad, A., G.-l. Yang (2018). A survey and analysis of the first 40 years of scholarly literature in DEA: 1978–2016. Socio-Economic Planning Sciences 61 4–8.
Farrell, M. J. (1957). The Measurement of Productive Efficiency. Journal of the Royal Statistical Society. Series A (General) 120(3) p 253-290.
Federal Ministry of Health. (2018, Oct 5). Verordnung zur Festlegung von Pflegepersonaluntergrenzenin pflegesensitiven Bereichen in Krankenhäusern. Pflegepersonaluntergrenzen-Verordnung - PpUGV. Retrieved from https://www.bundesgesundheitsministerium.de/personaluntergrenzen.html.
Federal Ministry of Health. (2019, Apr 12). Krankenhausfinanzierung. Retrieved from https://www.bundesgesundheitsministerium.de/krankenhausfinanzierung.html.
Federal Statistical Office of Germany. (2018, Feb 15). Gesundheitsausgaben pro Tag überschreiten Milliardengrenze. Retrieved from
https://www.destatis.de/DE/Presse/Pressemitteilungen/2018/02/PD18_050_23611.html.
Federal Statistical Office of Germany. (2019a, Jun 21). Anzahl der Krankenhäuser in Deutschland in den Jahren 2000 bis 2017. Retrieved from
https://de.statista.com/statistik/daten/studie/2617/umfrage/anzahl-der-krankenhaeuser-in-deutschland-seit-2000/.
Federal Statistical Office of Germany. (2010b, Jul 14). Prognostizierte Entwicklung der Altersstruktur in Deutschland von 2010 bis 2050. Retrieved from
https://de.statista.com/statistik/daten/studie/163252/umfrage/prognose-der-altersstruktur-in-deutschland-bis-2050/.
Geissler, A., D. Scheller-Kreinsen, W. Quentin, R. Busse (2011). Germany: Understanding G-DRGs. In Diagnosis-related groups in Europe. Moving towards transparency, efficiency and quality in hospitals, Busse, Alexander Geissler, Wilm Quentin and Miriam Wiley (eds.), Maidenhead, England, Open University Press.
Golany, B., Y. Roll (1989). An application procedure for DEA. Omega 17(3) 237–250.
Hollingsworth, B. (2003). Non-parametric and parametric applications measuring efficiency in health care. Health Care Management Science 6(4) 203–218.
Hollingsworth, B. (2008). The measurement of efficiency and productivity of health care delivery. Health Economics 17(10) 1107–1128.
23
Hollingsworth, B., P. J. Dawson, N. Maniadakis (1999). Efficiency measurement of health care: a review of non-parametric methods and applications. Health Care Management Science 2(3) 161–172. Jacobs, R., P. C. Smith, A. Street. Measuring efficiency in health care: analytic techniques and health
policy. Cambridge University Press. :
Kao, C., S.-T. Liu (2000). Fuzzy efficiency measures in data envelopment analysis. Fuzzy sets and systems 113(3) 427–437.
Köster, C., S. Wrede, T. Herrmann, S. Meyer, G. Willms, A. Seyderhelm, T. Seeliger, B. Broge, J. Szecsenyi (2016). Ambulante Notfallversorgung. Analyse und Handlungsempfehlungen. Göttingen: AQUA – Institut für angewandte Qualitätsförderung und Forschung im Gesundheitswesen GmbH. Krämer, J., J. Schreyögg (2019). Demand-side determinants of rising hospital admissions in Germany:
the role of ageing. The European Journal of Health Economics.
Lewis, H. F., T. R. Sexton (2004). Network DEA: efficiency analysis of organizations with complex internal structure. Computers & Operations Research 31(9) 1365–1410.
Liu, J. S., L. Y. Y. Lu, W.-M. Lu, B. J. Y. Lin (2013). A survey of DEA applications. Omega 41(5) 893– 902.
Nunamaker, T. R. (1983). Measuring routine nursing service efficiency: a comparison of cost per patient day and data envelopment analysis models. Health services research 18(2 Pt 1) 183.
O’Neill, L., M. Rauner, K. Heidenberger, M. Kraus (2008). A cross-national comparison and taxonomy of DEA-based hospital efficiency studies. Socio-Economic Planning Sciences 42(3) 158–189. OECD (2017). Health at a Glance 2017. OECD Indicators. OECD Publishing, Paris.
http://dx.doi.org/10.1787/health_glance-2017-en.
OECD/EU (2018). Health at a Glance: Europe 2018. State of Health in the EU Cyle. OECD Publishing, Paris. https://doi.org/10.1787/health_glance_eur-2018-en.
Scherer, M., D. Lühmann, A. Kazek, H. Hansen, I. Schäfer (2017). Patients Attending Emergency Departments. Deutsches Arzteblatt international 114(39) 645–652.
Sherman, H. D. (1984). Hospital Efficiency Measurement and Evaluation: Empirical Test of a New Technique. Medical Care 22(10) 922–938.
Simar, L., P. W. Wilson (2000a). A general methodology for bootstrapping in non-parametric frontier models. Journal of Applied Statistics 27(6) 779–802.
Simar, L., P. W. Wilson (2000b). Statistical Inference in Nonparametric Frontier Models: The State of the Art. Journal of Productivity Analysis 13(1) 49–78.
Simar, L., P. W. Wilson (2007). Estimation and inference in two-stage, semi-parametric models of production processes. Journal of econometrics 136(1) 31–64.
Thompson, R. G., F. D. Singleton Jr, R. M. Thrall, B. A. Smith (1986). Comparative site evaluations for locating a high-energy physics lab in Texas. interfaces 16(6) 35–49.
Tone, K. (2001). A slacks-based measure of efficiency in data envelopment analysis. European Journal of Operational Research 130(3) 498–509.
25
A.
Appendix
A1.
The use of Data Envelopment Analysis (DEA) in healthcare with a focus on hospitals
Kohl, S., Schoenfelder, J., Fügener, A., & Brunner, J. O. (2019). The use of Data Envelopment Analysis (DEA) in healthcare with a focus on hospitals. Health care management science, 22(2), 245-286.
The final authenticated version is available online at: https://doi.org/10.1007/s10729-018-9436-8 Status: Published in Health Care Management Science, category A.
26
A2.
Benchmarking the Benchmarks – Comparing the accuracy of Data Envelopment Analysis
models in constant returns to scale settings
Kohl, S., Brunner, J. O. (2019). Benchmarking the Benchmarks – Comparing the accuracy of Data Envelopment Analysis models in constant returns to scale settings.
Status: Under revision (“revise and resubmit”, May 15, 2019); submitted February 2, 2019. European Journal of Operational Research, category A.
27
Sebastian Kohla,b, Jens O. Brunnera,b,*
a Chair of Health Care Operations/Health Information Management, Faculty of Business and Economics,
University of Augsburg, Universitätsstraße 16, 86159 Augsburg, Germany
b University Center of Health Sciences at Klinikum Augsburg (UNIKA-T), Neusässer Straße 47, 86156
Augsburg, Germany
* Corresponding author: [email protected], +498125986446, ORCID 0000-0002-8793-955X
Benchmarking the Benchmarks – Comparing the accuracy of
Data Envelopment Analysis models in constant returns to scale
28
Abstract
Despite the massive use of Data Envelopment Analysis (DEA) models in scientific applications, no publication cared about identifying the DEA model, which is able to provide the most accurate efficiency estimates, so far. We develop an established method based on a Monte Carlo data generation process to create artificial data. As we use a Translog production function instead of the commonly utilized Cobb Douglas production function, we are able to construct meaningful scenarios for constant returns to scale. The generated data is then assessed by five different DEA models. Finally, the quality of the resulting efficiency estimates is evaluated by five performance indicators and summarized in benchmark scores. With this procedure, we can postulate general statements on parameters that influence the quality of DEA studies in a positive/negative way and determine which DEA model operates in the most accurate way for a range of scenarios. Here, we can show that the Assurance Region and Slacks-Based-Measurement models outperform the CCR (Charnes-Cooper-Rhodes) model in constant returns to scale scenarios. We therefore recommend a reduced utilization of the CCR model in DEA applications.
29
1
Introduction
From the invention of DEA in 1978 (Abraham Charnes, William Cooper, & Rhodes, 1978) a continuous growth in applications and model developments can be explored (Emrouznejad & Yang, 2018). Nowadays, it is extremely hard to get an overview over the whole range of DEA models. As a comparison of the performance of different DEA models is missing in the current literature, it is difficult to choose a proper model for an application. A recent literature review in the field of healthcare (Kohl, Schoenfelder, Fügener, & Brunner, 2018) revealed a very predominant position of the basic models (CCR & BCC) in applications. On the one hand, this fact is surprising, as the basic models struggle with known problems as slacks and zero weights (WilliamW. Cooper, Ruiz, & Sirvent, 2011; Pedraja-Chaparro, Salinas-Jimenez, & Smith, 1997). On the other hand, it is the obvious implication of a lack of knowledge regarding options that are more suitable. At the bottom line, the uncertainty about the accuracy of the efficiency estimates of DEA models and the model that yields the best results (for certain circumstances) is the biggest issue of DEA. From our point of view, it is the crucial point that prevents DEA from leaving the scientific stage and finding actual application by politicians, economists, and managers.
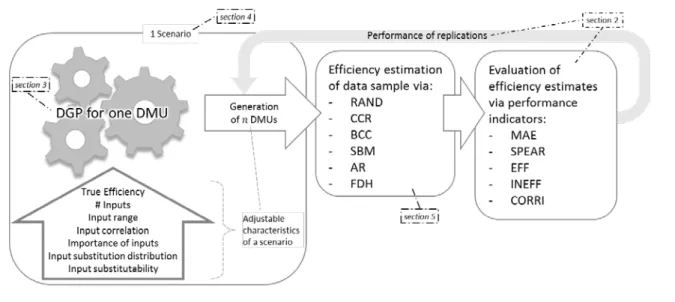
A judgement of the quality of DEA estimates in real data applications however is not possible, as the true efficiency values are unknown. To overcome this obstacle, we generate artificial data, where the true efficiency of every decision-making unit (DMU) is known. Therefore, it is possible to compare the estimates from different DEA models with the corresponding true values and make statements on the quality of the models. In order to derive meaningful conclusions, two aspects for the generation of artificial data play a key role. First, a sophisticated Data Generation Process (DGP) is necessary to create reasonable data for the DMUs. Second, the consideration of a multitude of different scenarios is essential to derive generally valid results. By respecting both aspects, the generation of meaningful data is possible via a Monte Carlo Simulation process. Figure 1 depicts the whole process of our procedure. All parts of the process will be described in detail in the upcoming sections.
30
Figure 1 - The process of Benchmarking the Benchmarks for one scenario
Although no paper had the goal to identify the best DEA model so far, Monte Carlo simulated data has already been used to evaluate certain features of DEA. Table 1 gives an overview of these studies and shows main characteristics as production function used, number of replications, inputs, outputs etc. The identification of the best DEA model however, has not been the goal of a study, yet. Furthermore, both the DGP, as the scenario variety show significant room for improvement. As Table 1 shows, most papers employed only the very restricted Cobb-Douglas (CD) production function in their DGP (Cordero et al. 2015). Siciliani (2006) for example criticize the CD for its inflexibility regarding input substitution elasticity and scale effects. Over the last years, the Translog production function (TL) has emerged as a reasonable alternative. It is a generalization of the CD and allows for the creation of more realistic data. Therefore, we use the TL for the DGP in this paper. The number of inputs in nearly all studies is set too low, as the literature review of Kohl et al. (2018) exhibits a median of 4 inputs over 262 DEA applications in hospital settings. Furthermore, most studies only use one setting for the input number. In general, too little attention has been paid on the generation of a widespread range of scenarios. This is as well reflected by the observation, that most studies only change three or less characteristics in their DGP
31 A u th o r P ro d u ct io n F un ct ion ap ar t fro m C D # R ep li cat io n s # I n pu ts # O u tp u ts # S cen ar io s # C h ar ac ter is ti cs t o g en er at e s cen ar io s A d ju sta b le S u b sti tu ti o n E ff ec ts fo r C R S E v al ua te d D E A m o d el s ap art fro m CC R/ BC C C o m p ar is o n w it h p ar am et ri c m o d el s?
Banker et al. 1993 -* 5 2 1 128 4 No - Yes Banker et al. 1996 -* 25 2 1 48 4 No - Yes Pedraja Chaparro et al. 1997 - ≥6 1-6 1 24 2 No AR No Smith 1997 - ≥125 2-6 1 20 2 No - No Yu 1998 CRESH 25 3 1 21 2 Yes BM Yes Zhang & Bartels 1998 - 5-100 2 1 80 3 No - No Pedraja-Chaparro et al. 1999 - ≥100 2-20 1 190 3 No - No Resti 2000 - N/A 2 3 6 2 No - Yes Holland & Lee 2002 - 1,000 2 1 24 3 No FGK No Ruggiero 2007 - 100 2 1 20 2 No RM Yes Van Biesebroek 2007 -** 50 2 1 9 3 No - Yes Perelman & Santín 2009 TL 100 2 2 12 2 No - No Krüger 2012 TL, CES 1,000 2 1 144 7 Yes (for CES) FDH Yes Cordero et al. 2015 TL 1,000 3 1 28 3 No - No * A piecewise CD is used ** CD is used as output constraint in a NPV maximization model over time
CRESH = Constant Ratio of Elasticity of Substitution, Homothetic; TL = Translog; CES = Constant Elasticity of Substitution AR = Assurance Region; BM = Banker and Morey model; FGK = Färe, Grosskopf, Kokkelenberg model; RM = Russell measure; FDH = Free disposal hull
Table 1 - Literature of DEA evaluations via Monte Carlo simulated data
Most studies in the field tried to explore properties of the basic DEA models (Smith 1997, Zhang & Bartels 1998, Pedraja-Chaparro et al. 1999, Holland & Lee 2002). Very popular are as well comparisons between the basic DEA and parametric models. The consideration of DEA models apart from the basic CCR and BCC models is rather sparse. Only about one third of the studies is considering an alternative DEA model at all and none has considered more than one so far. The robustness of results is another issue with regard to previous papers. As the DEA estimators depend on the random data, the conduction of replications for each scenario is indisputable. Krüger (2012) criticizes in this context the low number of replications of many studies. The number of replications varies significantly between studies in a range from 5 to 1,000 (see Table 1).
The purpose of this paper is to fill the gap on the uncertainty of the accuracy of DEA models and provide a procedure to make the accuracy of DEA models comparable. We bring the reliability of DEA results into question and show that the environment of a DEA study has a high influence on the accuracy of the estimation results. Light is shed on the “blackbox” of DEA that should raise the awareness that its results