• No results found

A Constructive Representation of Univariate Skewed Distributions

N/A
N/A
Protected

Academic year: 2021

Share "A Constructive Representation of Univariate Skewed Distributions"

Copied!
25
0
0

Loading.... (view fulltext now)

Full text

Figure

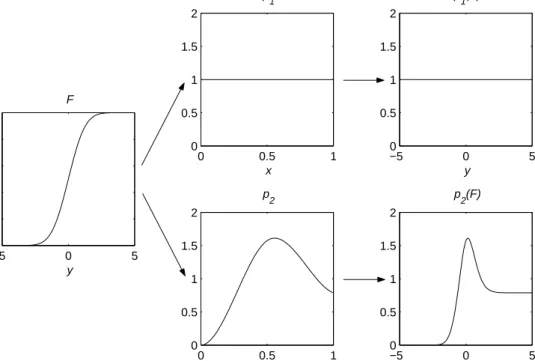
Figure 1: Effect of two distinct skewing mechanisms.
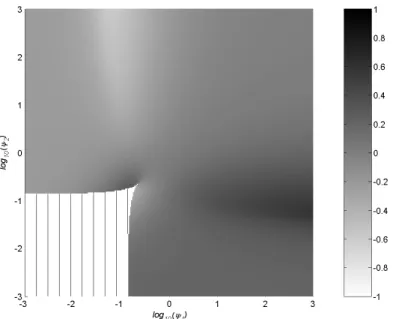
Figure 2: Grayscale plot of AG for Beta-Normal distributions with varying ψ. Values in the lower left corner of the plot, with vertical hatching, correspond to bimodal Beta-Normal distributions.
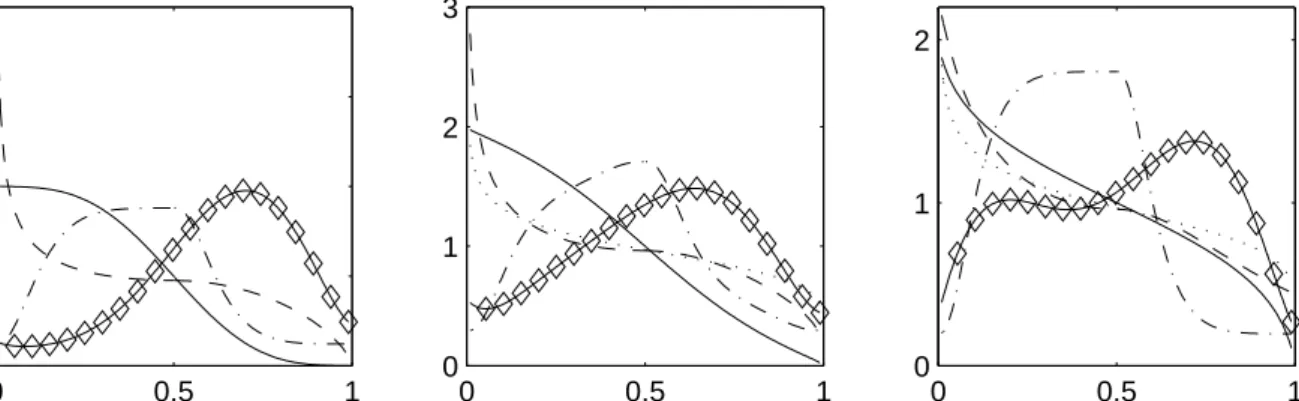
Figure 3: Densities p for each of the skewing mechanisms leading to three levels of AG skewness: 0.2 (left column), 0.5 (middle columns) and 0.8 (right column), for Normal (top row), Logistic (middle row) and t 2 (bottom row)
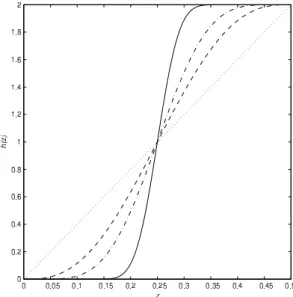
Figure 4: Illustration of the definition of g(x|δ).
+7

References

Related documents