T h e G r a n T m a k i n G r e p o r T
Foundation and Corporate Giving
in the San Diego Region
Mission Statement
Our mission is to connect, educate, develop and inspire a diverse group of foundations and corporations to stimulate effective philanthropy in the San Diego region.
Additional sponsorship for this report was graciously provided by
T h e G r a n T m a k i n G r e p o r T
Foundation and Corporate Giving in the San Diego Region
This report is a collaboration between San Diego Grantmakers and the
University of San Diego’s Caster Family Center for Nonprofit Research.
Mission Statement
The mission of the Institute for Nonprofit Education and Research is to educate leaders and advance best practices in the nonprofit and philanthropic community through academic excellence, applied learning, and research that examines issues of strategic importance to the sector. The Institute houses the Caster Family Center for Nonprofit Research.
Report Steering Committee
Carole Fish, Consultant
Association of Fundraising Professionals Judy Forester, CEO
LEAD San Diego
Todd Gloria, District Director (Former) US Congresswoman Susan Davis Gregory Hall,Senior Program Officer The California Endowment Nancy Jamison, Executive Director San Diego Grantmakers
Beth Jarosz, Research Analyst SANDAG
Nick Macchione, Director
San Diego County Health and Human Services Tim McCarthy, Treasurer
McCarthy Family Foundation Judy McDonald, Trustee Parker Foundation Ron Phillips, Vice President Northern Trust
Gina Rogers, Board Member SD Social Venture Partners
Anna-Marie Rooney, Vice President of Marketing The San Diego Foundation
Charlene Seidle,Vice President Jewish Community Foundation Pam Smith, Deputy Director
San Diego County Health and Human Services Carol Williams, Director of Community Impact United Way of San Diego
Report Authors
Laura Deitrick, MA Robert Donmoyer, PhD Melanie Hitchcock, MSResearch Assistants
Audrey Barrett, PhD Heather Carpenter, MMNA Susan HeiligTable of Contents
Executive Summary 2
Introduction 4
By Nancy Jamison, Executive Director, San Diego Grantmakers
Section 1 — Definitions, Methods, 5 and Data Limitations
Section 2 — Overview of Organized 7 Philanthropy in San Diego
Section 3 — Funding Priorities 10 Section 4 — A Closer Look at 14 San Diego’s Community Foundations
Section 5 — United Way 17 Section 6 — Corporate Giving 18
Special Thanks
San Diego Grantmakers and the Caster Family Center for Nonprofit Research extend special thanks to the Westreich Foundation for its continued support of both organizations. Additionally we thank David Murray and Foundation Search, Bryan Winke Design, Beth Jarosz and SANDAG, Tim McCarthy, and Lori Finch for their additional work on this report.
Executive Summary
This study focused on philanthropic organizations that are engaged in organized grantmaking in San Diego County. The bulk of the organizations studied are classified as private foundations; data that describe other important grantmaking organizations—i.e., San Diego’s community foundations, selected corporate giving programs, and the United Way of San Diego—also were analyzed. Key findings are summarized below.
Private Foundations
Ninety-four percent of San Diego’s private foundations hold assets of less than $10 million. The majority, 53 percent, hold assets of less than $500,000. Seventy-eight percent of the region’s private foundations were established (received tax-exempt status) after 1990 and nearly 50 percent of those were incorporated after 2000.
Between 2001 and 2005, San Diego experienced an increase in the assets of its private foundations of 14 percent. Despite this growth, the amount of total giving by private foundations declined by 14 percent over that same time period. The reasons for this apparent disparity are unclear at this time. Further research on this issue is warranted.
Regional Comparisons
When combined, San Diego’s private and community foundations have considerably fewer assets ($2.29 billion) than the assets reported by foundations in California’s two other major cities, San Francisco ($31.3 billion) and Los Angeles ($34.7 billion). Differ-ences are also evident when the assets of San Diego’s private foundations are compared to private founda-tion assets in other United States cities that, in other respects, could be considered demographically similar to San Diego.
Grantmaking
(Private and Community Foundations Combined)Higher education, human services-related nonprofits, and religion-related nonprofits received the highest proportion of San Diego-based foundation funding during the year that was studied.
San Diego-based foundations directed 28 percent of their grantmaking dollars to nonprofits located outside of the region.
Non-San Diego-based foundations contributed nearly half ($205,120,195) of the total grant dollars received by regional nonprofits. Higher education, human services, and health-related nonprofits received the largest percentages of these dollars.
Community Foundations
Two organizations accounted for 92 percent of the assets held by San Diego’s community foundations in 2006: The Jewish Community Foundation of San Diego ($224 million) and The San Diego Foundation ($484 million).
Eighty percent of the dollars granted by San Diego’s 12 community foundations were made to organizations located within San Diego County.
Arts and community development-related nonprofits received a larger percentage of grant dollars from community foundations than from the overall foundation community.
The United Way
Though not officially classified as a foundation or corporate giving program, the United Way of San Diego contributed over $17 million to qualified nonprofits in 2006.
Through their discretionary Community Fund, United Way of San Diego awarded $3.4 million to local nonprofits.
Over 90 percent of donor-designated dollars gathered through their workplace giving programs were also contributed to nonprofit organizations within the county.
Corporate Philanthropy
Representatives from 37 of San Diego’s largest companies responded to a survey for this report. Seventy-five percent of those respondents reported that each of their companies’ corporate giving programs contributed more than $100,000 to nonprofit organizations in 2006. Seven of these representatives reported corporate giving in excess of one million dollars.
Despite the recent downturn in the economy, almost 28 percent of the respondents stated that their companies’ corporate giving was likely to increase during the next two years, while 62 percent predicted that giving levels would remain the same. Only slightly more than 10 percent predicted that giving levels would decrease. Forty percent of the survey respondents reported that corporate giving to environmental groups was likely to increase during the next two years.
Nearly three quarters of the respondents indicated that their corporations systematically established funding priorities to guide their corporations’ charitable giving. Unlike the private and community foundations studied throughout the report, corporations were more likely to fund K-12 education than higher education nonprofits.
The South Bay and East County received the lowest percentages of dollars from the 37 corporations that responded to the corporate-giving programs survey.
San Diego Grantmakers and the University of San Diego’s Caster Family Center for Nonprofit Research share a belief in the importance of strengthening and expanding effective philanthropy to improve the quality of life in our region. With greater strategic philanthropic investments, our community’s nonprofit organizations will be better able to serve the people of San Diego.
All of us have benefitted in significant ways from the work of nonprofits, and therefore have felt the impact of the philanthropic organizations that support them. While this report covers numerical data about
philanthropy in our region, the numbers are really just a reflection of the lives of San Diegans: those giving, serving and receiving the support of San Diego’s 9,000 plus nonprofits.
The type of charitable giving addressed here is often referred to as grantmaking or organized philanthropy. It is a critical type of charitable giving and is worthy of study. However, it is not the only type, nor even the largest type. In fact, the vast majority of donations made to nonprofits here, and across the nation, are from individuals. According to Giving USA 2008, 82 percent of all nonprofit support comes from individuals and charitable bequests, 12 percent from foundations and 5 percent from corporations.1 It is important to
note that while the contributions of individuals dwarf that of the foundations and corporations studied here, individual giving is not the focus of this report. There are additional key types of support also not covered here: thousands of individual or employee volunteer hours, the growing number of businesses providing “in kind” gifts of products or services, government grants and contracts, and fees for services (e.g. event tickets, membership dues, hospital bills, etc.).
That said, foundations and corporations are extremely influential in the philanthropic landscape. The nature of their activities helps define the culture of
philanthropy in a region, and they are looked to by community, nonprofit and government leaders as key funders and partners in weaving the fabric of our civil society. The people who work and volunteer at foundations and corporations (e.g. community relations/corporate giving staff, foundation staff, trustees and board members) are often engaged in very thoughtful philanthropy, paying close attention to the impact of their investments. Their reasons for giving may vary in that corporations pursue both community and business goals, family foundations often try to pass philanthropic values to future generations, and
independent foundations may be more narrowly focused on mission and donor intent. Whatever the reason, their work is alike in that it is grounded in the passion and strategy that are the underpinnings of high-impact philanthropy.
This report is meant to begin a conversation that will lead to informed action. Much detailed analysis on the part of the USD research team went into ensuring that the foundation data was accurate, the grants were properly coded, and as many corporations as possible were contacted. Ultimately, this analysis will be meaningful only if our community makes use of the findings.
The overriding questions that this research leads us to ask are how can our community leverage our growing philanthropic resources, inspire more giving (both locally and nationally), and be strategic in matching community needs with community support? This is particularly true now in the face of our nation’s difficult economy — where demand for services is growing while nonprofit funding may decline based on reduced government dollars and diminished foundation, corporate and personal wealth.
Statistics lead to discussion, and discussion should lead to informed action. We look forward to continuing to engage with leaders in the nonprofit sector and the
1Giving USA, a publication of Giving USA Foundation™, researched and written by the Center on Philanthropy at Indiana University.
broader community about how to take grantmaking to the next level in the San Diego region.
Below, we identify some of the issues uncovered by the study that we believe should lead to action, and possibly further research. We trust that readers of the report will identify others.
Potential Next Steps
• Most of the new foundation growth is in small, typically unstaffed, family foundations. There has also been growth in the popularity of community foundations, donor advised funds and giving circles (donors that pool funds and give together).2 How can we best help these types of philanthropists to direct their funding to the areas of San Diego in most need and at the same time honor their individual interests and intent?
• While this study focuses on the corporate giving of larger firms, we know that in fact there are very few Fortune 500-level companies located in our region, but there are many small and medium-sized firms. Are there opportunities to link them to the broader philanthropic community and better engage them in corporate philanthropy? • Geographically, foundation grant dollars are being dispersed throughout most parts of the county. However, some areas in the South Bay as well as North and East County are receiving less grant dollars than their neighbors. At the same time, San Diego’s largest corporations are reporting that they are providing the most philan-thropic support to central and northern parts of the county. What lessons can we draw from this information that might help shift giving to other parts of the region that may be in need of philanthropic funding?
• We see that 28 percent of giving by foundations located here leaves the San Diego area. Are there pathways for inspiring and motivating more of our local donors and organizations to invest right here in our community?
• More than half of the private foundation grants received by our nonprofits come from foundations located elsewhere in our state and nation. What can we do to develop the kind of nonprofit sector that will attract even more philanthropic investments from around the country?
• Generally speaking, while San Diego is not a region with many large corporate headquarters or sizeable private, staffed foundations, it is clear from this report that we have significant numbers of generous individuals who have formed family foundations, given through their community foundations, or utilized the United Way
of San Diego to facilitate their philanthropy. We also have some very generous corporations. How can we inspire more individuals and businesses to join those that are already giving?
Section 1 — Definitions, Methods,
and Data Limitations
This study focused on philanthropic organizations that are engaged in organized grantmaking in San Diego County. The majority of these organizations, both nationally and locally, are defined for legal purposes as private foundations. Philanthropic organizations that fall under the private foundation category include independent foundations, family foundations, operating foundations, and corporate foundations. The study also focused on two other types of organizations that engage in foundation-like grant making but are legally classified as public charities. These two groups are (1) community foundations that are funded by many separate donors, typically for the benefit of residents of a specific geographic area or a specific charitable cause, and (2) the United Way of San Diego County. The report concludes by discussing one other highly significant type of organized
grantmaking: corporate giving programs that are not primarily administered by formally established corporate foundations.
This report does not discuss charitable giving by individuals or grantmaking by local, state, and federal agencies. Both individual giving and governmental grantmaking provide vital support for nonprofit organizations in San Diego, but they are not included in the scope of this investigation.
Data for the bulk of this report—i.e., all sections except the section on corporate giving—came from a wide variety of publicly available sources including: the National Center for Charitable Statistics at the Urban Institute (NCCS); Foundation Search; The Foundation Center; and Guidestar. For the most part, these data bases draw upon IRS Form 990 data. These data are
2 Growth of giving circles documented in - Forum of Regional Associations of Grantmakers: “More Giving Together: The Growth and Impact of Giving Circles and Shared Giving.”
Section 1 — Definitions, Methods, and Data Limitations
self-reported, so issues of accuracy and timeliness of filings can impact the data set. Due to the granting of filing of extension requests and the time required to convert data into an electronic format, the 2005 data set was the most comprehensive available at the time this study occurred, especially since this study focused on individual grants made by philanthropic
organizations. Consequently, unless otherwise noted, this report utilizes data for fiscal year 2005.
In addition to the above caveat concerning the time frame focused on in this study, there is another inevitable limitation that must be acknowledged at the outset of this report: Every data base utilizes somewhat different decision rules to determine what to include in the data set and what information to exclude;
consequently, it is never possible to capture and code every grant made or received during a specified time frame. This study minimized this problem by cross-referencing all of the available data bases. Members of the research team also called a number of organizations to clarify ambiguous data and/or to gather additional information that none of the data bases provided. Because of these efforts, 73 percent of the grants made by San Diego-based foundations in the specified time period were analyzed. This percentage exceeds the percentage recommended by The Forum of Regional Association of Grantmakers3. Grants were classified by
assigning the codes defined in the National Taxonomy of Exempt Entities (NTEE codes).
3 The Forum recommends analyzing a sample of between 55 percent and 70 percent of the total annual grants for all funders in the region of study.
4 The list of participants included companies on The San Diego Business Journal’s list of the 25 largest public and private companies in the County. Additional businesses
were selected from a variety of lists that provided information about the number of total employees and/or financial information such as annual revenue.
5 The Silicon Valley Community Foundation, for example, reported a response rate of 5 percent, and in a study conducted by Indiana University, the sample consisted of
only ten corporations that were selected for study precisely because they were well known for their charitable giving
The study also includes research on corporate giving in the region. Corporations may make charitable gifts either directly from the company or they may elect to establish a nonprofit corporate foundation. A corporate foundation, like other private foundations, must annually submit an IRS Form 990. However, corporations that do not have separate foundations are not required to publicly report charitable giving. To gather information on corporate giving that takes place outside of the 10 official corporate foundations that were operating in San Diego in 2005, a survey of San Diego’s largest companies4 was conducted during
Spring and Summer 2008. The survey focused on both organizations headquartered in San Diego and those that had their headquarters elsewhere but had a regional office or some other visible presence in San Diego County. The survey was distributed in both email and hardcopy form.
All totaled, 146 businesses representing a wide range of fields received the survey, and 37 responded, for a response rate of 25 percent. The response rate in this study, in fact, was considerably higher than the response rates reported by other studies that focused on corporate giving outside a corporate foundation structure.5 Still, there are no guarantees that the
organizations that responded are representative of all or even most corporate giving programs in San Diego, though there were no apparent differences between those corporations that returned the survey and those that did not.
Section 2 — Overview of Organized Philanthropy in San Diego
Part A. Types and Number of Private
Foundations in San Diego County
During the fiscal year that was studied, 499 San Diego-based private foundations actively engaged in
grantmaking in San Diego County. Collectively they held $1,664,515,936 in total assets and they paid out $134,894,924 in grants.
As Figure 1 indicates, only 6 percent of San Diego’s private foundations report holding assets in excess
0 25 50 75 100 125 150 175 200 2000-05 1990-99 1980-89 1970-79 1960-69 1940-59
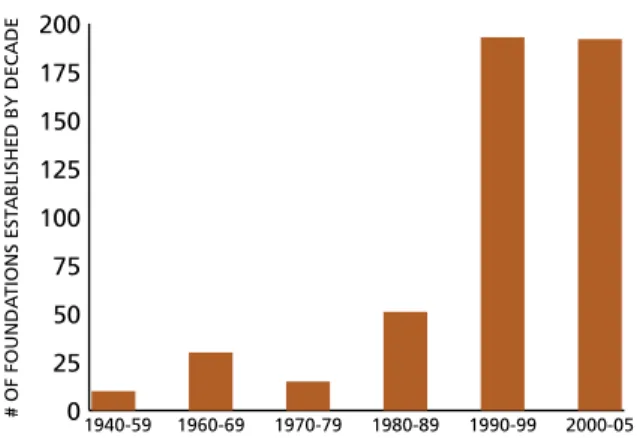
Figure 2: Age of Private Foundations (Active and Nonactive)
Source: National Center for Charitable Statistics (NCCS) Business Master File 2005
Figure 1: Percentage of Active Grantmaking Foundations by Assets
Source: National Center for Charitable Statistics (NCCS) Core File 2005
Private Foundation:
A nongovernmental, nonprofit organization with funds (usually from a single source, such as an individual, family or corporation) and program managed by its own trustees or directors, established to maintain or aid social, educational, religious or other charitable activities serving the common welfare, primarily through grantmak-ing. Private foundations make grants to other tax-exempt organiza-tions to carry out their charitable purposes. Private foundaorganiza-tions must make charitable expenditures of approximately 5 percent of the market value of their assets each year.
Family Foundation:
“Family foundation” is not a legal term, and therefore, it has no precise definition. Yet, approximately two-thirds of the estimated 44,000 private foundations in this country are believed to be family managed. The Council on Foundations defines a family foundation
of $10 million. The majority, 53 percent, hold assets of less than $500,000.
The data summarized in Figure 2 represent both active and inactive grantmaking foundations and demonstrate that most of San Diego’s foundations are fairly new. Indeed, 78 percent were established (received tax-exempt status) since 1990 and nearly 50 percent of those were incorporated after 2000.
as a foundation whose funds are derived from members of a single family. At least one family member must continue to serve as an officer or board member of the foundation, and as the donor, they or their relatives play a significant role in governing and/or managing the foundation throughout its life.
Independent Foundation:
These private foundations are usually founded by one individual, often by bequest. They are occasionally termed “nonoperating” because they do not run their own programs.
Operating Foundation:
Also called private operating foundations, operating foundations are private foundations that use the bulk of their income to provide charitable services or to run charitable programs of their own. They make few, if any, grants to outside organizations.
6 The data source for comparable areas in Tables 1 and 2 is Foundation Center. The numbers reported for San Diego in Table 1 are derived from the compiled data set
created for this report. Therefore, they include amounts that may not have been counted had Foundation Center data been utilized for San Diego. This slightly increases the numbers reported for San Diego and the difference is mostly attributable to the inclusion of the Jewish Community Foundation which is not normally included in numbers reported by Foundation Center.
7 See: Deitrick, et al., 2006, A Spotlight on San Diego’s Third Sector and James Irvine Foundation, 2006, Foundation Giving in California.
8 The metropolitan areas of Denver, Phoenix, Pittsburgh, and Tampa were identified by the San Diego Association of Governments (SANDAG) as most similar to San Diego
on a variety of economic and demographic indicators including population.
Part B. Private Foundation Growth
Trends in San Diego County
According to the Foundation Center, between 2001 and 2005 both the total number of San Diego’s active private foundations and their combined assets have experienced steady growth. San Diego experienced an increase in the assets of its private foundations of 14 percent. Despite this growth, the amount of total giving by private foundations declined by 14 percent over that same time period. The reasons for this apparent disparity are unclear at this time. Further research on this issue is warranted.
Part C. Comparisons to Other
Metropolitan Areas
The study also examined how organized philanthropy in San Diego measures up to organized philanthropy in comparable cities in both California and other states. This part of the analysis combines private and community foundation data. These data are summarized in Table 1.6
Table 1 reinforces a key finding from previous studies:7
San Diego foundations have considerably fewer assets ($2.29 billion) than the assets reported by foundations in California’s two other major cities, San Francisco ($31.3 billion) and Los Angeles ($34.7 billion). Comparisons with other United States cities8 included
in Table 2 also clearly indicate that foundation assets in San Diego are lower than asset levels in most other places that could be considered, in other respects,
comparable to San Diego. In most cases, as Figure 3 demonstrates, disparities are even greater when population figures are factored into the equation. Tables 1 and 2 also demonstrates a correspondence between total assets, on the one hand, and total grant dollars awarded, on the other. This correspondence is to be expected because the amount of dollars a foundation pays out in any given year is partly
determined by the amount of income generated by the foundation’s assets. The bottom line here is, compared to other cites, San Diego has fewer local foundation dollars available for nonprofit organizations.
What may be surprising in Tables 1 and 2, however, are the data about the percentage of grant dollars awarded in a city relative to the city’s total foundation assets. The percentage in San Diego is greater than in all other cities on the list. Indeed, the only city where the grant-dollars-to-assets ratio comes close to the ratio in San Diego is Tampa, another city with a relatively small asset base.
Part of the disparity can be explained by the fact that the figures for all other cities included in Tables 1 and 2 came from the Foundation Center database, whereas the San Diego figures came from the specific analysis conducted for this study. Even when Foundation Center figures are substituted for the figures reported in Tables 1 and 2, the San Diego percentage is still 8 percent. It is important to note that this calculation is for one year only. To better understand any trends and potential implications, this percentage should be tracked over time in the coming years.
Section 2 — Overview of Organized Philanthropy in San Diego
REGION TOTAL ASSETS TOTAL GRANT DOLLAR GRANT DOLLARS AS A % OF ASSETS ASSETS PER NONPROFIT # OF NONPROFITS PER 1,000 RESIDENTS GRANT DOLLARS PER NONPROFIT DENVER $6,142,799,427 $338,473,125 0.06 $1,053,834 2.58 $58,067 PHOENIX $3,175,893,369 $161,237,215 0.05 $434,102 1.89 $22,039 PITTSBURGH $10,011,357,377 $519,486,884 0.05 $1,507,054 2.52 $78,201 TAMPA $882,361,231 $82,798,453 0.09 $148,446 2.25 $13,930
Figure 3: Grants - Per Capita
9 City comparisons are always difficult to make because city boundary lines are defined differently in different places. It is possible, for example, that the larger number of
nonprofits per capita in a city like San Francisco is attributable to the fact that city boundary lines are tightly drawn and the fact that nonprofits deliver services far beyond the city limits.
Table 2: Comparisons to Other Metropolitan Areas9
REGION TOTAL ASSETS TOTAL GRANT DOLLAR GRANT DOLLARS AS A % OF ASSETS ASSETS PER NONPROFIT # OF NONPROFITS PER 1,000 RESIDENTS GRANT DOLLARS PER NONPROFIT SAN DIEGO $2,291,539,887 $236,980,323 0.10 $299,665 2.61 $30,990 LOS ANGELES $34,722,596,623 $1,542,212,464 0.04 $1,208,331 2.57 $53,668 SAN FRANCISCO $31,297,596,922 $1,950,415,898 0.06 $3,957,713 4.69 $246,638 STaTe oF CaliFornia $8,9,,000 $,0,2,000 0.0 $8, 2.8 $2,899
Table 1: Comparisons to California Cities and State
Sources: Foundation Center Grantmaker Statistics and DataPlace.org
9
SAN DIEGO
Grants Per Capita $81
CALIFORNIA
Grants Per Capita $122
LOS ANGELES
Grants Per Capita $138
SAN FRANCISCO
Grants Per Capita
$1,157 DENVER
Grants Per Capita $150
PHOENIX
Grants Per Capita $42
TAMPA
Grants Per Capita $32
PITTSBURGH
Grants Per Capita $197
Section 3 — Funding Priorities
10 Foundation Center, 2006. Highlights of Foundation Giving Trends. 11 Ibid.
With over 9,000 nonprofits based in San Diego and countless more doing charitable work throughout the world, philanthropists have a wide range of options when making grant decisions. This section focuses on the funding priorities of foundations that engage in grantmaking to nonprofits in the San Diego region. Initially, the focus is on grants made by San Diego-based philanthropic organizations. Then the focus shifts to an analysis of the grant making priorities of organizations that are not based in San Diego but that contribute grant dollars to nonprofit organizations in San Diego.
Part A. Funding Priorities of
San Diego-Based Foundations
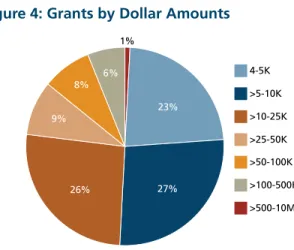
Grant Distribution by Sub-sector. In the year that was studied, 2005, the total dollar amount of grants made by San Diego-based foundations (both private and community foundations) was $236,448,711. For this report 73 percent of the grants made by San Diego foundations (private and community) were analyzed. Figure 4 illustrates that 76 percent of the grants made were for less than $25,000. The results of the analysis of how these funds were allocated are summarized in Figure 5.
Figure 5 indicates that the greatest number of
organized philanthropy dollars go to higher education, religion-related, and human services-related nonprofits. For the most part, the distribution of foundation dollars summarized in Figure 5 mirrors national organized giving priorities.10
An exception, however, is the high percentage of dollars granted to religion-related nonprofits in San Diego. Interestingly, this figure more closely resembles the giving priorities of individuals than the traditional
funding priorities of foundations.11 An examination of
the religion-related grants made in San Diego suggested that this greater emphasis may be attributable, in part, to two factors: (1) San Diego’s reliance on donor advised funds at its community foundations and (2) the relatively large percentage of small foundations in San Diego’s philanthropic community. A substantial number of these foundations make grants to religious related organizations. Conversely, San Diego only has two foundations that rank in the top 50 California foundations as measured by total assets. The lack of these types of large foundations may also contribute to this giving pattern.
Figure 5 also provides information about a) the amount of grant dollars awarded by San Diego-based foun-dations to San Diego nonprofits and b) the amount of dollars awarded to organizations outside of the county. San Diego based foundations directed nearly one third of their contributions to organizations located outside of San Diego County. The higher education and human services subsectors received the largest percentages of grant dollars sent outside of the county.
Figure 4: Grants by Dollar Amounts
Source: FoundationSearch
Figure 5: Analysis of Grants Made by San Diego-Based Foundations2 $0 $5 $10 $15 $20 $25 $30 $35 $40 SOCIETAL BENEFIT RELIGION PHILANTHROPY/VOLUNTEERISM MEMBER ORGANIZATIONS MEDICAL RESEARCH INTERNATIONAL HUMAN SERVICES HEALTH ENVIRONMENT HIGHER ED EDUCATION COMMUNITY DEVELOPMENT ARTS/CULTURE ANIMALS
12 To note: One grant accounted for 56 percent of the outgoing grant dollars awarded in the human services area. Of the grant dollars awarded to San Diego
animal-related nonprofit organizations, 82 percent went to two specific organizations.
Source: FoundationSearch, GuideStar
Section 3 — Funding Priorities
Map 1: Geographic Distribution of Grants Made by San Diego-Based Foundations Map 1 indicates that San Diego-based Foundations
are dispersing their grants throughout the county. In particular, grant dollars appear to be most highly concentrated in the inland communities of Poway and Escondido as well as in the coastal city of La Jolla, the Sorrento Valley, and Southeast San Diego.
The southern border region and Chula Vista also attract a fair amount of grantmaking dollars. However, their neighboring cities of Imperial Beach and National City receive less.
In the eastern region of the county grant dollars are most highly concentrated in La Mesa, El Cajon, and Santee. Cities further east of these boundaries received little to no grant dollars.
In the northern region of the county there is a noticeable decrease in foundation grant dollars in the communities of Valley Center, Vista, and Oceanside that extend along the northern border of the county.
13 In many cases the organizations have some sort of regional or branch office in San Diego. An example is The California Endowment which has its headquarters
in Los Angeles but regional offices in various parts of the state, including San Diego.
14 Almost certainly the percentage of dollars provided by non-San Diego based foundations is greater than our analysis indicates. FoundationSearch data were
used to track the total grant dollars made by outside funders. The FoundationSearch database does not include grants less than $4,000.
Figure 6: Analysis of Grants Made to San Diego Nonprofits by Non-San Diego-Based Foundations
Part B. Funding Priorities of Non-San
Diego-Based Philanthropic Organizations
Another important source of grant dollars awarded to San Diego nonprofits comes from foundations located outside of the county.13 Indeed, the study suggests
that, during the period studied, non-San Diego based foundations contributed nearly half ($205,120,195) of the total grant dollars received by San Diego nonprofits.14
Figure 6 reveals that higher education received the lion’s share of funding from non-San Diego-based foundations. To put the higher education figure in
perspective, it should be noted that 54 percent of all higher education out-of-county grant dollars were awarded to one institution. In fact, the dollar amount for higher education was more than five times the dollar amount given to human services, the area that came in second in terms of dollars awarded. It is also interesting to note that the largest overall number of grants was awarded to human services where the average grant dollar amount is much smaller than in higher education.
$0 $40 $80 $120 $160 $200 $0 $30 $60 $90 $120
Source: FoundationSearch, GuideStar
Section 4 — A Closer Look at San Diego’s Community Foundations
15 The research team was able to analyze 2006 data for community foundations because most had filed their 990 reports for 2006 and those that had not were close
at hand and were willing to provide information about the grants they made during 2006. For consistency reasons, however, 2005 community foundation data were used in the comprehensive analysis discussed in earlier sections of this report.
16 The percentage of grants that could be studied was higher in this analysis than in the comprehensive analysis because the organizations that were being studied were
both nearby and limited in number.
17 As defined by the Forum of Regional Association of Grantmakers.
San Diego’s community foundations are major contributors to grantmaking in San Diego County. In fact, their combined assets represent nearly one-third of the assets held by all private and community foundations in the region. This section disaggregates the community foundation data in order to take an in-depth look at this important type of grantmaking organization.
Due to their availability, 2006 data were used for all of San Diego’s community foundations.15 Over
90 percent of the total grant dollars distributed during the 2006 fiscal year were analyzed.16
Part A. Overview of Community
Foundations in San Diego County
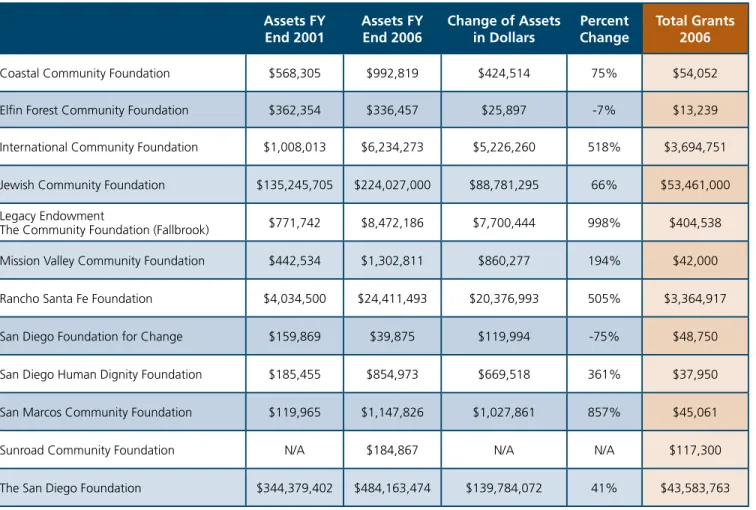
Twelve San Diego community foundations were identified for study: These are listed in Table 3. In addition the Rancho Bernardo Community Foundation’s grants, a fund operated through the San Diego Foundation, were included in these figures. The San Diego Foundation also established charitable foundations in Escondido, Carlsbad, Oceanside, 4-S Ranch – Del Sur, and Chula Vista; however, they were not yet making grants during the year studied and are therefore not included in the figures here.
As Table 3 indicates, the majority of community foundation assets are held by two groups: The San Diego Foundation ($484,163,474) and the Jewish Community Foundation ($224,027,000). These two organizations also accounted for 92 percent of the grant dollars awarded.
Community Foundation:
A community foundation is a tax-exempt, nonprofit, autonomous, publicly-supported philanthropic institution composed primarily of permanent funds established by many separate donors.17 These funds include donor
advised funds which are charitable funds managed by the foundation. Donor advised funds allow individuals to donate initially to either an endowed or non-endowed fund and advise how the funds are distributed to charities. However, the community foundation manages the administrative and legal aspects of the giving. Community foundations also provide a framework for building community leadership and for addressing local needs. In addition to their donor advised funds, they may also have special programs or funds that operate under their umbrella such as the San Diego Women’s
Foundation and San Diego Social Venture Partners, which are part of The San Diego Foundation, and the Jewish Women’s Foundation and Youth Philanthropy that are part of the Jewish Community Foundation. More information on the wide variety of funds managed by local community foundations can be found on their websites and in their annual reports.
Assets FY End 2001 Assets FY End 2006 Change of Assets in Dollars Percent Change Total Grants 2006
Coastal Community Foundation $568,305 $992,819 $424,514 75% $54,052
Elfin Forest Community Foundation $362,354 $336,457 $25,897 -7% $13,239
International Community Foundation $1,008,013 $6,234,273 $5,226,260 518% $3,694,751
Jewish Community Foundation $135,245,705 $224,027,000 $88,781,295 66% $53,461,000
Legacy Endowment
The Community Foundation (Fallbrook) $771,742 $8,472,186 $7,700,444 998% $404,538
Mission Valley Community Foundation $442,534 $1,302,811 $860,277 194% $42,000
Rancho Santa Fe Foundation $4,034,500 $24,411,493 $20,376,993 505% $3,364,917
San Diego Foundation for Change $159,869 $39,875 $119,994 -75% $48,750
San Diego Human Dignity Foundation $185,455 $854,973 $669,518 361% $37,950
San Marcos Community Foundation $119,965 $1,147,826 $1,027,861 857% $45,061
Sunroad Community Foundation N/A $184,867 N/A N/A $117,300
The San Diego Foundation $344,379,402 $484,163,474 $139,784,072 41% $43,583,763
Table 3: Community Foundation Statistics
These grantmaking data were gathered directly from The San Diego Foundation, The Jewish Community Foundation, Rancho Santa Fe Foundation, the International Community Foundation and the Coastal Community Foundation. All other data were gathered from the organization’s IRS form 990.
Source: Individual Organizations and GuideStar
Figure 7: Community Foundation Grantmaking To better understand the kinds of grants made by community foundations, over 8,000 grants totaling over $96 million dollars were analyzed. As in the analysis presented in previous sections, the grants were coded by type using NTEE codes and the organizations that received the grants were coded by geographic location.
The data indicate that 80 percent of all community foundation grant dollars are directed to nonprofit organizations in the San Diego region. It is important to note that the majority of these funds are donor advised (see box p.14) and that for the most part donors are choosing to invest the bulk of their grant dollars in local causes.
Some organizations are guided by their missions to direct funds to national and international causes,
thereby inflating the overall percentage of grant dollars leaving San Diego. Notable examples are the International Community Foundation (91.2 percent of grant dollars directed outside of San Diego) and the Jewish Community Foundation (24 percent of grant dollars directed outside of San Diego). Figure 7 summarizes the grantmaking of San Diego’s community foundations. Among other things the table demonstrates that, in most areas, San Diego’s community foundation grantmaking mirrors the grantmaking practices of San Diego’s philanthropic community as a whole (See Figure 5). Two notable exceptions are arts and community development organizations. Both receive a greater percentage of grant dollars from community foundations than from the overall foundation community.
Part B: Community Foundation Grantmaking
$0 $5 $10 $15 $20 $25
Section 4 — A Closer Look at San Diego’s Community Foundations
Source: Individual Organizations and GuideStar
Section 5 — United Way
The United Way of San Diego County plays an integral role in organizing and coordinating giving between local corporations and nonprofits. Though not a foundation or corporate giving program, per se, the United Way’s contributions to nonprofits, both inside and outside of San Diego, are so substantial that it seemed important to include an analysis of United Way giving priorities in this report. Figure 8 shows that in 2006, the United Way of San Diego distributed over $17 million to nonprofits through three primary funds.18
Through 2006, the United Way operated in a manner similar to the community foundations discussed in the previous section; i.e., some funds were distributed through a traditional grantmaking process while others were distributed in a manner stipulated by individual donors. In 2006, United Way of San Diego County awarded $3.4 million in grants as part of its Community Fund (these are undesignated funds that are granted at the discretion of the United Way). All grants made from this fund were given to San Diego-based nonprofit agencies through a formalized grantmaking process. Figure 9 indicates that the bulk of this money was granted to human service related nonprofit organizations. Figure 8: Total United Way Funding
Figure 9: Breakdown of Community Funding
Figure 10: Breakdown of Donor Designated Funding
As the major coordinator of workplace giving in San Diego County, United Way also pulls together the donations of individuals across the region. Much like donors who contribute to donor advised funds at community foundations, individual donors to the United Way may designate which nonprofit will receive their donations. In this program, giving is not restricted to San Diego-based organizations. However, in 2006, over 90 percent of donations in this fund were directed to nonprofits located within San Diego County. Figure 10 provides a breakdown of the giving priorities for this fund.
Beginning in 2005 the United Way of San Diego County began shifting to a community impact model; with full implementation completed in 2007. Since full implementation dollars given to the United Way will now support targeted programs focusing on critical issues in three main areas; child abuse and neglect, chronic homelessness, and financial stability. Future studies of United Way funding priorities will reflect this change.
18 The donations distributed through the Combined Federal Campaign could not be disaggregated and are consequently not analyzed in this report.
Source: United Way of San Diego County
The focus of this report now shifts to corporate
grantmaking. As was noted earlier, to better understand grantmaking by corporations (which are not legally required to report on grantmaking activity that occurs outside of the relatively small number of legally constituted corporate foundations located in San Diego), the research team that prepared this report surveyed San Diego’s largest corporations. Figure 11 and Table 4 characterize the 37 corporations that responded to the survey. The survey that corporate representatives filled out contained a large number of questions about various aspects of corporate giving in San Diego. Not all questions were answered by all respondents.
For this report, the research team analyzed responses to questions that were likely to contribute to a general overview of corporate giving in San Diego County, some sense of future trends in corporate giving, and, consistent with the major focus of this report, the funding priorities of a sample of 37 of San Diego’s largest corporations.
Part A. Overview of Giving by
San Diego’s Largest Corporations
Figure 12 summarizes information about the level of giving reported by the 31 respondents who answered questions about their corporations’ actual or estimated giving in 2007. The responses summarized in Figure 12 indicate that 75 percent of the reporting corpora-tions each awarded over $100,000 in grants. Seven respondents reported that their corporations had awarded grants totaling more than one million dollars during the same period.
Corporate representatives also were asked to identify the geographic areas (i.e., North County Coastal, North County Inland, North Bay, Central, East County, and South Bay) that their corporations targeted for support. Twenty-three reported that their corporations awarded grant dollars to three or more geographic areas, and 17 of these representatives indicated that their cor-porations contributed to all six areas. The areas that were named most frequently were the Central (26), North County Coastal (25), North Bay (23) and North County Inland (22) regions.
Section 6 — Corporate Giving
Figure 11: Information About Types of Corporations that Responded to the Survey
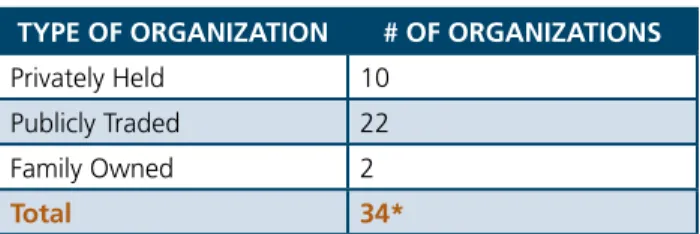
Table 4: Information About the Ownership of Organizations That Responded to the Survey
TYPE OF ORGANIZATION # OF ORGANIZATIONS
Privately Held 10 Publicly Traded 22 Family Owned 2
Total 34*
*Three organizations did not answer this question.
Figure 12: Reported Corporate Cash Contributions in 2007
Thirteen of the respondents reported that some of their corporation’s contributions were distributed through formally constituted corporate foundations. This number is somewhat larger than the total number of San Diego-based corporate foundations found in the Foundation Center database for 2005. The larger figure may reflect a slight increase in San Diego-based corporate foundations since 2005, or it may simply mean that some respondents who answered the corpo-rate foundation question were referring to a corpocorpo-rate foundation that is not headquartered in San Diego.
Part B. Anticipated Trends in Corporate
Giving in San Diego
Respondents also were asked to predict whether their corporations were likely to increase or decrease support for nonprofit organizations during the next two years. Figure 13 indicates 62 percent of the 29 corporate representatives who responded to this item predicted that, during the next two years, corporate contribution levels would remain the same, despite current eco-nomic conditions. Slightly more than a quarter of those who responded to this particular item predicted an increase in funding, while approximately 10 percent of the respondents reported that they expect to see some decrease in funding.
When respondents were asked to disaggregate their predictions about funding changes over the next two years, nearly 40 percent of the respondents predicted that their organizations would increase funding to environmental organizations. Educational organizations fared almost as well, especially at the elementary and secondary levels. Arts organizations, however, were at the opposite end of the increased/decreased fund-ing continuum: Nearly 17 percent of the respondents predicted that their corporations would decrease levels of support to the arts over the next two years.
0% 20% 40% 60% 80% 100%
Figure 13: Predicted Trends in Comparative Corporate Giving 2008-2010
Part C. Corporate Funding Priorities
Figure 14 summarizes responses to a request to iden-tify the types of nonprofit organizations that received corporate funding during the past fiscal year. The table indicates that, by far, human services organizations received the greatest percentage of support from corpo-rations and that corporate support for religious orga-nizations was negligible. This latter finding contrasts with the data about the high level of support provided by San Diego’s private foundations to religion related nonprofits.
Figure 15 characterizes how corporate representatives responded when asked to list their company’s top funding priorities. To some extent, the findings reported in Figure 15 mirror the projected increases and decreases in support reported in the previous section. In both cases, education organizations are at or near the top of the list, and arts organizations are at the bottom.
0 10 20 30 40 50
Figure 14: Corporate Support for Nonprofit Organizations by Type
Figure 15: Top Corporate Funding Priorities
Section 6 — Corporate Giving
Corporate Foundation:
A corporate (company-sponsored) foundation is a private foundation that derives its grantmaking funds primarily from the contributions of a profit-making business. The company-sponsored foundation often maintains close ties with the donor company, but it is a separate, legal organization, sometimes with its own endowment, and is subject to the same rules and regulations as other private foundations.
Corporate Giving Program:
A corporate giving (direct giving) program is a grantmaking program established and administered within a profit-making company. Gifts or grants go directly to charitable organizations from the corporation. Corporate foundations/giving programs do not have a separate endowment; their expense is planned as part of the company’s annual budgeting process and usually is funded with pre-tax income.
Source: Council on Foundations
Respondents had the opportunity to select more than one category.
2008 Board of Directors
Valerie Jacobs, Chair
Jacobs Family Foundation Gregory Hall, Past Chair
The California Endowment Douglas Sawyer, Treasurer
United Way of San Diego County Joanne Pastula, Secretary
The Thomas C. Ackerman Foundation Allison Kelly
QUALCOMM Inc. Barry Newman
The San Diego Foundation Richard Kiy
International Community Foundation Janine Mason
Fieldstone Foundation Kathy Patoff
Union Bank of California Kelly Prasser
Sempra Energy Alan Sorkin
San Diego Social Venture Partners Christopher Weil
The Patricia and Christopher Weil Family Foundation
2008 Advisory Board
William E. Beamer, Esq. The Parker Foundation James E. Canales
The James Irvine Foundation Molly Cartmill
Sempra Energy Peter Ellsworth
The Legler Benbough Foundation Murray Galinson
The Galinson Family Foundation Marjory Kaplan
Jewish Community Foundation Bob Kelly
The San Diego Foundation Tim McCarthy
McCarthy Family Foundation Judy McDonald
The Parker Foundation Ruth Lyn Riedel, Ph.D.
Formerly Alliance Healthcare Foundation Robert K. Ross, M.D.
The California Endowment Jennifer Vanica
Jacobs Family Foundation
San Diego Grantmakers (SDG) is a membership association of 90 philanthropic organizations. Our mission is to connect, educate, develop and inspire a diverse group of foundations and corporations to stimulate effective philanthropy in the San Diego region. Our vision is a vibrant, effective and growing philanthropic community that improves the quality of life in the San Diego region. SDG membership includes: independent, family, community, corporate, public and operating foundations, corporate giving programs, giving circles and government grantmakers SDG was founded in 1976 to meet the needs expressed by those in organized philanthropy for a forum in which colleagues could address common problems and interests. The San Diego Foundation, Fieldstone Foundation, and the Jacobs Center all served as fiscal sponsors in the early years before SDG moved into its next stage of evolution and established itself as an independent nonprofit in 1999. SDG is one of 33 members of the Forum of Regional Associations of Grantmakers, a valuable link to philanthropy across the country.
For more information contact:
619/744-2180, www.sdgrantmakers.org
or email SDG Executive Director Nancy Jamison at nancy@sdgrantmakers.org.
4270 Executive Square, Suite 200, La Jolla, CA 92037 619.744.2180 phone 619.744.2182 fax
www.sdgrantmakers.org
5998 Alcala Park, San Diego, CA 92110 619.260.7442 phone