The University of Southern Mississippi The University of Southern Mississippi
The Aquila Digital Community
The Aquila Digital Community
Master's Theses
Fall 12-2016
Using Digital Performance Feedback to Increase Teacher
Using Digital Performance Feedback to Increase Teacher
Treatment Integrity
Treatment Integrity
Heather Marie WhippleUniversity of Southern Mississippi
Follow this and additional works at: https://aquila.usm.edu/masters_theses
Part of the Applied Behavior Analysis Commons, Educational Psychology Commons, and the School Psychology Commons
Recommended Citation Recommended Citation
Whipple, Heather Marie, "Using Digital Performance Feedback to Increase Teacher Treatment Integrity" (2016). Master's Theses. 254.
https://aquila.usm.edu/masters_theses/254
This Masters Thesis is brought to you for free and open access by The Aquila Digital Community. It has been accepted for inclusion in Master's Theses by an authorized administrator of The Aquila Digital Community. For
USING DIGITAL PERFORMANCE FEEDBACK TO INCREASE TREATMENT INTEGRITY
by
Heather Marie Whipple
A Thesis
Submitted to the Graduate School and the Department of Psychology at The University of Southern Mississippi in Partial Fulfillment of the Requirements
for the Degree of Master of Arts Approved:
________________________________________________ Dr. Evan Dart, Committee Chair
Assistant Professor, Psychology
________________________________________________ Dr. Brad Dufrene, Committee Member
Professor, Psychology
________________________________________________ Dr. Keith Radley, Committee Member
Assistant Professor, Psychology
________________________________________________ Dr. Karen S. Coats
Dean of the Graduate School
COPYRIGHT BY
Heather Marie Whipple
2016
ABSTRACT
USING DIGITAL PERFORMANCE FEEDBACK TO INCREASE TREATMENT INTEGRITY
by Heather Marie Whipple December 2016
In intervention research, assessing treatment integrity is important to establish functional control of the independent variable and make accurate decisions regarding treatment effectiveness. This study examined the effects of digital performance feedback (DPF) as a follow-up strategy for teachers to increase integrity. A multiple baseline design was utilized to determine the effectiveness of this strategy. Results from this study expanded previous literature on ways to promote treatment integrity and help move toward a science of intervention implementation. The primary dependent variable measured was treatment integrity. Student behavior was also assessed to determine if there is a relationship between treatment integrity and student outcome. All initially nonadherent teachers demonstrated immediate increases in treatment integrity following the DPF procedure. Results were maintained when feedback was decreased from daily to weekly. The results from this study did not demonstrate a link between student behavior and treatment integrity as found in previous research.
ACKNOWLEDGMENTS
This project would not have been possible without the continuous support and advice from my chair, Dr. Dart. Thank you for all of your supervision and work
throughout this process. I would also like to thank my committee members, Drs. Dufrene and Radley, for their directions and feedback. To the graduate students, Morgan
McCargo, Katie Boozer, and Ashleigh Eaves, thank you for dedicating time and efforts to collect data. This project would not have been completed without your help collecting observations. Finally, I would like to thank the teachers and students who participated in this project.
DEDICATION
I would like to thank numerous individuals who have supported me throughout this process. First of all, I’d like to thank Cody, my amazing fiancée for being my rock. Without you, moving to Mississippi would have been very scary. You are always there to support my dreams and I can’t wait to be done and finally get married (after a decade of being together).
I would also like to thank my family for teaching me to always pursue my dreams and to never give up. To my mom, Cheryl, and dad, Terry, as well as Berna, and Eric, thank you for always being there for me and making countless trips to Mississippi when I’m feeling homesick. My siblings, Samantha, Malarie, and Shayne, without your support and numerous “panicked” phone-calls, this would not be possible.
Finally, I’d like to thank my friends. To Liz, thank you for keeping me sane. Although we are miles apart, you’re always there when I need you most. I have also gained so many lifelong friends in Mississippi that have now become family. I would not be where I am today without you guys!
TABLE OF CONTENTS ABSTRACT ... ii ACKNOWLEDGMENTS ... iii DEDICATION ... iv LIST OF TABLES ... x LIST OF ILLUSTRATIONS ... xi
LIST OF ABBREVIATIONS ... xii
CHAPTER I - INTRODUCTION ... 1
Definition ... 2
How to Measure Treatment Integrity ... 2
Factors Affecting Treatment Integrity ... 3
Shift in School Psychology ... 4
Link to Intervention Effectiveness ... 5
Ways to Increase Treatment Integrity ... 8
Training. ... 8
Video Modeling ... 10
Performance Feedback ... 14
Negative Reinforcement ... 19
Current Study ... 22
CHAPTER II - METHOD ... 24
Participants and Setting... 24
Teacher-Student Dyad 1 ... 24
Teacher-Student Dyad 2 ... 25
Teacher-Student Dyad 3 ... 25
Materials ... 26
Self-Monitoring Protocol and Materials ... 26
Video Models ... 26
Smartphone ... 27
Video Hosting Service Site ... 27
Measures ... 27
Systematic Direct Observation ... 27
Treatment Integrity Checklist ... 28
Usage Rating Profile ... 28
The Behavior Intervention Rating Scale ... 29
Children Intervention Rating Profile ... 29
Consultation Acceptability and Satisfaction Scale ... 30
Dependent Measures and Data Collection ... 30
Experimental Design and Data Analysis ... 31
Baseline ... 31
Implementation Baseline ... 32
Digital Performance Feedback ... 32
Performance Feedback ... 33
Video Model Delivery ... 34
Meeting Cancellation. ... 34
Component Fading ... 35
Reliability ... 35
Procedural Integrity ... 37
Data Analysis ... 37
CHAPTER III - RESULTS ... 39
Visual Analysis ... 39 Treatment Integrity ... 39 Teacher 1 ... 39 Teacher 2 ... 39 Teacher 3 ... 39 Student Behavior ... 41 Student 1 ... 41 Student 2 ... 43 Student 3 ... 43
Pearson’s r Correlation ... 44
Single-Case Effect Sizes ... 44
Treatment Integrity ... 44 Student Outcomes ... 45 Social Validity ... 46 UPR-IR ... 46 BIRS ... 47 CIRP ... 47 CASS... 48 CHAPTER IV – DISCUSSION... 49
Limitations and Future Directions ... 51
Implications for Practice ... 53
CHAPTER V – CONCLUSION ... 54
APPENDIXA – Teacher Consent Form ... 55
APPENDIXB – Self-Monitoring Form ... 57
APPENDIXC – Observation Form ... 58
APPENDIXD – Self-Monitoring Integrity ... 60
APPENDIXE – Usage Rating Profile- Intervention ... 61
APPENDIXF – Behavior Intervention Rating Scale ... 64
APPENDIXH – Children’s Intervention Rating Profile ... 69
APPENDIXI – Consultation Acceptability and Satisfaction Scale ... 70
APPENDIXJ – Problem Identification Interview Form ... 71
APPENDIXK – Self-Monitoring Script ... 72
APPENDIXL - Procedural Integrity for Initial Meeting/Prior to Baseline ... 74
APPENDIXM – Procedural Integrity for Baseline Observations ... 75
APPENDIXN – Procedural Integrity for Meeting with Teacher Prior to Implementation Baseline ... 76
APPENDIXO – Procedural Integrity for Student Training ... 77
APPENDIXP – Procedural Integrity for Implementation Baseline Observations ... 78
APPENDIXQ – Procedural Integrity for Meeting After Implementation BL ... 79
APPENDIXR – Procedural Integrity for Observations ... 80
APPENDIXS – Procedural Integrity Following Observations ... 81
APPENDIXT – Procedural Integrity for Meeting Cancellation ... 82
APPENDIXU – IRB Approval ... 83
LIST OF TABLES
Table 1 Non-Overlap of All Pairs and Tau-U Depicting the Differences in Treatment Integrity From Implementation Baseline to Digital Performance Feedback ... 45 Table 2 Mean Ratings Across Each Factor on the Usage Rating Profile-Revised Across Teachers ... 47 Table 3 Mean Ratings Across Each Factor on the Behavior Intervention Rating Scale Across Teachers ... 48
LIST OF ILLUSTRATIONS
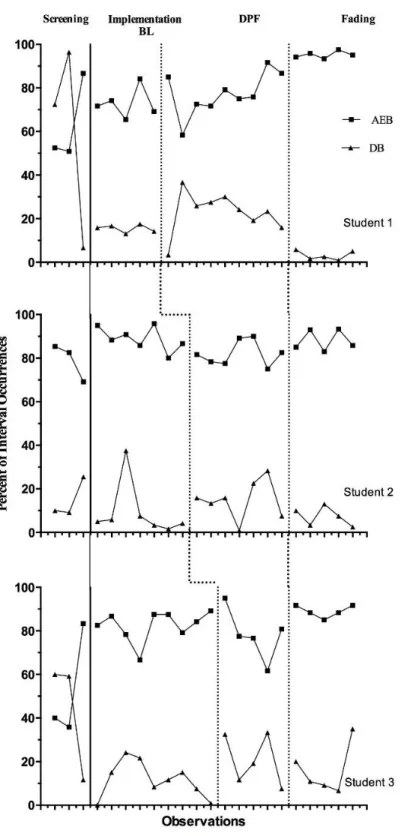
Figure 1. Percentage of treatment integrity across teachers. ... 40 Figure 2. Percentage of student appropriately engaged behavior (AEB) and student disruptive behavior (DB). ... 42
LIST OF ABBREVIATIONS
DPF Digital Performance Feedback
BL Baseline
AEB Appropriately Engaged Behavior
CHAPTER I- INTRODUCTION
In school-based consultation research, treatment integrity is defined as “the degree to which an intervention is implemented as intended” (Gresham, 1989, p. 37). Also called treatment fidelity or treatment adherence, treatment integrity has become an increasingly popular topic within educational, psychological, and behavior analytic research (Noell, 2014). Noell (2008) described two types of treatment integrity,
consultation procedural integrity (CPI) and intervention plan implementation (IPI). It is important to understand that two types of integrity are relevant in school-based
consultation. First, CPI, is the integrity of the consultation process. The second, IPI, is the integrity of the intervention delivered by the consultee and the construct of focus in this study.
Knowing the extent to which an intervention was implemented is particularly important when analyzing functional relationships between treatment implementation and changes in behavior (Gresham, 1989). To assess behavior change, researchers look for the presence or absence of a behavior when certain experimental conditions are in place. If the expected behavior change occurs in the absence of experimental conditions then there could potentially be other explanations for the change. To demonstrate adequate control, expected behavior change should only occur under the experimental conditions hypothesized to induce such change; thus, knowledge of the degree to which the
intervention is implemented is crucial (Baer, Wolf, & Risley, 1968; Gresham, 1989; Noell, 2014).
Definition
Gresham (1989, 2009) defines treatment integrity as the degree to which an intervention is implemented as planned. That is, are the components of the intervention being implemented completely, at the appropriate time, and in the correct order?
Treatment integrity has also been defined as consistent and accurate implementation of an intervention (Watson & Skinner, 2004). Most recently, Sanetti and Kratchowill (2009) define treatment integrity as the extent to which important intervention components are delivered in a clear and consistent way. Although there are many definitions regarding treatment integrity, they all include very similar components. Regardless of which definition is used, treatment integrity may refer to at least one or more of the following implementation components: content, quality, quantity, and process (Sanetti &
Kratochwill, 2009). Content refers to the intervention steps that were implemented; quality is how well the steps were implemented; quantity is how much of the intervention was delivered; and process is how the intervention was implemented (Sanetti &
Kratochwill, 2009). It is imperative to have a clear definition of the treatment integrity construct in order to identify means to promote it within the context of intervention implementation.
How to Measure Treatment Integrity
Previous literature has indicated three primary ways in which treatment integrity is commonly measured. These methods include direct observation, self-report, and examination of permanent products generated from the implementation of the intervention (DiGennario-Reed & Codding, 2014). Direct observation of treatment
measures (e.g., praise-based integrity). This checklist is completed by an individual observing intervention implementation. Self-report measures include a checklist as well, but they are completed by the interventionist. Finally, permanent products include evidence of implementation generated from the implementation process itself. For example, a permanent product of implementation of the Good Behavior Game (GBG; Barrish, Saunders, & Wolf, 1969) might include the tracking form used by a teacher to record the points earned by each team. This type of evidence is typically collected by an independent evaluator after implementation is complete. Permanent products are
particularly useful in practical settings in which alternative assessment methods are not feasible (Schulte, Easton, & Parker, 2009).
Factors Affecting Treatment Integrity
There are also several factors related to treatment integrity that are important to consider in order to identify methods for increasing integrity. Gresham (1989) identified six factors that are hypothesized to influence treatment integrity, which include: (a) the complexity of the intervention, (b) the time required to implement the intervention, (c) the materials required, (d) the number of people required to implement the intervention, (e) the perceived and actual effectiveness of the intervention, and (f) the motivation of individuals implementing the intervention. It is important for practitioners to understand the variables that influence treatment integrity in order to establish methods to increase the integrity of interventions. For example, teachers may not be motivated to implement an intervention if they do not believe it will be effective. Furthermore, if the motive of a teacher is to have a disruptive student removed from his or her classroom, he or she may deliberately implement an intervention with poor integrity to expedite the process.
Acceptability is another factor that has been proposed as an influence of treatment integrity (Witt & Elliott, 1985). It is hypothesized that if an intervention is viewed as acceptable, or more liked the intervention will be implemented with higher integrity and produce better outcomes. Allinder and Oates (1997) conducted a study to investigate this idea. The purpose of their study was to determine if teachers who found curriculum-based measurement (CBM) more acceptable would implement a treatment protocol using CBM with higher integrity compared to teachers who did not find CBM acceptable.
Participants included 22 teachers who were responsible for 2 students each. Teachers were trained how to conduct CBM’s and given the CBM Acceptability Scale (CBM-AS). Teachers were divided into two groups, teachers who had a mean score of 5 or more on the CBM-AS (i.e., more acceptable) and teachers who had a mean score below 5 on the CBM-AS (i.e., less acceptable). Researchers found that teachers who found CBM more acceptable implemented more probes compared to teachers who found it less acceptable (F[1, 19] = 7.75, p < .01). They also reported a large effect size for student outcomes for high acceptability compared to low acceptability teachers (ES = 1.11).
Shift in School Psychology
School psychologists typically provide services in schools on a consultative basis, as opposed to offering direct services to students (Gutkin & Curtis, 2009). Many times, school psychologists are required to assist teachers and parents in the development of interventions, leaving implementation to classroom teachers, aides, or other school staff members. This is referred to as the “paradox of school psychology”, (Gutkin & Curtis, 2009, p. 592) which means to “serve children effectively school psychologists must, first and foremost, concentrate their attention and professional expertise on adults” (Gutkin &
Curtis, 2009, p. 592). Thus, classroom teachers are often asked, and in some instances required, to implement academic and behavioral interventions in their classrooms to address student concerns; however, research has shown that the implementation of interventions by teachers can be very low (Wickstrom, Jones, LaFleur, & Witt, 1998). If an intervention is too difficult or takes too much time to implement, treatment integrity is likely to suffer as a result (Gresham, 1989). Understanding why teachers or parents do not implement interventions with integrity can help school psychologists develop
different consultative tactics and training supports in order to promote treatment integrity (Noell, 2014).
Link to Intervention Effectiveness
Witt and Elliott (1985) explain the importance of treatment integrity on intervention effectiveness. They conclude that the evaluation of integrity is crucial because a lack of integrity data has been related to unsuccessful interventions. Knowing how an intervention should be conducted needs to be explicitly stated to ensure integrity. Accurately assessing treatment integrity is not only important to determine experimental control, but also for evaluating treatment outcomes (Durlak & DuPre, 2008).
The idea that poor implementation leads to poor treatment outcomes makes intuitive sense but there is little empirical evidence using treatment integrity as an independent variable to demonstrate this relationship. Noell et al. (2005) assessed treatment integrity based on different follow-up strategies and student outcomes. They found that teachers who implemented with higher integrity produced the greatest
behavior change in students compared to teachers who did not implement with integrity. Another study found that higher levels of treatment integrity were correlated with higher
levels of positive behavior changes in students and lower levels of treatment integrity were correlated with decreases in expected student behavior (Reinke, Lewis-Palmer, & Merrell, 2008). One study intentionally manipulated treatment integrity to demonstrate the importance it has on student outcomes (Noell, Gresham, & Gansle, 2002).
Researchers manipulated the integrity of a computerized academic math intervention being delivered into three groups, 100% integrity, 67% integrity, and 33% integrity. Results indicated that the computer-based mathematics intervention implemented with low integrity resulted in poorer student outcomes than when the same intervention was implemented with high degrees of treatment integrity (Noell et al., 2002).
Durlak and DuPre (2008) examined 542 intervention studies; 483 of which came from meta-analyses and 59 were individual studies assessing the impact of intervention implementation on outcomes. They found that programs with better implementation resulted in significant mean differences in effect size compared to programs with poor implementation. Differences were as big as two to three times higher (Durlak & DuPre, 2008). In the 59 additional studies assessing implementation impacts on outcomes, they found that 76% demonstrated a significant positive relationship between implementation and at least half of all the outcomes.
Allinder, Oats, and Gagnon. (2000) conducted a study that examined the effects of teacher self-monitoring on implementation of curriculum-based measurement (CBM) and math computation achievement of students with disabilities. Teachers were assigned to either a control (did not use CBMs) or treatment condition (used CBMs). All the teachers in the CBM group were trained to conduct CBMs and research assistants met with teachers twice a month to provide direct instruction and modeling of the CBM
components. The treatment group was then divided randomly so that eight teachers were selected to implement a self-monitoring process. Results indicated that teachers in the CMB and self-monitoring group made different instructional changes for students and that students exhibited greater progress compared to teachers who used CBM alone or no CBM at all. Student digits correct increased from a mean of 35.33 digits correct to a mean of 57.83 digits correct in the CBM plus self-monitoring condition, compared to an increase from 24.00 to 34.20 in the CBM alone condition. Self-monitoring allowed teachers to see changes in student progress better than just using the CBMs alone (Allinder et al., 2000).
Leon, Wilder, Majdalany, Myers, and Saini (2014) conducted a study regarding errors of omission and commission in the implementation of an intervention, which provided reinforcement for compliance and the effects of varying levels of treatment integrity. Errors of omission refer to a lapse in delivery of reinforcement when reinforcement was scheduled to be delivered. An error of commission refers to the delivery of a reinforcer when no reinforcement is scheduled to be delivered. The
researchers also looked at varying levels of treatment integrity (100%, 60%, 50%, 20%, and 0%) and its effect on child compliance. They found that compliance was always highest in the 100% integrity condition compared to other integrity conditions and substantially lower in the 0% integrity condition compared to the other integrity conditions. They also found that errors of commission resulted in the most detrimental effects on compliance when compared to errors of omission. For example, one participant exhibited 0% compliance in the 0% integrity condition, meaning that reinforcement was provided for every command regardless if the child complied. During the three 100%
integrity conditions (reinforcement provided only contingent upon compliance), the participant’s compliance increased to a mean of 65%, 73%, and 63% and fell again for the last two 0% integrity conditions (8% and 20%). The other participants demonstrated similar patterns.
Ways to Increase Treatment Integrity
The preceding sections highlighted the importance of documenting and promoting high levels of treatment integrity within intervention and consultation research; however, as mentioned previously, implementation of interventions by classroom teachers is typically very low (Wickstrom et al., 1998). Fortunately, several different methods for promoting treatment integrity have been identified in the literature, including
performance feedback, coaching, pyramidal training, negative reinforcement, and video modeling (Noell et al., 2014).
Training. Training procedures have been used previously to increase treatment integrity (Dufrene, Lestremau, & Zoder-Martell, 2014). More specifically, direct and indirect training methods have been evaluated in the literature. Indirect methods of training include didactic instruction and/or providing teachers with written materials explaining the intervention; whereas more direct methods include procedures such as modeling, role-playing, rehearsal and feedback (Sterling-Turner, Watson, & Moore, 2002). The literature supports the use of more direct methods for promoting treatment integrity (Dufrene et al., 2012; Sterling-Turner et al., 2002; Stormont, Smith, & Lewis, 2007). For instance, Sterling-Turner and colleagues (2002) conducted a study evaluating the effects of indirect and direct training procedures on teacher’s integrity. Researchers demonstrated higher levels of treatment integrity following direct training methods.
Three of the four teachers did not implement an intervention with higher than 50% integrity following indirect training procedures; however, once direct procedures were implement, integrity increased for all teachers.
Additionally, Stormont et al. (2007) demonstrated that large, in-service didactic training might be ineffective for some teachers as a method for training to increase rates of praise. Two months following the last in-service training, three Head Start teachers were recruited for participation in this study due to low rates of praise and high rates of reprimands. During intervention, training sessions consisted of a 30-minute meeting with the teacher and the teacher practiced delivering precorrective statements and received corrective feedback until they accurately produced two statements. The purpose of the intervention was to train teachers how to use precorrective statements and increase rates of specific praise statements when students followed expectations. Following each intervention session, consultants informed teachers whether they used precorrections in the beginning of the activity as well as the number of praise statements issued.
Researchers demonstrated that use of this more direct training procedure was an effective way to increase teachers’ rate of praise and use of precorrective statements.
Dufrene et al. (2012) examined different training procedures on the teachers’ use of praise and effective instruction delivery (EID). Again, teachers participated in a large group in-service training discussing praise and EID, but were not able to practice and receive feedback. Following the in-service training, four Head Start teachers were referred for consultative services by the center director. During didactic training
sessions, the consultant described rationale for praise and EID then provided examples of each. Next, the teacher practiced and received feedback from the consultant. During the
direct training phase, teachers were provided with prompts using a one-way radio and teachers were told to repeat statements verbatim. Researchers also collected maintenance and one-month follow-up data regarding teachers’ use of praise and EID. This study demonstrated increased rates of praise and components of EID following direct training procedures. Results maintained during maintenance and one-month follow-up at levels higher than in baseline.
Pyramidal training is another method used to increase treatment integrity (Pence et al., 2014). Pyramidal training includes an experienced individual training a group of individuals, who then train additional individuals in some type of intervention or treatment. Pence et al. (2014) used pyramidal training to instruct teachers how to implement a functional analysis. Each trainer practiced the different functional analysis conditions using role-play, modeling, and feedback with the teachers. Results indicated an increase in treatment integrity after training sessions. Prior to training, fidelity was below the 90% mastery criterion set by the researchers. After training, fidelity increased to 90% and above for all participants except one, during the attention condition of the functional analysis (88.9%). Using pyramidal training may also be beneficial because it significantly reduces the amount of training time required to effectively train a large number of individuals; however, there is a lack of literature supporting widespread use of this method.
Video Modeling. Often, traditional forms of training teachers to implement interventions are time consuming (Moore & Fisher, 2007). Some researchers have looked at the potential of video model training as a more efficient method for training parents and teachers to implement intervention strategies (Catania, Almeida,
Liu-Constant, & DiGennaro Reed, 2009; Collins, Higbee, & Salzberg, 2009; Digennaro-Reed, Codding, Catania, & Maguire, 2010; Moore & Fisher, 2007). Video modeling is a tool used to demonstrate skills for the viewer to imitate. Moore and Fisher (2007)
examined the effects of video modeling on staff acquisition of functional analysis methodology. In this study, participants were asked to conduct the attention, demand, and play sessions of a functional analysis. The primary dependent variable was
percentage of correct responses. A multiple baseline design was used with features of a multielement design (partial vs. complete video model). Video modeling involved two experimenters on videotape conducting the functional analyses conditions, one playing the client and the other playing the experimenter. Complete video models included examples of each potential behavior, whereas partial video models included examples of 50% of potential behaviors. During the first training phase, participants were either in the lecture training condition (control), partial video modeling, or complete video modeling.
During the second training phase, participants in the complete video modeling condition were omitted from the rest of the study if the mastery criterion (i.e., 80%
integrity or above) was achieved. Also during the second phase, participants in the lecture training condition received complete video modeling, and participants in the partial video modeling condition remained in this group if mastery (i.e., 80% integrity or above) had not been achieved. During the final training phase, participants receiving the complete video modeling were omitted if mastery was achieved and participants in the partial video modeling condition received the complete video modeling if mastery still had not been achieved. Results demonstrated that complete video modeling provided participants with effective and efficient training that resulted in high rates of treatment integrity, all
but one above 80% integrity. The complete video modeling tape was five minutes for each condition, totaling 15 min for the entire training. This strategy could provide teachers with quick effective training in under a half hour.
Catania and colleagues (2009) conducted a study on video modeling to train staff to implement discrete trial instruction for students with autism. This study included baseline, video modeling, and generalization/maintenance phases. The outcome measure was correct teaching behaviors and was calculated by dividing the total number of correct behaviors performed by the number of skills on the performance checklist. During
baseline, participants were given explanations of a lesson plan to be implemented. The video modeling phase consisted of a 7 min 15 s long video that showed the researchers conducting a discrete-trial session. Within 10 min after watching the video model, participants were instructed to use discrete-trial training during session. Generalization was assessed without the video model in single-session probes. A 1-week maintenance probe was also assessed. The results demonstrate video modeling to be an effective and efficient training tool over verbal explanations. Treatment integrity means increased from 48%, 21%, and 63% at baseline to 98%, 85%, and 94%, respectively, after video
modeling training. During the follow-up phase, skills were maintained with a mean accuracy of 99%.
Similarly, Collins et al., (2009) conducted a study to evaluate the effects of video modeling training on staff implementation of a problem-solving intervention in a
community residential program. Before beginning the study, the staff was trained on the intervention procedures, which included seven steps. The training process included verbal instructions, modeling, role-plays, and chances to ask questions. Once training was
completed, the staff completed a test regarding the procedures. During baseline, staff had access to written procedures and were asked to conduct a role-play exercise with the researcher. During the video modeling condition, the conditions were identical to
baseline except the staff watched a video model before engaging in the role-play exercise. Video models were 3-min in length and featured two individuals using the problem
solving script. There were four versions of each video model to match the gender of the staff member and the client. During baseline, staff correctly implemented a mean of 38% of the problem-solving intervention steps compared to a mean of 91% during the
implementation of video modeling. This study extended previous research on the use of video modeling as an effective training tool.
A more recent study evaluated the effects of video modeling training on treatment integrity of behavioral interventions (Digennaro-Reed et al., 2010). The researchers in this study looked at the effects of individualized video modeling and individualized video modeling plus performance feedback on teachers from a setting that provided services to students with autism, brain injury, and other developmental disorders. Didactic training occurred prior to beginning the video modeling training. The training included a verbal overview of the treatment protocol as well as a test to correct immediately any errors or answer any questions. Feedback was not provided to the teachers during baseline. During the individualized video modeling procedure, participants watched an
instructional video demonstrating accurate implementation of the intervention. The video models were different for each participant, depending on the intervention chosen for implementation. The individualized video modeling plus performance feedback condition included the same procedure, except participants were given feedback about prior
sessions before watching the video model. Researchers also instructed the participants to pay close attention to certain parts of the video based on the errors from the previous session. The mean percentage of integrity was 41% during baseline, 84% during individualized video modeling, and 100% for individualized video modeling with performance feedback. Results demonstrated a clear increase in treatment integrity following the video modeling training, but perfect implementation was not demonstrated until the performance feedback component was added.
Performance Feedback.Performance feedback is a highly effective strategy used to increase treatment integrity and has the most literature to support its use compared to other strategies (Noell et al., 2014; Reinke et al., 2008). Performance feedback includes providing visual data on previous implementation performance and student outcomes and is found to be the most promising method for increasing treatment integrity (Noell et al., 2005, 2014; Reinke et al., 2008). Performance feedback has been delivered daily (Noell, Witt, Gibertson, Ranier, & Freeland, 1997), weekly (Mortenson & Witt, 1998), biweekly (Codding, Feinburg, Dunn, & Pace, 2005), face-to-face, and electronically. For instance, Hemmeter, Snyder, Kinder, and Artman (2011) examined the use of feedback on
teachers’ use of descriptive praise delivered via e-mail.
Noell et al. (2000) conducted a study on two different follow-up procedures to determine how they affect treatment integrity. In this study, teachers were trained on a peer tutoring intervention. During baseline, teachers were instructed to implement the intervention using the materials provided. Follow-up meetings were scheduled when treatment integrity was low. These meetings lasted five minutes and did not provide the teacher with data. Instead, the consultant asked the teacher how he or she felt the
intervention was going. In the performance feedback condition, the consultant would meet with the teacher every morning to provide the teacher up-to-date performance and implementation data displayed visually on a graph. The consultant would also address any treatment implementation problems and discuss ways to improve implementation. Follow-up sessions were also conducted after 4 weeks. Baseline treatment integrity across participants was very low, averaging 41%. Integrity increased to a mean of 87% during the performance feedback condition.
Reinke et al. (2008) implemented The Classroom Check-up (CCU) intervention to assess the effects it had on teacher implementation of praise. CCU is a class-wide
consultation model to provide support to teachers and address issues related to treatment integrity. Visual performance feedback was provided to teachers as a separate
intervention to display teacher’s use of praise and classroom disruptive behaviors. During baseline, all classrooms displayed higher rates of disruptive behaviors compared to rates of praise. During follow-up, all classrooms demonstrated the opposite; higher rates of praise compared to rates of disruptive behaviors. Results from this study indicated that rates of teacher praise (i.e. treatment integrity) did not increase until performance feedback was added.
Another study has examined the effects of verbal and graphic performance feedback on the implementation of interventions (Hagermoser Sanetti, Luiselli, & Handler, 2007). The staff participants included a team of four teachers and one student participant. This study was conducted using an A-B-B+C-B-B+C reversal design that included baseline, intervention (teachers implementing behavior support plan as discussed), verbal performance feedback (when integrity dropped below 80% for three
observations), and verbal and graphic performance feedback. The verbal performance feedback alone condition had the consultant providing the participating teacher with the percentage of intervention steps implemented, providing feedback on the steps that were missed, and answering any questions the teacher had. During the verbal and graphic performance feedback condition, the consultant would provide a graph of the
implementation steps implemented along with the feedback and questions. During baseline, treatment integrity was lower, 72.3%. Integrity did not improve with the verbal feedback alone condition, averaging 42.9%; however, integrity improved substantially when verbal and graphic feedback was introduced to a mean of 91%. When the graphic feedback was removed for the reversal design, treatment integrity dropped again to a mean of 49.2%. Integrity increased once graphic feedback was reintroduced to 87.2%. The results from this study also indicated that the student’s appropriate behavior was highest when teachers’ integrity was highest within the verbal and graphic feedback condition.
Noell et al. (2005) conducted the first randomized field trial investigating various performance feedback procedures. The purpose of this study was to explore the effects of three different follow-up procedures on treatment integrity and student behavior change (i.e., weekly follow-up, social influence, and performance feedback). The study consisted of 45 teachers and 45 children in general education ranging from kindergarten to fifth grade. The primary dependent variable was treatment integrity assessed using permanent products. A second dependent measure, student outcomes, was also assessed. The consultation process generally followed the behavioral consultation (BC) model (Bergan & Kratochwill, 1990).
Once an intervention was developed, the consultant provided the teacher with all the necessary materials, reviewed the intervention plan, trained the target student, and trained the teachers how to properly implement the intervention. Teachers were randomly assigned to one of three treatment conditions (weekly follow-up, commitment emphasis, and performance feedback). The weekly follow-up condition consisted of brief weekly meetings between consultant and teacher to discuss improvements and answer questions regarding implementation. The commitment emphasis strategy included the same procedures as weekly follow-up, but also included a social influence procedure in which the consultant sent a social influence message which reviewed potential barriers to implementation, the importance of integrity to the child, and negative consequences for poor implementation to increase similarity between commitment to implement
intervention and actual implementation. The performance feedback condition included the consultant reviewing the permanent products with teacher and showing graphic representation of student data and implementation data. Results indicated a significant main effect for condition (CE, weekly, and PFB) with a large effect size (η2 = 0.81). The results found that performance feedback produced the greatest change in treatment integrity. Results also indicated that students’ outcomes were higher for the performance feedback group. This research further supports performance feedback as an effective strategy to substantially increase treatment integrity following consultation.
Other research has explored the idea of fading performance feedback to determine if increases in treatment integrity are durable over time. Gross, Duhon, and Doerksen-Klopp (2014) conducted a study to address this issue. Their procedures included direct training, implementation baseline, performance feedback with direct rehearsal, changing
criterion fading, and a maintenance phase. During the direct training phase, the
consultant met with the teacher to review a check-in/check-out procedure. The consultant and teacher practiced the procedures and the teacher had to role play until 100%
treatment integrity was reached independently. Implementation baseline was established to determine how well the teacher implemented the intervention in his or her classroom without any support. After this phase, if integrity was below 80%, consultants provided teachers with performance feedback with direct rehearsal. This included a visual graph of integrity, feedback on the missed steps of the intervention, and rehearsal of the entire intervention procedure until the teacher was able to demonstrate 100% integrity through role-play. The performance feedback with direct rehearsal continued until the teacher established 100% adherence for two consecutive days. The fading phase was made up of three changing criterion schedules, randomly selecting permanent products from one day of implementation, meeting every other day, and meeting once a week. The procedures were the same for each schedule; the consultant provided the same procedures as with the performance feedback with direct rehearsal. Teachers’ criteria changed if they reached 100% integrity for two days in a row. During maintenance, the consultant and teacher only met once every other week. Results from this study indicated that treatment integrity can be maintained as performance feedback procedures were faded. Another important finding from Gross and colleagues (2014) supports previous research that treatment integrity and student outcomes are related to one another.
One study looked at a comparison of performance feedback procedures to increase treatment integrity which included a meeting cancellation component
reinforcement contingency in which interventionists do not have to meet with the consultant if the treatment is implemented with 100% integrity; however, if treatment integrity is not 100%, the interventionists have to meet with the consultant to practice the missed steps. It is assumed that teachers will look for opportunities to avoid these
meetings; thus, treatment integrity will increase as a result of making their cancellation contingent upon satisfactory levels of treatment integrity. DiGennaro et al. (2007) conducted a study to evaluate the effects of goal setting, performance feedback, directed rehearsal, and meeting cancellation on treatment integrity and student behavior. During the goal setting and performance feedback condition, the consultant set goals based on the baseline performance and met with the teacher to provide daily written feedback with graphs. The performance feedback and direct rehearsal with meeting cancellation phase was conducted as previously described. Results demonstrated that high levels of
treatment integrity were obtained when teachers were able to avoid a meeting with the consultant. Teachers in the direct rehearsal with meeting cancellation phase showed an increase in integrity compared to implementation baseline. During implementation baseline, three teachers demonstrated little or no use of the intervention. The average mean of integrity across the four teachers was 87.5% in the direct rehearsal with meeting cancellation phase. This is important because based on these results, daily meetings may not be necessary to maintain high levels of integrity.
Negative Reinforcement.DiGennaro, Martens, and McIntyre (2005) conducted a study to increase treatment integrity through negative reinforcement. Four elementary school teachers participated in the study. The teachers requested assistance for problem behavior in their classroom. A 12-step reinforcement-based intervention plan was chosen
for all four classrooms; two classrooms only utilized 11 steps. The primary dependent variable in this study was teacher treatment integrity and it was assessed through daily direct observations. Treatment integrity was calculated by dividing the number of steps correctly implemented by the total number of steps and multiplying by 100. Student outcomes were also assessed through observations. DiGennaro et al. (2005) used a multiple baseline across participants design. This study included five phases: Pre-training baseline, training, implementation baseline, performance feedback/negative
reinforcement, and dynamic fading. Pre-training baseline consisted of the teachers conducting their normal classroom routine while off-task behavior was observed for the students. Training included didactic instruction, modeling, coaching, and immediate corrective feedback. Teachers continued in the training phase until 100% integrity was reached for two consecutive days. The implementation baseline phase required the teacher to implement the intervention without assistance or feedback from consultant. Observations were collected on integrity and student behavior. During the performance feedback/negative reinforcement phase, teachers were provided daily written feedback along with a graph of their performance and the students’ behaviors. If integrity was below 100%, a meeting with the consultant was scheduled before the next day’s
implementation. During the meeting, teachers were required to practice the missed steps three times. If 100% integrity was reached, meetings were not held. During dynamic fading, performance feedback/negative reinforcement conditions were in place, but teachers received performance feedback on a thinning schedule. First, performance feedback and negative reinforcement occurred every other day and if integrity maintained at 100% for three consecutive observations, schedule was thinned to once a week, then
once every two weeks. If teachers failed to maintain treatment integrity, teachers would be put back on the feedback schedule with which they were previously successful.
Results from DeGennaro et al. (2005) indicate that performance feedback with meeting cancellation could be an effective strategy. Teachers’ treatment integrity dropped from 100% to between 20% and 30% when the consultant removed supports available during training. At the end of implementation baseline, mean integrity across teachers was 12.75%. Once the performance feedback plus negative reinforcement phase was introduced, integrity increased for all participants, except one teacher. Mean integrity for all teachers rose to 86.2%, an average increase of 73.45%. When procedures were thinned the teachers maintained high levels of integrity ranging from 91% to 100%. These results are important because they demonstrate that daily meetings may not be necessary to maintain high levels of integrity; instead, avoiding a meeting with the consultant can increase levels of integrity. This suggests that having to meet with the consultant and practice intervention components is an aversive event that teachers may try to avoid.
Each of these strategies (i.e., coaching, pyramidal training, performance feedback, and negative reinforcement) have been demonstrated as effective but utilizing them may require more time than a school psychologist has available. Consultants often have large caseloads, making face-to-face meetings more difficult. In addition to large caseloads, consultants are often employed by a school district and are required to travel between multiple sites. This further complicates face-to-face meetings. Furthermore, it is unclear under what conditions these individual strategies may be differentially effective,
potentially requiring a school psychologist to try multiple strategies before finding one that is successful with a particular classroom teacher.
Current Study
The purpose of the current study was to evaluate the effects of a follow-up strategy designed to promote high levels of treatment integrity for teachers that are
initially non-adherent following consultation. Called digital performance feedback (DPF), this follow-up strategy combined three already existing strategies (performance feedback, negative reinforcement, and video modeling) into a single integrated strategy.
Additionally, DPF was implemented with teachers digitally, using smartphones or tablet computers, in an effort to increase the efficiency with which school psychologists and researchers promote treatment integrity, reserving face-to-face meetings as a last resort. As mentioned previously, treatment integrity is an important issue in school-based intervention research and practice. In order to move toward developing a science of intervention implementation, it is necessary to identify strategies that promote high levels of treatment integrity (Sanetti & Kratochwill, 2009).
Research Questions and Hypotheses
1. Is digital performance feedback an effective follow-up strategy in increasing treatment integrity among initially non-adherent classroom teachers?
It is hypothesized that the digital performance feedback follow-up procedure will result in increased teacher adherence to components of the self-monitoring intervention.
It is hypothesized that increases in treatment integrity will be associated with increase in student outcomes as measured by systematic direct observation of on-task and disruptive behavior.
3. Is digital performance feedback rated as acceptable by teachers?
It is hypothesized that digital performance feedback will be rated as an acceptable follow-up strategy by teachers.
CHAPTER II - METHOD Participants and Setting
Three teacher-student dyads participated in this study. All three teachers were from general education elementary school classrooms in a rural school district. The elementary school consisted of a total of 387 students, 52% were male and 48% female. Of the students, 74% were identified as White, 22% African American, and 4% Hispanic. Students receiving free and reduced lunches included 69.25% of the population. Two general education students participated as well. One student was used across two teachers. Teachers were recruited through a self-referral process. That is, teachers
requested consultation services for behavioral intervention services regarding a student in their classroom. After teachers indicated a need for intervention services and consent was obtained (Appendix A), three direct observations of student behavior were conducted and a self-monitoring intervention was recommended. Because the purpose of this study was to identify initially non-adherent teachers, an inclusion criteria based on teachers’ initial level of treatment integrity was required. Specifically, teachers needed to demonstrate an average of 50% or less integrity across at least three observations during an
implementation baseline phase to be included in the study. All three teachers referred met this inclusion criterion.
Teacher-Student Dyad 1
Teacher 1 was a Caucasian female who taught a 3rd grade general education Reading/English class and was in her 2nd year of teaching. She possessed a Bachelor’s degree in Elementary Education with endorsements in Reading and English. During observations, her classroom contained 18 students, 7 female and 11 male. Of the students,
6 were identified as African American, 11 as Caucasian, and 1 as Hispanic. None of the students received special education services.
The target student in Teacher 1’s class was an 8-year-old African American male. He was referred for talking out, making inappropriate noises (e.g., singing “Dancing Queen”; Abba, 1976), and getting out of his seat without permission. Teacher 1 indicated that these problem behaviors were very unmanageable. She reported using reprimands and moving his seat as procedures used to deal with his behavior. She listed staying on-task as the main goal for this student.
Teacher-Student Dyad 2
Teacher 2 was a Caucasian female who taught a general education 2nd grade classroom. She was in her 13th year of teaching and possessed a Bachelor’s and Master’s degree in Elementary Education. During observations, her classroom contained 21 students, 10 female and 11 male. Of these students, 12 were identified as Caucasian, 2 Hispanic, and 7 African American. Of these students, 2 received 504 accommodations and 2 had an IEP for speech services only.
The target student in Teacher 2’s class was a 7-year-old Caucasian female. She was referred for off-task behavior, leaving seat without permission, and fidgeting. Teacher 2 indicated that the behavior was “fairly manageable”, but would like her to focus more and stay on-task without frequent reminders. The only procedure used in the past to address her problem behaviors included redirections.
Teacher-Student Dyad 3
Teacher 3 was a Caucasian female who taught a 3rd grade general education math class and was in her 1st year of teaching. She obtained a Bachelor’s degree in Elementary
Education and specialized in Middle School Education to teach English and Social Studies. During observations, her classroom consisted of 18 students, 7 female and 11 male. Of these students, 10 were identified as Caucasian, 7 African American, and 1 Hispanic. None of the students received services for special education. The target student in Teacher 3’s class was the same student in Teacher 1’s class. He was referred by each teacher separately for the same behavior problems across classrooms.
Materials Self-Monitoring Protocol and Materials
Self-monitoring was selected as the intervention context in which the effects of digital performance feedback were evaluated. This intervention was chosen because it is easily broken down into seven separate components, it is generally effective for
addressing behavioral concerns of students (Amato-Zech, Hoff, & Doepke, 2006), and it can be used to target the behavior of individual students. None of the three teachers participating in this study had previous experience implementing a self-monitoring intervention. Table 1 contains a list of the seven components that comprised the
intervention for the purpose of this study. Self-monitoring includes a tactile prompt that requires students to indicate whether they are on-task or off-task at predetermined intervals. A MotivAider (tactile prompt) and self-monitoring sheet were used for the student to monitor his or her behavior as part of the intervention (Appendix B). Video Models
Seven short video models, one for each intervention step, were created as part of the DPF procedure. Each video displayed the primary researcher demonstrating one of the steps of the self-monitoring intervention. The primary researcher also provided
narration for each component video. Each component video model was kept below 15s (range = 4 – 11s) in order to ensure that teachers would never be required to watch more than 2 minutes of video footage in the event that she were required to watch all seven components.
Smartphone
Because DPF involved digital delivery of video models, an internet-enabled smartphone or tablet computer was needed for teachers to gain access to the video models. Specifically, teachers were sent a link to the video model(s) through text message following that day’s implementation of the intervention. All three teachers had access to a personal smartphone, which they agreed to use to participate in this study. Video Hosting Service Site
Video models were uploaded to a website called SproutVideo
(www.sproutvideo.com), which allows for videos to be streamed on demand from computers and mobile devices. This particular service was selected over alternatives (e.g., YouTube) because it provided real-time data on the number of views a video received and the duration of each view, in seconds, that each participant interacted with the video. This was critical because it allowed the primary researcher to determine if a teacher watched a video model and if so, the duration of the model watched.
Measures Systematic Direct Observation
Direct observations were conducted daily to gather information on treatment integrity and student outcomes (Appendix C). Student behavior was recorded using 10-second momentary time sampling during 20-minute observation sessions. Student
disruptive behavior was operationally defined as playing or manipulating objects not related to task demand, out of seat, inappropriate vocalizations (i.e., talking out or making noises unrelated to task demand), and non-compliance. Appropriately engaged behavior was operationally defined as orientation toward the academic task demand or teacher. If a student was not being disruptive, but also not appropriately engaged, the interval was left blank.
Treatment Integrity Checklist
A treatment integrity checklist was used to assess the teacher’s implementation integrity of the self-monitoring intervention (Appendix D). This included the seven different steps regarding the intervention. The observer completed this checklist each day beginning in the implementation baseline phase.
Usage Rating Profile (URP-IR; (Briesch, Chafouleas, Neugebauer, & Riley-Tillman, 2013)
The URP-IR was completed after the intervention was explained to the teacher during the problem analysis interview, at the end of baseline and again after the digital performance feedback phase (Appendix E). The original URP-I included 35 items and four factors related to intervention usage: acceptability, understanding, feasibility, and systems support. Items range from 1 (strongly disagree) to 5 (strongly agree; Chafoules, Briesch, Riley-Tillman, & McCoach, 2009). For the purpose of this study the revised URP-IR was utilized. This instrument has only 29 items across six factors: Acceptability, Understanding, Family-School Collaboration, Feasibility, System Climate, and System Support. In terms of internal consistency, alpha coefficients were previously found to be
.95, .80, .79, .84, .91, and .72 for acceptability, understanding, family-school collaboration, feasibility, system climate, and system support, respectively. The Behavior Intervention Rating Scale (BIRS; Elliot & Treuting, 1991)
The BIRS (Appendix F) was used to measure the social validity of the self-monitoring intervention. This questionnaire includes 24 items ranging from 1 (strongly disagree) to 6 (strongly agree). The items address the teacher’s view on the intervention in terms of acceptability, effectiveness, and time of implementation (Elliott & Treuting, 1991). A modified version of the BIRS (Appendix G) was also used to gain information regarding the social validity of the digital performance feedback procedure. The BIRS was modified by changing “intervention” to “self-monitoring” or “Digital Performance Feedback” and “intervention” to “consultation procedure”. Teachers completed the BIRS at the conclusion of the study. Total scores were calculated for each teacher and higher scores indicate greater acceptability. Previous support for the internal consistency of the BIRS yielded an alpha coefficient of .97 for the entire rating scale, and alpha coefficients of .97, .92, and .87 for acceptability, effectiveness, and time of effectiveness,
respectively.
Children Intervention Rating Profile (CIRP; Witt & Elliott, 1985)
The CIRP (Appendix H) was used to assess the student’s acceptability of the self-monitoring intervention. The CIRP consists of 7 items assessing the effectiveness and fairness of an intervention. Items range from 1 (strongly disagree) to 6 (strongly agree; Elliott, 1986). Target students completed the CIRP at the end of the study. Scores were totaled for each target student with higher scores indicating greater acceptability. The CIRP includes one factor, meaning all items reflect the General Acceptability factor.
Psychometric evaluations for the CIRP resulted in alpha coefficients that ranged from 0.75 to 0.89 (Witt & Elliott, 1985).
Consultation Acceptability and Satisfaction Scale (CASS; Taber, 2015)
A rating scale to assess the acceptability of the consultation was utilized (Appendix I). This instrument includes 12 items rated from 1 (strongly disagree) to 6 (strongly agree). Teachers completed this at two time points during the study, after the initial didactic training of self-monitoring, and at the conclusion of the study to assess the DPF as a consultation procedure. Total scores were calculated for each teacher, with higher scores reflective of positive perceptions of the consultation process. Psychometrics have not yet been evaluated on this instrument.
Dependent Measures and Data Collection
The primary dependent variable in this study was treatment integrity. Treatment integrity was defined as the implementation of the intervention as planned,
operationalized by the self-monitoring component checklist mentioned previously. Treatment integrity was calculated by dividing the number of steps implemented
correctly by the total number of steps and multiplying by 100. The secondary dependent measures included student outcomes of disruptive and appropriately engaged behaviors.
Direct observations of treatment integrity and student outcomes were conducted daily. Treatment integrity was observed by using the treatment integrity checklist. Student behavior was recorded using a 10-second momentary time sampling method. Graduate students, who were trained to use this recording scheme to at least 90% agreement with primary researcher, conducted observations. The primary researcher served as the primary observer until the digital performance feedback phase.
Experimental Design and Data Analysis
A concurrent multiple baseline design (Cooper, Heron, & Heward, 2007) across participants was used to demonstrate a functional relationship between the
implementation of digital performance feedback as a follow-up procedure and an increase in treatment integrity of teachers. The phases included baseline, implementation baseline, digital performance feedback, and component fading of digital performance feedback. To meet design standards, the design must meet four criteria: the independent variable must be systematically manipulated, IOA must be between 80-90% and calculated at least 20% of data points within each condition, must include at least three attempts to demonstrate intervention effect at different time points, and have a minimum of three data points, with a preference for five data points (Kratochwill et al., 2012). This study meets design standards.
Procedure Baseline
Once teachers nominated themselves for participation through the consultation process and informed consent was attained from all involved parties (i.e. classroom teacher, student, and student’s parents), the baseline phase began. During baseline, researchers conducted a Problem Identification Interview (PII; Bergan & Kratochwill, 1990) with teachers to gain information about the target student’s behavior and identified a 20-minute time period when the student was most disruptive for observation and intervention implementation purposes (Appendix J). After the PII was completed, researchers conducted three SDOs of the target student’s behavior across three days to gather baseline data.
Implementation Baseline
Following baseline observations, the researcher met with the teacher to conduct the Problem Analysis Interview (PAI). This interview is designed to discuss the results from the observations and develop an intervention plan. A self-monitoring intervention was recommended to the teacher as a potentially viable strategy and the researchers conducted brief didactic training on the intervention’s procedures with the student and teacher, individually. The brief training is standard practice and included reviewing the data, providing the teacher with rationale and instructions for the self-monitoring intervention. The teacher received all of the necessary materials (i.e., protocol,
Motivaider, and prizes) to implement self-monitoring. The researcher demonstrated how the Motivaider is used and allowed teachers to practice setting the Motivaider. At this point, the teacher also completed the URP-IR and CASS to assess teacher’s perspective of the self-monitoring intervention as well as the consultation procedure used to train the teacher on self-monitoring procedures.
During implementation baseline, teachers implemented the self-monitoring intervention without any further instructions or feedback from the researcher. Daily SDOs of student behavior continued and direct observation of the teacher’s treatment integrity occurred using the component checklist of self-monitoring Next, the consultant met with the teacher to discuss digital performance feedback.
Digital Performance Feedback
After the implementation baseline phase, the consultant met with the teacher to conduct the Plan Evaluation Interview. At this time, the consultant verbally commented on expected results and indicated that the intervention was not working the way it was
intended, following a script (Appendix K) to standardize the interaction across teachers. The consultant then suggested using digital performance feedback as a way to provide more support to teachers to help increase integrity of interventions. Teachers were told that as consultants, we often have to provide services to multiple schools and it makes it difficult to provide teachers with feedback in an efficient manner that is also during a convenient time for teachers; therefore, this strategy will allow us to provide feedback more efficiently and promote integrity. There were three components involved in the DPF procedure: performance feedback, video model delivery, and meeting cancellation. Performance Feedback
Each day, following implementation of the self-monitoring intervention, the consultant sent teachers a text message, which served as the performance feedback component of DPF. The text message included a praise statement and data regarding integrity and student behavior. The text message also included a link to the video model(s) of the steps missed during previous day’s implementation. For example,
Ms. XXXX- I appreciate all of your hard work! You did great providing XXXX with the self-monitoring materials. However, we noticed only 1 out of 7 steps implemented so treatment integrity was only 14.29% today. XXXX was on-task 69.17% of the time and was disruptive 14.17% of the time. I have attached a link for you to view the skipped intervention steps:
https://whippleheather27.vids.io/videos/e89bddb31111eec560/XX-dpf-1-mp4 Thanks again for all you do! (H. Whipple, personal communication, December, 2016).
Video Model Delivery
The video model delivered to the teachers only included the intervention step(s) that the teacher missed that day. For example, if the teacher did not provide
reinforcement at the end of the 20-minute intervention period but implemented all other components, the video model only included the video clip detailing the teacher providing the student with reinforcement. The consultant made the video models using iMovie and edited the videos as necessary. For instance, if the teacher missed two intervention steps, the consultant went into iMovie and put the two steps together in one video clip then uploaded that clip to SproutVideo and generated a link to provide teachers in text message. See the text message example above to see how the link was presented in the text message. Teachers were able to click the link directly from phone and watch the video model on their device.
Meeting Cancellation.
Face-to-face performance feedback meetings were scheduled for every morning during the DPF phase; however,if the teacher watched 90% or more of the video model, the meeting was cancelled. If the teacher watched less than 90% of the video or did not access the video at all, the face-to-face performance feedback meeting took place as planned. These meetings consisted of a review of the missed intervention steps from the previous day and presenting the teacher with student outcome data in response to the intervention so far.
Once teachers agreed to the DPF procedures, teachers were sent the link to the video models of the missed steps on the last day of implementation baseline. Teachers were instructed to watch the video with the consultant to ensure that teachers had a clear
understanding of procedures and to make sure the link to videos worked on teachers’ phones. After the DPF phase, a component fading procedure was implemented to determine if integrity would remain high if certain components were removed. Component Fading
Component fading included weekly digital performance feedback rather than daily feedback. Teachers were instructed to implement the self-monitoring intervention for one more week. On the last day of implementation, the consultant sent a text message similar to the DPF phase, except the data included represented the weekly mean treatment integrity and student outcomes (AEB and DB). Additionally, the link to video models contained any component that was not implemented during 4 of the 5 days that week. No teacher required video links during this phase.
Reliability
Interobserver Agreement (IOA) was conducted for at least 33.33% of all
observations in each condition across each of the three participants. IOA was calculated separately for treatment integrity and the target student’s behavior. Agreement was calculated using an exact agreement method (Cooper et al., 2007). That is, the number of agreements between observers was divided by the total number of agreements and disagreements and multiplying by 100.
For Teacher-Student dyad 1, IOA was collected for 40.91% of all observations. IOA was collected for 33.33% of baseline observations. Agreement was 98.33% for student AEB and student DB. IOA was collected for 40% of implementation baseline observations. Mean IOA was 100% for treatment integrity, 95.06% for student behavior (range = 93.87-96.25. IOA was assessed for 44.44% of DPF observations with a mean of