Louisiana State University
LSU Digital Commons
LSU Doctoral Dissertations Graduate School
2016
A Framework to Incorporate a Structural Capacity
Indicator into the State of Louisiana Pavement
Management System
Omar Salaheldin ElbagalatiLouisiana State University and Agricultural and Mechanical College, [email protected]
Follow this and additional works at:https://digitalcommons.lsu.edu/gradschool_dissertations
Part of theCivil and Environmental Engineering Commons
This Dissertation is brought to you for free and open access by the Graduate School at LSU Digital Commons. It has been accepted for inclusion in LSU Doctoral Dissertations by an authorized graduate school editor of LSU Digital Commons. For more information, please [email protected]. Recommended Citation
Elbagalati, Omar Salaheldin, "A Framework to Incorporate a Structural Capacity Indicator into the State of Louisiana Pavement Management System" (2016).LSU Doctoral Dissertations. 4418.
A FRAMEWORK TO INCORPORATE A STRUCTURAL CAPACITY
INDICATOR INTO THE STATE OF LOUISIANA PAVEMENT
MANAGEMENT SYSTEM
A Dissertation
Submitted to the Graduate Faculty of the Louisiana State University and
Agricultural and Mechanical College in partial fulfillment of the
requirements for the degree of Doctor of Philosophy
in
The Department of Civil and Environmental Engineering
By Omar Elbagalati
M.S.C.E, Mansoura University, Egypt, 2012 May 2017
ACKNOWLEDGEMENTS
I would like to express my sincere appreciation and thanks to my exceptional advisor, Dr. Mostafa Elseifi, for his crucial guidance, constant encouragement, and commitment to complete this dissertation. His continuous support during my Ph.D. study is greatly appreciated. His dedication and sincere interest in transportation engineering inspired me to always try my best. I am grateful for having him as a mentor. I also wish to thank my academic committee advisors, Dr. Louay N. Mohammad, Dr. Zhong Wu for their cooperation, guidance, and patience.
I would like to acknowledge the support of the Louisiana Transportation Research Center (LTRC) for providing me access to state-of-the-art research facilities. I would also like to thank Kevin Gaspard and Doc Zhang for helping me accessing and understanding the LADOTD PMS database.
I would like to express my deepest gratitude to my family and friends. This journey would not have been possible without their support. I am especially grateful to my parents, who supported me emotionally and financially. Thank you for all of the sacrifices that you’ve made on my behalf. Thanks to my wife, Sally Badr, I always knew that you believed in me and wanted the best for me.
TABLE OF CONTENTS
ACKNOWLEDGMENTS ...ii
ABSTRACT ... iv
CHAPTER 1. INTRODUCTION ... 1
CHAPTER 2. LITERATURE REVIEW ... 7
2.1 Introducti ... 7
2.2 State of Practice for PMS in Different DO ... 7
2.3 Louisiana P ... 15
2.4 Continuous Deflection Measuremen ... 35
2.5 Structural Capacity Indicato ... 48
2.6 Artificial Neural Networ ... 61
CHAPTER 3. METHODOLOGY ... 66
3.1 Experimental Progra... 66
3.2 Assess the Accuracy of the Developed Structural Capacity Indicator ... 72
3.3 Propose Modifications to the Most Promising Structural Capacity Indicato ... 74
3.4 Compare Rate of Deteriorations for Pavement Section ... 74
3.5 Conduct an Overlay Design for the Selected Pavement Section ... 75
3.6 Investigate the Feasibility of Determining the Subgrade Modulus from RWD Dat ... 75
3.7 Determine Cost Efficiency and Added Values of RWD Testin ... 76
3.8 Develop a One-Step Enhanced Decision Making Too ... 76
CHAPTER 4. DISCUSSION OF RESULTS ... 77
4.1 Accuracy of Structural Capacity Indicator ... 77
4.2 Propose Modifications to the SN Mode... 86
4.3 Compare Rates of Deteriorations for Pavement Section... 97
4.4 Overlay Design for Selected Pavement Section ...105
4.5 Investigate the Feasibility of Determining the Subgrade Modulus from RWD Dat ...110
4.6 Cost Efficiency and Added Values of RWD Testin ...119
4.7 Develop a One-Step Enhanced Decision Making Too ...128
CHAPTER 5. CONCLUSIONS AND RECOMMENDATIONS ...136
5.1 With Respect to the Pavement Structural Capacity Mode ...136
5.2 With Respect to the Implementation of the Developed Model into PM ...137
5.3 With Respect to the Estimation of the Subgrade Modulu ...137
5.4 With Respect to the Development of a Decision Making Too ...138
5.5 Contributions to the Body of Knowledg ...138
5.6 Recommendations for Future Researc ...139
REFERENCES ...140 APPENDIX…… ...147 VITA……… ...150
ABSTRACT
Non-structural factors such as surface distresses and ride quality have been commonly used as indicators of pavement conditions. Recently, the concept of implementing a structural condition index in Pavement Management System (PMS) to complement functional condition indices has become an important goal for many highway agencies. The Rolling Wheel Deflectometer (RWD) provides the ability to measure pavement deflection while operating at traffic speed causing no delays. The objective of this study was two-fold. First, this study developed a model to predict pavement structural capacity based on RWD measurements and assessed its effectiveness in identifying structurally deficient pavement sections. Second, this study introduced a framework, along with the required implementation tools, for incorporating pavement structural conditions into the Louisiana PMS decision matrix. The proposed framework aims at filling the gap between network level and project level decisions and eventually, allowing more accurate budget estimation.
RWD data collected from 153 road sections in District 05 of Louisiana were utilized in this
study. The predicted Structural Number (SNRWD0.1) showed an acceptable accuracy with a Root Mean
Square Error (RMSE) of 0.8 and coefficient of determination (R2) of 0.80 in the validation stage. Core
samples showed that sections that were predicted to be structurallydeficient suffered from asphalt stripping and material deterioration distresses. Results support that the developed model is a valuable tool that could be used in PMS at the network level to predict pavement structural condition with an acceptable level of accuracy. With respect to the implementation of RWD in Louisiana PMS, two enhanced decision trees were developed, such that both functional and structural pavement conditions are considered in the decisionmaking process. Implementation of RWD in the decision-making process is demonstrated and is expected to improve the overall performance of the pavement network. Furthermore, the enhanced decision trees are expected to reduce the total maintenance and rehabilitation (M&R) construction costs if applied to relatively high volume roads. Based on the results of this study, a one-step enhanced decision-making tool, which considers both structural and functional pavement conditions in treatment selection, was developed using an Artificial Neural Network (ANN)-based pattern recognition system.
CHAPTER 1 – INTRODUCTION
1
CHAPTER 1- INTRODUCTION
1.1
Background
Condition of a pavement structure can be described using two characteristics, functional and structural conditions. The functional condition concerns the provided level of service and ride quality of the pavement surface. The structural condition describes the pavement ability to carry the traffic and environmental loads through the design life (Bryce et al. 2013). Surface distresses and roughness are the main parameters to be considered when describing the functional condition of a pavement structure (Carvalho et al. 2012). Nondestructive deflection testing (NDT) is one of the most reliable methods to evaluate the structural capacity of a pavement structure (Garcia and Castro 2011). Pavement surface deflection has been used by several highway agencies in order to evaluate the structural condition of the pavement structure (Saleh 2015). The Falling Weight Deflectometer (FWD) is the most common used technique for evaluating pavement structural capacity in the field (Kulami et al. 2014; Guzina and Osburn 2002). However, the stop and go process necessitates traffic control to ensure drivers and workers’ safety, which limits the use of FWD at the network level (Alavi et al. 2008). The Rolling Wheel Deflectometer (RWD) offers the ability to measure pavement surface deflection while traveling at regular traffic speeds causing no delays (Vavrik et al. 2008).
Various studies were conducted to develop a methodology to backcalculate layer moduli based on deflection measurements (Zabaar et al. 2014, and Kutay et al 2011). Many software programs (e.g., MODULUS and ELMOD) have been developed to conduct the backcalculation process (Kumlai et al. 2014). The AASHTO 1993 design guide of pavement structures provides
a comprehensive methodology for the calculation of the effective structural number (SNeff) of
existing pavements based on NDT measurements (AASHTO 1993). Many highway and transportation agencies also use the NDT data to conduct the overlay design (Wu, and Gaspard 2009). In addition, NDT data can also be used to calculate pavement remaining service life (RSL) (Elkins et al. 2013; Heravi and Esmaeeli 2013).
The Louisiana Department of Transportation and Development (LADOTD) has a comprehensive and well established Pavement Management System (PMS). The pavement network
of LADOTD is surveyed once every two years (Khattak et al. 2009). The Automatic Road Analyzer (ARAN) vehicle is used to collect data regarding pavement surface conditions such as cracking, rutting and roughness. However, no structural condition indicator is used by the State in the process of selecting a treatment strategy. This may lead to two types of error and a waste of state funds because of the lack of consideration of structural conditions (Zhang et al. 2014): adding structure to a pavement that does not require it (Type I error – False Positive) and not adding structure to a pavement that requires it (Type II – False Negative). Examples of Type I errors are using treatments such as pavement replacement, medium overlays, and in some cases thin overlays on pavements that are not structurally-deficient. Type II error examples are using (functional) treatments such as microsurfacing, surface treatment, and thin overlays on pavements that are in fact structurally-deficient.
1.2
Problem Statement
Only surface condition evaluation is currently used in the LADOTD PMS decision matrix at the network level. No structural capacity indicator is currently used to evaluate pavement structural conditions or to select optimum maintenance and rehabilitation treatments. Recent studies showed that the Louisiana decision matrix may recommend structural rehabilitation for pavements with sound pavement structure (Type I error) and functional rehabilitation to pavements with weak pavement structure (Type II error). There are four questions that need to be answered as related to the aforementioned problem statement:
• Can deflection measurement techniques such as RWD be used to evaluate pavement structural
conditions?
• Can we develop a structural capacity indicator based on RWD deflection measurements at the
network level?
• How to implement this structural capacity indicator into the LADOTD PMS decision matrix?
• What is the cost benefit of considering pavement structural conditions in the LADOTD PMS?
1.2
Research Objectives
The ultimate goal of this research was to develop a framework to incorporate pavement structural conditions into the Louisiana PMS. To achieve this goal, the following objectives of this study were proposed:
• Develop a structural capacity indicator based on deflection measurements at the network level;
• Validate that the developed structural capacity indicators are accurately describing pavement
structural conditions;
• Develop a modified decision matrix that would incorporate both function and structural
conditions in determining the recommended treatment strategy;
• Assess the cost efficiency and added values in incorporating a pavement structural capacity indicator into the Louisiana PMS.
1.3
Research Approach
The research approach adopted in this study consisted of completing the following main tasks: Task 1: Literature Review
A comprehensive literature review was conducted to review the following topics: (1) PMS and its development in the US; (2) Louisiana PMS and current state of practice in selecting treatment methods for asphalt pavements in the State; (3) Continuous deflection testing studies; and (4) recent attempts in developing and implementation of structural capacity indicators into the PMS. Task 2: Collecting and Studying Data
Performance, pavement design, and functional data were extracted from the LADOTD PMS databases for District 05. Collected data included RWD and FWD testing data; traffic data including volumes, growth rates, and percentage of trucks; pavement layer thicknesses based on core samples and ground penetrating radar (GPR) measurements; and rehabilitation and maintenance activities that were conducted after RWD testing and their cost and performance. Collected data were organized and checked for consistency.
Task 3: Evaluate Pre-Developed Structural Capacity Indicators
The objective of this task was to evaluate the structural capacity indicators developed by Elseifi and co-workers based on the aforementioned RWD testing program and to select the most promising indicator for further analysis and possible modifications (Elseifi et al. 2012).
To achieve this objective, structural deterioration was evaluated for sections identified to be structurally-deficient. In addition, a comparison was conducted between the PMS data collected in 2013 and the PMS data collected in 2009 in terms structural distresses including
cracking (e.g., fatigue) and rutting to assess the levels of structural deterioration in these sections and whether identified sections were truly structurally-deficient.
Task 4: Propose Modifications to the Most Promising Structural Capacity Indicator
Based on the results of Task 3, the most promising structural capacity indicator to detect structurally-deficient pavements based on RWD testing were identified. In this task, RWD measurements were analyzed further to improve prediction efficiency and to ensure that the maximum accuracy is achieved. In this analysis, pavements were categorized based on thickness and traffic volume during service. The main outcome of this task was an updated structural capacity indicator, which can be used to identify structurally-deficient pavements based on RWD testing.
Task 5: Compare Rates of Deteriorations for Structurally-Sound and Structurally-Deficient Pavement Sections
In this task, PMS data collected in District 05 from 2005 to 2013 were analyzed to determine the rate of structural and functional deteriorations for pavements that are structurally-deficient and those that are structurally-sound based on the structural capacity indicators developed in Task 4. In light of this analysis, one may assess whether the identification of structurally-deficient pavements at an early stage of deterioration may save state funds by addressing the deterioration early in the pavement service life.
Task 6: Conduct an Overlay Design for the Selected Pavement Sections
In this task and based on the structural capacity indicator developed in Task 4 and the original testing program conducted in 2009, an overlay design of selected pavement sections was conducted. These sections included structurally-deficient and structurally-sound pavement sections in District 05. The objective of these overlay designs was to quantify the difference in overlay thickness to address structural deficiency. Based on this analysis, the savings obtained by addressing structural deterioration in the early stages was quantified as compared to later in the pavement service life.
Task 7: Evaluate Cost Efficiency of RWD Deflection Testing
The objective of this task is to evaluate the cost-efficiency of using RWD measurements in PMS activities at the network level in Louisiana. To achieve this objective, monetary savings obtained
by providing for the most cost effective rehabilitation treatment methods were compared against the cost of collecting and analyzing RWD deflection data. Data needed in the cost-analysis were obtained from the analysis conducted in Task 5 and by consulting with district personnel on the current course of actions adopted for treating deteriorated pavements. Current state of practice was compared to an improved treatment selection strategy developed based on RWD testing and current PMS indices.
Task 8: Develop a Model to Predict Subgrade Resilient Modulus from RWD Measurements The objective of this task was to develop and to validate a model in order to estimate the subgrade resilient modulus using RWD deflection measurements at the network-level for flexible pavements. For model development, RWD and FWD measurements obtained from a testing program conducted in Louisiana were used to train an Artificial Neural Network (ANN) based model. After the learning process, the ANN model was validated using RWD and FWD data from a testing program independently conducted at the MnROAD facility in Minnesota. Task 9: Develop Implementation Framework and Propose Modifications to the LADOTD PMS Decision Matrix
In this task, an implementation framework was developed to incorporate structural conditions in the LADOTD PMS. Furthermore, a modified LADOTD PMS decision matrix was developed such that both functional and structural conditions are considered in the selection of maintenance and rehabilitation treatment strategies. Trigger values for the structural index developed in Task 4 were established based on the findings of Tasks 4 to 7 and were incorporated in the PMS decision matrix so that the rehabilitation and maintenance activities are selected based on both structural and functional conditions of the pavement structure.
1.4
Scope of Study
The present-study developed and validated a model to predict pavement structural capacity based on RWD measurements. The developed model can be used in identifying structurally deficient pavement segments. The developed model showed an acceptable accuracy with a
coefficient of determination (R2) of 0.8, and a Root Mean Square Error (RMSE) of 0.8. This
study also developed a framework for incorporating pavement structural condition, predicted from the developed model, into the Louisiana PMS decision matrix at the network level. The
proposed framework aims at filling the gap between network level and project level decisions and eventually, allowing more accurate budget estimation.
Based on the results of this study, a one-step enhanced decision-making tool, which considers both structural and functional pavement conditions in treatment selection, was developed. In the developed tool, the predicted structural number based on RWD measurements was utilized to calculate a pavement structural health indicator known as the Structural Condition Index (SCI). Two enhanced decision trees were then developed, for the functional classes of arterials and collectors, utilizing the SCI. Finally, an Artificial Neural Network (ANN)-based pattern recognition system was trained and validated using pavement condition data and RWD measurements-based SN to arrive at the most optimum maintenance and rehabilitation (M&R) decisions.
CHAPTER 2 – LITERATURE REVIEW
2
CHAPTER 2- LITERATURE REVIEW
2.1 Introduction
Pavement management system is an asset management system that assists decision makers to select optimum strategies for providing and maintaining pavements in a serviceable condition over a given period of time (Zavitski et. al. 2006 and 2008). It is a set of tools which helps the decision makers to select the optimum strategies for providing, evaluating, and maintaining pavement in a serviceable condition over a certain time period (Hugo et al. 1989). The term “PMS” came into popular use in the late 1960s and the early 1970s to describe decision support tools for the entire range of activities involved in providing and maintaining pavements (Hudson et al. 1979). Current systems are focused on determining pavement deterioration, performance forecasting, prioritization and optimization (Muenchet al. 2004). An effective PMS is one that has the ability to contribute to the development of reasonable and reliable recommendations and decisions regarding an agency’s pavement network (Pierce et al. 2015). The current PMS state of practice for different agencies is summarized in the following section.
2.2 State of Practice for PMS in Different DOTs
2.2.1 ArizonaArizona Department of Transportation (ADOT) has been one of the pioneering states in the development and implementation of PMS. Since the early 1980’s, ADOT has been using pavement management tools to manage, maintain and preserve Arizona’s highway network. ADOT’s PMS tools were originally based on a probabilistic approach for modeling the pavement performance, which was adequate for the original ADOT requirements (Li et al. 2006 & Zaghloul et al. 2006).
Surface distress data is collected every year for the entire ADOT highway network. An area of approximately 1000 ft2 is surveyed of every mile as a sample for this particular mile. Different types of distresses are collected for both Asphalt Concrete (AC - flexible/composite) pavements and Portland Cement Concrete (PCC - rigid) pavements. The ADOT PMS has different decision trees and matrices depends on the type of the maintenance activity; preventive, corrective, and
rehabilitation, the functional class, and the pavement type. Table 2.1 illustrates the most considerable distresses in the ADOT PMS, their trigger values, and failure level for both flexible and rigid pavements (Zaghloul et al. 2006).
Table 2.1 ADOT Surface Distresses and Trigger Values(Zaghloul et al. 2006).
Pavement type Distress type Extent measuring
unit
Trigger value Failure level
AC Cracking Percentage of area 5% 20%
Rutting Inches 0.5” 1”
Flushing Index (0-5) 3.5 2.5
Patching Percentage of area 25% 50%
PC Corner Breaks Count 5 10
Transverse cracking Count 5 10
Faulting Average (in) 0.2” 0.5”
2.2.2 California
The California department of transportation (Caltrans) manages around 51,000 lane miles of mainline pavement, which carry 180 billion vehicle miles of traffic annually and amounts to approximately 6% of all vehicle miles traveled in the United States (Lea et al. 2014). Caltrans PMS is a database of pavement condition survey data collected since 1978 (Kannekanti et al. 2007). The Caltrans PMS database consists of five distinct databases obtained by the University of California Pavement Research Center from the Caltrans Maintenance Program (Lea and Harvey 2004). These databases are as follows:
• A database of pavement sections covering the period 1978 to 1992,
• A corresponding database of lane conditions covering the period 1978 to 1992,
• A combined section and condition database covering the period 1992 to 1997,
• A spreadsheet which contains awards information from 1978 to 1997, and
• A database of traffic counts for the network, covering the period 1980 to 1997.
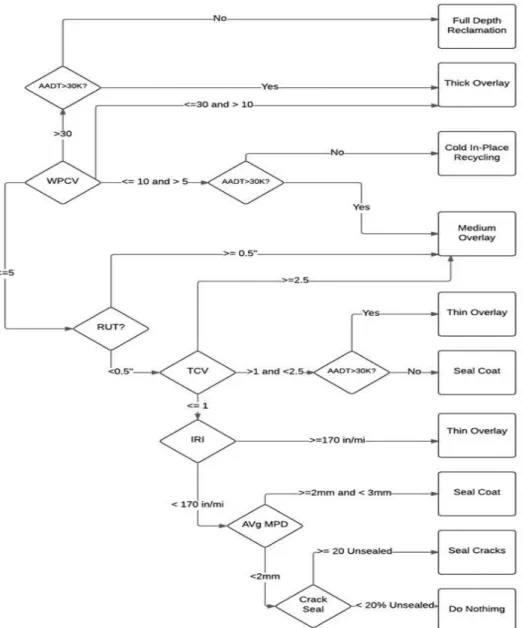
Caltrans has adopted a “dynamic segmentation’ procedure in which the pavements are not evaluated over fixed lengths, rather, the pavement is divided into sections of similar distress during each assessment (Lea and Harvey 2004). The distress surveyed are not implemented directly into the decision tree; it is first converted into some indices: (1) The total cracking value (TCV), which is the sum of the length of all the cracks in the section divided by the section length, (2) the crack length ratio (CLR), which is the crack length divided by the length of the wheel-path, and (3) the wheel pass cracking value (WPCV), which is the sum of the percentage of wheel-paths with CLR > 1.6, and the percentage of the wheel-path that is patched. The decision tree for flexible pavement used in Caltrans PMS is presented in Figure 2.1.
2.2.3 Georgia
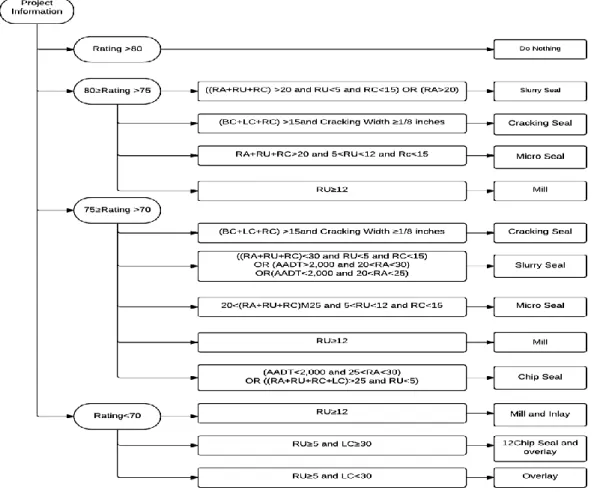
Georgia Department of Transportation (GDOT) is responsible for preserving and managing 18,000-centerline miles of state maintained roadways (Tsai et al. 2010). GDOT has successfully implemented a PMS System under the Office of Maintenance (OM) and the Office of Material and Research (OMR). GDOT has established a comprehensive pavement condition database covering Fiscal Years from 1986 to 2008. GDOT perform a pavement condition evaluation annually using the Pavement Condition Evaluation System (PACES), developed by GDOT, and the Computerized Pavement Condition Evaluation System (COPACES), implemented since 1998. These systems were designed to evaluate the severity and extent of various types of pavement surface distresses at the time of survey (Gao 2004). The distresses considered by the GDOT PMS include but are not limited to load cracking, block cracking, ratting, and raveling. Every combination between type of distress, its severity, and its extent, results in a deduct value. The performance rating is then calculated by deducting these values from 100. Pavements with a performance rating of 100 are considered in very good condition, and sections with a performance rating lower than 70 are considered in poor condition. A decision matrix used by GDOT PMS for flexible pavements based on the aforementioned performance rating is presented in Figure 2.2 (Gao 2004).
where: BC = Block Cracking deduct value; LC= Load Cracking deduct value; RC= Reflective Cracking deduct value; RA= Raveling deduct value; and RU= Rutting Deduct value.
Figure 2.2 GDOT PMS Decision Matrix(Gao 2004).
Georgia has seven district offices and each office is responsible for selecting road sections in unacceptable condition to be considered for repair. Treatment methods are assigned to projects according to the distress condition, the overall performance, and the traffic volumes. The central office collects the lists of the plans submitted by the seven district offices and develops the statewide, yearly pavement rehabilitation program. The total number of projects to be treated is determined based on the available funds.
2.2.4 Indiana
According to the design manual of Indiana Department of Transportation (INDOT), a PMS was established in the State of Indiana in year 1989. The INDOT PMS team is responsible for monitoring the condition of each state highway (INDOT 2003). Cost effective automated
techniques are used to collect the pavement condition, roughness, rutting, distresses, and video log data for each INDOT route (Flora et al. 2010). The data are used to make informed decision as related to programming project, pavement design, and pavement material selection. Table 2.2 summarizes distresses, which are considered by the INDOT PMS for flexible pavements.
Table 2.2 Distresses Considered in INDOT PMS(Flora et al. 2010)
Distress Category Distress Types
Cracking
Alligator Cracks Block Cracks Longitudinal Cracks
Transverse Cracks
Patching and Potholes Patching
Potholes
Surface Defects Raveling
Deformation Rutting
2.2.5 Mississippi
In 1986, the Mississippi Department of Transportation (MDOT) contracted with the University of Mississippi to implement a pilot PMS in District 02. MDOT used the product developed in the pilot program to launch a statewide PMS in 1989 (Georg 2000). The MDOT PMS database includes data of more than 12,000 two-lane miles. Five main databases are used to store the MDOT PMS data: (1) TESTDATA.DBF, which includes Section geometry, route number, functional class, and location; (2) TESTORGM.DBF, which includes construction data, such as pavement thicknesses, year of construction, and subgrade type; (3) OVERLAY.DBF in which maintenance data are stored, such as year and type of maintenance and details of the overlay; (4) TRAFFIC.DBF database, which contains the details of traffic for each section, such as average daily traffic (ADT), percentage of trucks, and growth rate; and (5) RATING.DBF, which includes rutting, IRI and faulting, and the PCR values calculated from the condition data. Databases also include the percentage lengths of each section with low, medium, and high distress severity levels (Georg 2000).
The MDOT collects pavement condition data once every two years since 1991 using the
South Dakota profiler, which collects the longitudinal profile data through laser sensors (Georg 2000). Every highway in the network is divided into a set of homogenous sections. Homogenous
section is defined to be a section with the same type of pavement, traffic volume, design and subgrade condition. While the distress survey covers 100% of the homogeneous section, only two samples of 500 feet per mile are examined in details for distresses. In the case of sections that are less than ½ a mile in length, the entire section is evaluated (Georg 2000). Based on the physical distresses, rutting, faulting, and roughness data, a composite condition index called Pavement Condition Rating (PCR) is calculated and stored in the database (Georg 2000). This PCR is scaled from 0 to 100, which 100 represents a pavement in very good conditions. It is a combination between both the ride quality in terms of roughness and the distress rating in terms of severity, extent, and type. Equation (2.1) is used by MDOT PMS to calculate the PCR.
PCR = 100((12-IRI)/12))a((DPmax– DP)/DPmax))b (2.1)
where IRI = road roughness, m/km; DPmax = probable maximum deduct points with 205, 230, 185, and 145, respectively for flexible, composite, jointed, and continuously reinforced concrete pavements; DP = total deduct points for a pavement section; a = 0.9567 for flexible, jointed concrete, and continuously reinforced concrete pavements; and 1.11 for composite pavements; and b = 1.4857 for flexible, jointed concrete, and continuously reinforced concrete pavements; and 1.5429 for composite pavements.
The MDOT PMS has different decision trees for each pavement family. Each tree includes a set of trigger values and the corresponding rehabilitation activity. For flexible pavement, factors that are considered in the decision tree are the IRI, severity, extent, and type of crack, and the rut depth.
2.2.6 Nebraska
The Nebraska Pavement Management System (NPMS) includes all rural and urban marked and/or maintained highways and recreation roads started in 1973. As of January 1, 1994 the NPMS also includes all highways and roads on the National Highway System (State of Nebraska Pavement Management System Guide). Pavement condition survey is conducted annually by trained raters and automated profilers. Pavement condition data is then used to calculate the Nebraska severability index (NSI), which is a value on a scale of 0 to 100 with 0 the worst and 100 the best condition. It represents the condition of the pavement at the time of measurement. Factors that contribute in the calculation of NSI for flexible pavements are categorized into four groups: (1)
Longitudinal cracking, which includes edge cracking, centerline cracking, wheel-path cracking, between wheel-path cracking, fatigue cracking, and potholes; (2) Transverse cracking that includes thermal cracking and block cracks (3) raveling and bleeding; and (4) pavement rutting. Surface roughness is not considered in the calculation of the NSI. The Present Serviceability Index (PSI) is also calculated based on roughness, rutting, cracks extend and cracks severity. PSI is scaled from 0 to 5 as 5 indicates very good conditions and 0 indicates poor condition. Based on the NSI, PSI, pavement type, and pavement age a decision tree guides to assign appropriate treatments for each road section is used by the NMPS as shown in Figure 2.3.
Figure 2.3 NPMS Decision Tree for Flexible Pavements(State of Nebraska PMS Guide)2.2.7
Texas Department of Transportation and Federal Highway Administration Report
Papagiannakis and co-workers performed a research in cooperation with the Texas Department of Transportation (TxDOT) and the Federal Highway Administration (FHWA) aimed at
summarizing the use of pavement evaluation by the states (Gharaibehet al. 2009). That included
the rating methods used, the score scales, and descriptions; how the scores are used in the recommendation of pavement maintenance and rehabilitation actions; the distresses that are used for generating the scores; the sampling method; the survey frequency; and each state agency’s legislative or internal goal.
The authors conducted a comprehensive survey, and they obtained information from 48 states and the District of Colombia (Gharaibehet al. 2009). The report includes various statistics regarding the PMS current state of practice in the US. For example, the states using visual
evaluation survey and those using automated systems, the states converting this evaluation to scale from 0 to 100 and those converting it to a scale from 0 to 5, the distresses that are involved in this scaling process, and how these scales affect the maintenance and/or rehabilitation decisions.
2.3 Louisiana PMS
2.3.1 OverviewThe Louisiana Department of Transportation and Development started to conduct windshield surveys during early 1970s to establish pavement distress data collection system, which evolved to videotaping in 1992, and to Automatic Road Analyzer (ARAN) system in 1995 (Khattak et al. 2008). Currently, Louisiana pavement network is surveyed every two years to collect and analyze pavement distress data. All nine districts in Louisiana are included in the PMS data.
The distresses data collected by LADOTD PMS include International Roughness Index (IRI), cracking, rutting depth, patching and faulting. PMS classifies the longitudinal and transverse cracking as random cracks, which may be confusing and cause inadequate rehabilitation decisions, as each type of distresses has different causes and behavior of failure (Khattak et al. 2008). The distress data for all pavements are based on a reference location system, which consists of the control sections divided into log miles. The pavement distress data
are collected and reported every 1/10th of a mile and the pavement condition is reported based
on an index scale from 0 to 100 after the analysis has been performed. In addition to the distress data, LADOTD PMS also collects vertical clearance measurements, traffic and advertising signs, geometric properties (horizontal curves, vertical curves, cross slope, edge drop offs and clearance) and right of way images in all ramps (Khattak et al. 2009).
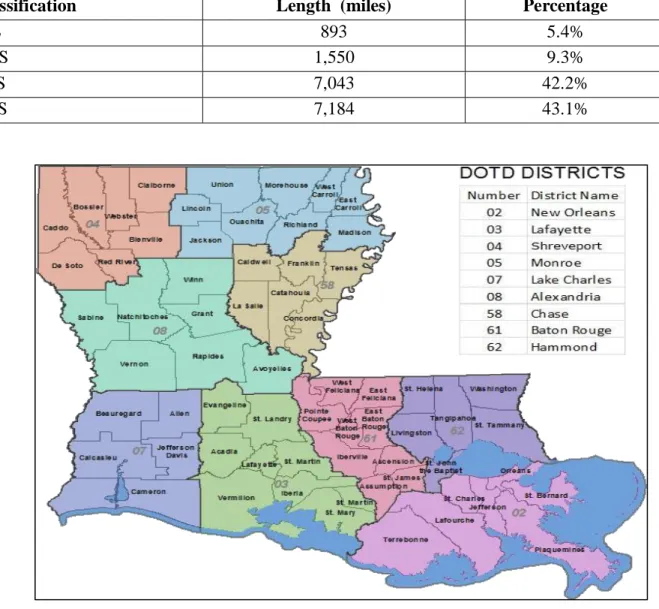
The pavement network in Louisiana is divided into nine districts as shown in Figure 2.4. The highway network in Louisiana is the 32nd largest in the United States, which consists of
more than 60,000 center lane miles and more than 13,000 bridges. The pavement network is classified based on road function as Interstate Highways, Freeway and Expressway, Principal Arterials, Minor Arterials, Collectors and Local Roads (Khattak et al. 2008). The distribution of theses six types of road is presented in Table 2.3. Yet, for the convenience of data analysis and budget allocation, PMS office has modified the concept originally developed by LADOTD
Task Force on Highway Project Identification and Prioritization and classified the pavement network in Louisiana into four categories as Interstate Highway System (IHS), National Highway System (NHS), State Highway System (SHS) and, Regional Highway System (RHS), as presented in Table 2.3. The NHS includes interstate highways, some urban and rural arterial highways, and few urban and rural collector highways. The SHS compliments the NHS and is comprised of the highways whose principal function is intercity, interregional, interstate, and international transport of people and goods. The RHS is comprised of the highways whose principal function is the local movement of people and goods.
Table 2.3 Louisiana Highway Network Functional Classification
Classification Length (miles) Percentage
IHS 893 5.4%
NHS 1,550 9.3%
SHS 7,043 42.2%
RHS 7,184 43.1%
Figure 2.4 LADOTD Pavement Network Districts (Khattak et al. 2008)
2.3.2 LADOTD Location Reference System (LRC)
LADOTD has been using the following reference systems to mark the location of a section or subsection.
• Control Section Log Mile (CSL)
• Route Milepost (RMP)
• Global Positioning System (GPS)
• Rout Log Mile
• Project Station Number.
• The major location reference system used by LADOTD are CSL, RMP and GPS.
2.3.3 Control Section Log Mile
The control section log mile (CSL) is the most common and regularly used technique by LADOTD. The CSL is arranged as a route number and routes are traced from its beginning in the west or south to its end in the east or north within the state of Louisiana. The CSL system defines the route by following properties (Khattak et al 2009):
• Type of Pavement
• The Average Annual Daily Traffic (AADT)
• Lane Width
• Number of Lanes
• Type of Shoulder
• Width of Shoulder
• Subsurface Material
This technique divides each section into increments of one mile, which is referred to as a log mile. All project names begin with CSL, which makes the data retrieval easier. However, the integration of various components in CSL sometimes makes it difficult to locate a specific point on the road.
2.3.4 Route Milepost (RMP)
RMP is the most common reference systems used by traffic engineers. Like CSL, RMP is arranged as a route number and routes are traced from its beginning in the west or south to its end in the east or west within the state of Louisiana. However, RMP is independent on the highway components. This system is considered to be the only system, which can be observed in the actual roadway. The major advantage of RMP reference system is that it is very easy to determine the location of a specific point on the road in the field. However, all the mile post must be adjusted if the roadway is extended at either ends of the route (Khattak et al 2008). 2.3.5 Global positioning System (GPS)
The GPS is the less common location reference used by LADOTD and due to the unrestrained adoption of the GPS technology within DOTD by individuals with little or no training, a uniform standard of referencing could not be established (Barnett et al. 2012). However, some traffic sections and PMS utilize this technology; the distress data collected by ARAN are referenced using the GPS. In addition, unlike RMP the mile posts are not required to be moved or adjusted if there is an extension in the roadway at either ends of the route. The major disadvantage of GPS is that it demands a specific equipment to be installed on the state vehicles. Moreover, the receivers may not detect the signal from the satellites in some cases (Khattak et al. 2008). In addition to this, the lack of training has led to the use of substandard devices that are not designed to collect the type of data, which individuals are gathering at present. Currently, the CSL and RMP reference system have been linked with GPS utilizing the software developed by LADOTD (Khattak et al. 2009).
2.3.6 Unified Location Reference System
Various departments use different location reference systems, which make it difficult to locate and link the data sets that are needed for PMS. In some cases, it is challenging to locate a section or a subsection of the road when different treatments are needed. To address this problem, a user friendly program was developed by the computer section of the LADOTD that could link the major three location reference systems so that they can all be visualized in a single map (Khattak et al. 2008). However, due to the limitations in the software, it could only link Control Section Log Mile and Route Mile Post systems with the GPS. The remaining location reference systems
could not be linked and it can only identify the primary route. A uniform location reference system would allow LADOTD personnel to achieve the following (Khattak et al. 2009):
• Retrieve all or part of the data collected for a particular highway segment;
• Determine relationships between different data files;
• Reduce duplication in the data acquisition process; and
• Expand the database to include the information, which was not collected in the past.
2.3.7 Data Collection
When collecting data whether the images are the right-of-way images or the pavement images, the Department follows a general rule in relation to direction. The primary direction or direction 1, in most cases, travels from South to North and from West to East. The opposite direction, also referred to as the secondary direction or direction 2, travels North to South and from East to west as shown in Figure 2.5 (Louisiana PMS Guide 2006).
Figure 2.5 Primary and Secondary Direction for Collecting Data (Louisiana PMS Guide
2006)
LADOTD utilizes a special vehicle known as Automatic Road Analyzer (ARAN) to survey the pavement network and collect pavement data once every two years. This specific vehicle, shown in Figure 2.6, is equipped with cameras, lasers, sensors and computers to collect high definition digital images of pavement surface and right of way and electronic data of pavement distresses namely cracking, rutting, faulting, IRI and macrotexture for both primary (south to north or west to east) and secondary (north to south or east to west) directions.
Although ARAN is equipped with GPS unit, the data are collected and reported for every 1/10th of a mile (Khattak et al 2008). The continuous digital images and distress data (VISIDATA) acquired by ARAN have also been utilized in each district, and the personnel have been trained to use the data (Khattak et al 2007). When collecting pavement images, the various types of cracks are identified by distress category, rated in order of severity, measured, and recorded in the database Figure 2.7(a). Symbols indicate distress category and a three- color system illustrates the purpose in distinguishing severity levels as shown in Figure 2.7(b) (Louisiana PMS Guide 2006).
Figure 2.6 ARAN Vehicle Used by PMS
(a)
(b)
Figure 2.7 (a) Image Captured by ARAN System (b) Distress Symbol Identification
(Louisiana PMS Guide 2006)
ARAN vehicle also uses a profiler to collect pavement distress data, which have three components that are collected and combined (Khattak et al 2007):
• Reference elevation
• Height relative to the reference
• Longitudinal distance
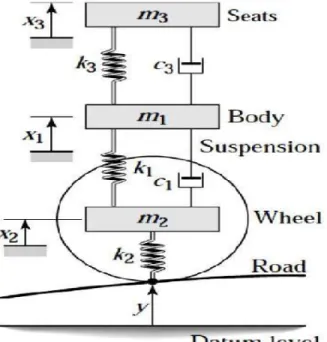
Currently, LADODT uses the quarter car model for profiling as shown in Figure 2.8 (Montoya
2013). The quarter car is a capable of profiling at highway speed and is also compatible with monitoring roadway network.
Figure 2.8 Quarter Car Model
The IRI value for a given section length (e.g., 100 m) is computed according to the following
equation (Montoya 2013):
𝐼𝑅𝐼 𝑧𝑢. | 𝑑𝑡 (2.2)
where IRI= International Roughness Index (in mm/m or m/km); L = length of the section (m); x
= longitudinal distance (m); dt = time increment; = vertical speed of the sprung mass; and = vertical speed of the unsprung mass.
2.3.8 Data Storage
The collected data is stored in the mainframe computer and is assigned a number according to the project. The project number consists of nine digits; the first five digits refer to the control section and the remaining four digits refer to the number of projects performed on the control section (Khattak et al. 2008). The material type and thickness information of asphalt, base and subbase courses are located under Menu/Project/Roadway Xsec in Material Testing System (MATT) and the surface type, roadway geometry and traffic data are located in both MATT and
under Menu/Summary Log in Highway Needs section (Khattak et al. 2007). The data collected by the FWD and Ground Penetrating Radar (GPR) are not included in the PMS database. The mainframe system is a menu driven system, which allows LADOTD users to access the data. The LADOTD mainframe menu system is presented in Figure 2.9.
Figure 2.9 LADOTD Mainframe Menu View (Wu and Yang 2012)
2.3.9 Other PMS Databases
The pavement data related to materials, traffic and project are stored in isolated databases and could be accessed and updated by authorized personnel in different sections. In some cases, the data stored in different databases could be duplicate or may have conflictions (Wu and Yang 2012).
All databases could be accessed from the mainframe menu system. 2.3.9.1 Tracking of Projects (TOPS)
The TOPS database contains general information of a project such as project name, location, cost, work type, important dates and status as shown in Figure 2.10. Each project is identified using the 9 digit code; the first five digits representing the control section and last four representing the project number. The data are stored in the TOPS database for all LADOTD projects from the time they are assigned through completion (Wu and Yang 2012).
Figure 2.10 TOPS database (Wu and Yang 2012)
2.3.9.2 Highway Need System (TAND)
The TAND database contains existing pavement information like traffic data, roadway geometry, and pavement structure for each control sections or subsections and is mainly maintained by LADOTD Highway Needs section for planning purposes. The TAND database is presented in Figure 2.11 (Wu and Yang 2012).
2.3.9.3 Materials Testing System (MATT)
The MATT Database, shown in Figure 2.12, is used to store data regarding materials and testing for all LADOTD projects. The details of asphalt concrete (AC) such as mix design, plant test results and construction verification test for each of the AC lots used in the project are stored in the MATT database. Furthermore, the subgrade soil properties including the soil classification, plasticity limits, soil density and water content for each soil sample are also stored in the database. Yet, base and subbase layer properties are not documented in the MATT database (Wu and Yang 2012).
Figure 2.12 MATT Database(Wu and Yang 2012)
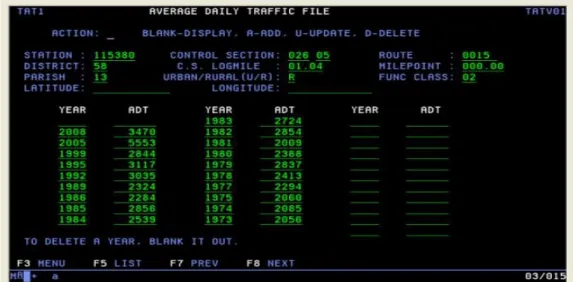
2.3.9.4 Traffic Counts ADT (TADV)
The Average Daily Traffic (ADT) data is collected every three years at each recording station and is stored in the TATV database as shown in Figure 2.13 (Wu and Yang 2012). This data is used to determine ESALs and Average Annual Daily Truck Traffic for four to 13 different classes of trucks as classified by FHWA. In addition, it is also used to predict the future traffic volume for each type of vehicle travelling on a particular section or subsection (Khattak et al. 2008).
Figure 2.13 TADV Database (Wu and Yang 2012)
1.1.10Data analysis
2.3.10.1 Distress Index
The analysis of pavement condition data and modeling of pavement deterioration rate is accomplished using a software known as Deighton Total Infrastructure Management System (dTIMS). The index values for roughness, rutting, alligator cracking, transverse cracks, and random cracks are determined by scaling each pavement distress condition from 0 to 100 (100 being the perfect pavement) (Khattak et al. 2007; Wu et al. 2013 ). The ARAN vehicle collects the data continuously; however, they are reported for every one tenth of a mile. Table 2.4 presents the pavement condition classification according to the distress index (Khattak et al. 2009).
Table 2.4 Performance Indices for Pavement Condition Classification (Khattak et al. 2009)
Condition Interstate NHS RHS& SHS
Very good 100-96 100-95 100-95 Good 95-90 94-88 94-85 Fair 89-76 87-70 84-65 Poor 75-65 69-60 64-50 Very poor 64-0 59-0 49-0
2.3.10.2 Deduct Points
The distress indices are calculated using the deduct points technique. Deduct points for each pavement distress are assigned based on the type, extent and severity of the distress. The pavement section initially is assumed to be in a perfect condition i.e. an index of 100, then the assigned deduct point is subtracted to determine the precise distress index as follows:
Distress Index = 100- ∑ deduct points (2.3) Along with the distress index scale, LADOTD has established several thresholds values to determine a certain type of maintenance or rehabilitation action. The distress index is also used to calculate the remaining service life (RSL) of the pavement. The deduct points and the RSL are analyzed to determine the best rehabilitation strategy. PMS uses different trigger values to decide on maintenance and rehabilitation actions (Khattak et al. 2008). For example, if the deduct points for alligator cracking are more than 35 on an interstate flexible pavement, the decision will be a 7 in. overlay; however, the deduct point for such maintenance for a collector road is 50. It can be inferred that the effectiveness and performance of a rehabilitation strategy triggered for a certain pavement depends upon the preciseness of the deduct point and threshold trigger values established for the distresses in the pavement. The deduct points technique was adopted by LADOTD in 1992. Since then, it was recalibrated twice. An example of deduct point values for alligator cracking (according to the extension and the severity) adopted by LADOTD is shown in Table 2.5.
Table 2.5 Deducts Point for Alligator Cracks in Flexible Pavement (Louisiana PMS Guide
2006)
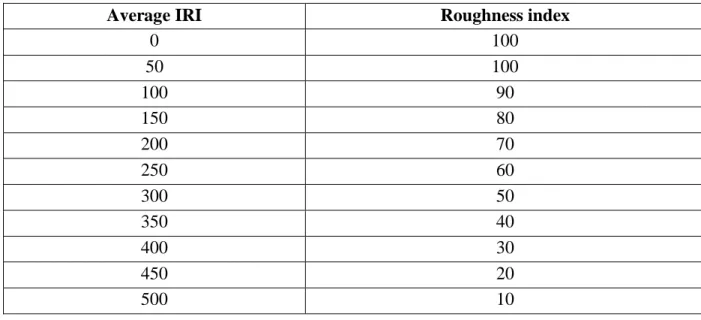
For roughness and rutting, LADOTD has established distress indices according to the average IRI and rutting depth, respectively, as shown in Table 2.6 and Table 2.7 (Khattak et al. 2007).
Table 2.6 Roughness Index Adopted by LADOTD According to Average IRI (Khattak et al. 2007)
Average IRI Roughness index
0 100 50 100 100 90 150 80 200 70 250 60 300 50 350 40 400 30 450 20 500 10
Table 2.7 Rutting Index Adopted by LADOTD According to Rutting Depth (Khattak et al.
2007)
Rutting depth (In) Rutting Index
0.000 100 0.125 100 0.250 90 0.500 70 0.750 50 1.000 30 1.250 10 1.375 0
Various threshold values have been set for each performance index and the corresponding treatment action according the pavement family as shown in Table 2.8.
Table 2.8 LADOTD Trigger Values for Rehabilitation Technique According to Roadway
Functional Classification(Louisiana PMS Guide 2006)
Treatment type Alligator
cracks
Random Patching Rutting Roughness
Micro-surfacing on interstate ≥98 ≥98 ≥98 ≥80 <90 ≥85
Thin overlay on interstate ≥90 ≥85 ≥90 <80 ≥85
<90 Medium overlay on interstate ≥65 <90 <90 ≥65 <90 <85 Structural overlay on interstate <65 <65 Micro-surfacing on arterial ≥95 ≥95 ≥95 ≥65 <80 ≥80
Thin overlay on arterial ≥90 ≥80
<95
≥80
<65 ≥70
<80
Medium overlay on arterial ≥50
<90
<80 ≥60
<80
<70
Structural overlay on arterial <50 <60
Polymer surface treatment on collector ≥85 <95 ≥80 <95 ≥85 ≥65 ≥80 Micro-surfacing on collector ≥95 ≥95 ≥95 ≥65 <80 ≥80 Medium overlay on collector ≥60 <85 <80 ≥65 <85 <65 ≥60 <80 In place stabilization on collector <60 <65 <60
2.3.11 Data Presentation and Outputs
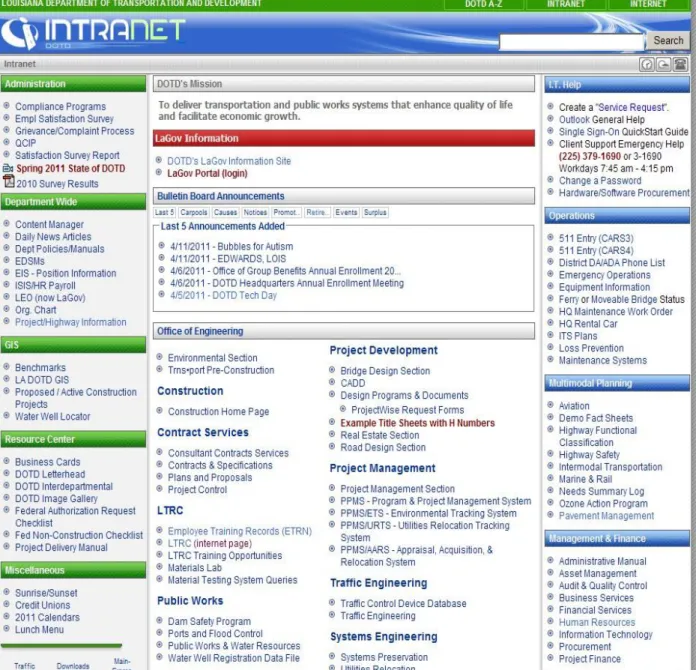
The LADOTD has provided a web application with GIS interface, which is known as “intranet version of LADOTD’s PMS” as shown in Figure 2.14, which enables LADOTD personnel to view the most current pavement condition data and examine the effects of each rehabilitation scenario on the budget.
Figure 2.14 Intranet Version of LADOTD’s PMS
The application allows LADOTD personnel to view the recommended projects and resulting condition for each budget scenario. The web application can also generate different types of reports as described herein.
2.3.11.1 Detailed Report
This report presents every need section (Tenth mile sections), which matches the criteria as defined by the user. Specific route or parish could be selected and observed. The sections could be filtered with more information like pavement type, highway type, the index range, etc. Once the selection criteria has been decided, a grid will be displayed with results with the option to export to Excel or Access.
2.3.11.2 Summary Report
This report gives a summary of pavement condition and the functional class for the set of roads selected by the user. The filtering criteria includes parish, district, functional class, pavement type, funding class and condition index.
2.3.11.3 Data Report
This report presents a detailed listing of each record for a specific report selected by the user. 2.3.11.4 Index Plot
This report aids users to create an annual plot of any selected index either for an individual TOPS section or for every tenth mile in the section as shown in Figure 2.15.
Figure 2.15 Example of Index Plot Report
2.3.12 GIS Mapping Interface
The software contains a GIS interface, which provides users with an easy and effective method to monitor pavement conditions directly on maps and locate the areas in needs of rehabilitation.
Example for Roughness Index map in Lincoln Parish at year 2009 is shown in Figure 2.16.
Figure 2.16 Lincoln Parish Roughness Index Map in year 2009
GIS maps also present the type of treatments suggested or the type of treatment that have been applied to each route or section. Figure 2.17 presents the treatment strategy selected by the LADOT PMS for Monroe in District 05 according to distress data collected in year 2009.
2.3.13 Performance Prediction Models and Decisions
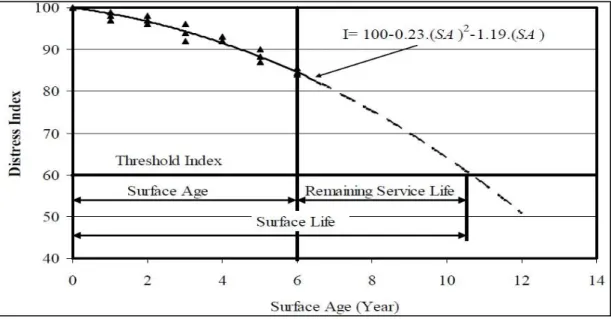
Future pavement conditions could be predicted by performance models. Performance models can be utilized to determine the required maintenance and/or rehabilitation treatment as well as the deterioration rate and remaining service life (RSL) or the pavement as shown in Figure 2.18 (Khattak et al. 2009). Performance models are function of traffic loads, traffic volumes, material properties, weather data and pavement age as shown in the following equation (Khattak et al. 2009):
Distress Index = ESALa *{b (Design)c + d(Soil)e + f(Weather)g + h(Materials)i} (2.4) where a, b, c, d, e, g, h and i are regression constants and ESAL = Equivalent Single Axle Load. Empirical (Regression) models are used to predict and observe the pavement performance. The graphs of performance index vs. time for each pavement family are plotted using performance curves. The pavement families are classified based on pavement type (composite, asphalt, jointed concrete, and continuously reinforced concrete pavements) and highway classification of IHS, NHS, SHS and RHS (Khattak et al. 2008). The distress index models currently used by LADOTD are based on at least six years of data collected at two-year intervals. The models are a function of “Age” of the pavement that follows the various transformation functions. Table 2.9 presents the performance prediction models used by LADOTD for flexible pavements in year 2010.
Figure 2.18 Distress Index vs. Surface Age as an Output of the Performance Prediction
Models (Khattak et al. 2008)
Table2.9 Performance Prediction Models for Flexible Pavement
in Louisiana (Louisiana PMS Guide 2010)
Category Equation
Alligator Cracking Arterial 100 - 0.7027 * AGE
Alligator Cracking Collector 100 - 0.6795 * AGE Alligator Cracking Interstate 100 - 0.4172 * AGE
Patching Arterial 100 - 0.2130 * AGE
Patching Collector 100 - 0.2628 * AGE
Patching Interstate 100 - 0.2183 * AGE
Random Cracking Arterial 100 - 1.6102 * AGE
Random Cracking Collector 100 - 1.7534 * AGE Random Cracking Interstate 100 - 1.6102 * AGE
Roughness Arterial 0.0003 * (AGE) ** 3 - 0.0391 * (AGE) ^ 2 - 0.7983 * (AGE)
+ 100
Roughness Collector 0.0002 * (AGE) ** 3 - 0.0311 * (AGE) ** 2 - 0.5665 *
(AGE) + 100
Roughness Interstate 0.0003 * (AGE) ** 3 - 0.0391 * (AGE) ** 2 - 0.7983 * (AGE)
+ 100
Rutting Arterial 100 * EXP(-0.0121 * AGE)
Rutting Collector 100 * EXP(-0.008 * AGE)
Rutting Interstate 100 * EXP(-0.0121 * AGE)
2.4 Continuous Deflection Measurements
The FWD is widely used to assess the structural capacity of in-service pavements (Kumlai et al. 2014). However, the stop and go process necessitates traffic control to ensure drivers and workers’ safety, which limits the use of the FWD at the network level (Alavi et al. 2008). Continuous deflection measuring devices—that in most cases operate at traffic speed—allow a better spatial coverage with less negative impact on mobility compared with the FWD (Katicha et al. 2014). SHRP2 project R06(F) listed the following devices to meet the definition of a continuous deflection device: the Portancemetre, the moving FWD, the Measuring Ball, the traffic speed Deflectometer (TSD), the rolling dynamic deflectometer (RDD), the (RWD), the airfield rolling weight deflectometer (ARWD), the road deflection tester (RDT), and the image deflection measurement device (IDM) (Flintsch et al. 2012).
2.4.1 Continues Deflection Devices 2.4.1.1 The Portancemetre
The Portancemetre is a rolling vibrating wheel apparatus as shown in Figure 2.19, which is adequate to measure modulus in the range of 4.3 to 43ksi, and it is able to make about 9.3 mile
measurements per day (morel 1998 et al. and Quibel 2007). A 2.2 kips wheel is mounted on a
specific trailer using a retractable axle. A system comprising a hydraulically unbalanced mass makes the wheel vibrate at a 35 Hz frequency to provide an additional 1.3 kips loading. The vertical acceleration components of the vibrating and suspended masses is measured through instrumentation. The double integration of the vertical acceleration signal is then used to determine the vertical load applied to the ground as well as the corresponding deflection. Since the wheel is pulled at a slow speed (2 to 2.5 mph), measurements are taken every 1.2 in., and the peak deflection is reported at intervals of 3.3-ft (Flintsch et al. 2012). The apparatus could be used effectively to evaluate the bearing capacity of rail road tracks (Hosseingholian et al. 2009).
Figure 2.19 The Portancemetre (Hosseingholian et al. 2009)
2.4.1.2 The Measuring Ball
The Measuring Ball is a vibrating steel wheel attached to a two-wheel, one-axle trailer towed by a car moving at 3 mph. An accelerometer mounted at the wheel hub is used to measure the vertical vibration of the wheel. The principle of the measurement is based on the idea that the stiffness of the ground will cause an acceleration at the wheel. The acceleration measurements are reported to a computer located in the towing vehicle, and the relationship between the acceleration peak and the resulting sinusoidal acceleration signal is calculated. Relative stiffness of the ground is measured and expressed in a scale ranges from 0 to 150. The peak load generated by the vibration is unknown however it is expected to be significantly less than the typical load of a heavy vehicle (Flintsch et al. 2012).
2.4.1.3 Rolling Dynamic Deflectometer
The (RDD), shown in Figure 2.20, was developed in the 1990s at the Center for Transportation Research in Austin (Bay and Stokoe, 1998). It was developed as a nondestructive method for determining continuous deflection profiles of pavements (Bay et al.2006). The RDD is heavy truck weighing about 45 kips and operates at a speed of 3 mph (Arora et al. 2007). It is capable two apply a dynamic load of 70 kips at frequency ranges from 5 to 100 Hz using a servo-hydraulic vibrator. Two sets of dual tires mounted side by side on separate axels 4 ft. apart are used to transmit the load. Accelerometers mounted between the aforementioned sets are used to measure the deflection using the double integration technique (Flintsch et al. 2012). The RDD
is a desirable tool to be used for better evaluation of jointed concrete pavements (JCPs) as it can
continuously characterize conditions of each slab and all joints and cracks(Zhou et al. 2011). A
comparison between RDD and FWD data showed very good correlation however the RDD measures only three deflections (Bay and Stokoe, 1998)
Figure 2.20 The Rolling Dynamic Deflectometer (Bay and Stokoe, 1998)
2.4.1.4 Airfield Rolling Weight Deflectometer
The ARWD was developed originally to measure the deflection of airfield pavements based on the Benkelman Beam approach (Andrén et al. 2000). It is designed to measure the runway deflection under a wheel load of 9 kips while it is operated at a speed of 20 mph. Four sensors spaced 9 ft. apart are used to measure the deflection due to the applied load, so that the deflection basin could be determined. It was noticed that the deflection of the physical beam (which the sensors are mounted in) causes significant errors in the measurements. To overcome that the ARWD is now upgraded and uses a laser beam which provides the ability of measuring the deflection of the physical beam in order to correct the measured pavement deflection (Flintsch et al. 2012).
Figure 2.21 The Airfield Rolling Weight Deflectometer (Elseifi et al. 2012)
2.4.1.5 The Traffic Speed Deflectometer
The first Traffic Speed Deflectometer TSD was developed in Denmark in the late 1990s (Rasmussen et al. 2002). The TSD is an articulated truck with a rear axle load of 22 kips, and it operated at a speed of 45 to 50 mph. Four Doppler lasers mounted on a servo-hydraulic beam
are used to measure the deflection velocity of the loaded pavement (Simonin et al. 2005).Three
Doppler lasers are positioned to measure deflection velocity at distances of 4, 8 and 12 in,or 4, 12, and 30 in from the rear axle in the two present versions. The fourth sensor, is used as a reference laser, which is located12 ft. in front of the rear axle outside the deflection bowl (Flintsch et al. 2012). The main concept is to measure the vertical deflection velocities through the Doppler sensors then the deflection slope is calculated by divide the deflection velocity by the vehicle speed. By integrating the deflection slope numerically the absolute deflection could be calculated (Zofka et al. 2014). This procedure might introduce an additional source of error during measurement or calculations (Elseifi et al. 2012).
Figure 2.22 Traffic Speed Deflectometer (Flintsch et al. 2012)
2.4.1.6 The Rolling Wheel Deflectometer
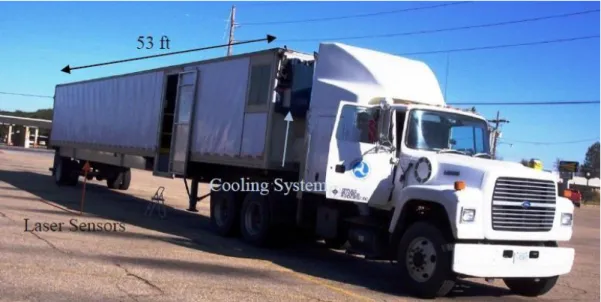
The Rolling Wheel Deflectometer (RWD) was developed by Applied Research Associates (ARA), Inc. to measure pavement surface deflections at traffic speeds in order to characterize the structural capacity of in-service pavements. The first RWD prototype was developed in the late 1990s and was designed to perform measurements on airfield pavements at a maximum speed of 6 mph with a load up to 50 kips (Briggs et al. 2000). The new version of the RWD is capable of measuring deflection while being operated at the traffic speed (55 mph) with a load of 18 kips. The RWD system is mounted within a custom-designed 53 ft. semitrailer, which applies the load through a regular dual-tire assembly over the rear single axle (Gedafa et al. 2008).Three lasers located in front of the dual tires (away from the applied load and the deflection bowl) are used to measure the unloaded pavement surface deflection, and a fourth laser (additional lasers have been added in a newer version) located between the dual tires and just behind the rear axle measures the deflected pavement surface. Deflection is calculated by comparing “spatially coincident” scans as the RWD moves forward (Diefenderfer 2010). At a speed of 55 mph, the RWD’s 2-kHz lasers can take measurements approximately every 11 mm (0.5 in.), resulting in an extremely large set of data. The average deflection is reported every 160 m (0.1 mi); such averaging helps in reducing both scatter and file size. A comparison conducted
between some of the aforementioned devices is summarized in Table 2.10 (Elseifi, et al. 2012, Flintsch et al. 2012, and Nam 2010)
Figure 2.23 The Rolling Wheel Deflectometer (Elseifi et al. 2012)
Figure 2.24 Illustration of the Spatially-Coincident Method (Elseifi et al. 2012)
Table 2.10 Comparison between Continuous Deflection Measurement Devices (Elseifi, et al.
Device Name
Operational
Speed Sensor Type
Sensor Accuracy Applied load Sampling frequency Number of measurement points RDD 3 mph Geophone (velocity transducer) 0.05 mils 70 kips 2-3 ft. Up to 4 ARWD 20 mph Laser displacement sensor 0.8 mil 9 kips 9 ft. 1 RWD 55 mph Laser displacement sensor ±2.75
mils 18 kips 0.6 in. Up to 4
TSD 50 mph Laser Doppler Sensor (displacement velocity)
±4 mils/s 11 kips 0.8 in. Up to 7
2.4.2 Recent Continuous Deflection Testing Studies 2.4.2.1 Louisiana
A comprehensive testing program was conducted in Louisiana in two phases (Abdel-Khalek et al. 2012).In the first phase, the complete asphalt road network (about 2,010 mi.) in District 05, referred to as network sites, was tested using the RWD deflection system based on the manufacturer standard testing protocol. Researchers also selected 58 sections to be tested using FWD. In the second phase, 16 road-sections (each1.5 mi.), referred to as research sites, were selected and used for a detailed evaluation of RWD technology (Abdel-Khalek et al. 2012). In addition to RWD testing, the field testing plan in Phase II conducted FWD testing on selected flexible and surface treatment pavement test sites. The testing plan specified that FWD testing should be conducted within 24 hours following completion of RWD testing on the selected sites in order to maintain the same testing conditions.
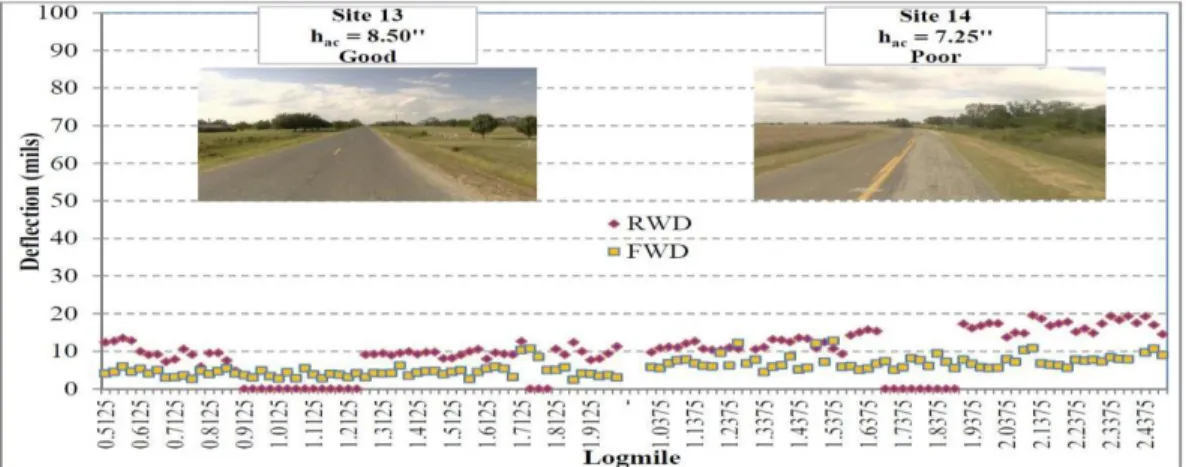
The repeatability of RWD measurements was assessed by the coefficient of variation [COV (%) = standard deviation x 100/ average] for the 16 research sites at various testing speeds. The repeatability of the measurements was acceptable with a COV ranging from 7 to
20% with an average of 15%. It was noticed that measurements were more scattered in sites with poor conditions than in sites that were in relatively good conditions at the time of the survey as shown in Figure 2.25. The uniformity of the measurements through the length of the test section was also evident in sites with good pavement conditions.
Figure 2.25 RWD and FWD Defelctions at Sites 13 and 14(Elseifi et al.2012)
To assess the effects of truck speed on the measured deflection, RWD testing was conducted on the research sites at different speeds (20, 30,40,50,60 mph). The influence of the testing speed on the measured deflection was minimal. A statistical analysis of variance was conducted between the different speeds and revealed that the data groups were not statistically different at a level of significance of 0.05 (Abdel-Khalek et al. 2012). Figure 2.26 presents the effect of speed on the RWD deflection