• No results found

Temperature and precipitation extremes in century-long gridded observations, reanalyses, and atmospheric model simulations

N/A
N/A
Protected

Academic year: 2021

Share "Temperature and precipitation extremes in century-long gridded observations, reanalyses, and atmospheric model simulations"

Copied!
16
0
0

Loading.... (view fulltext now)

Full text

Figure

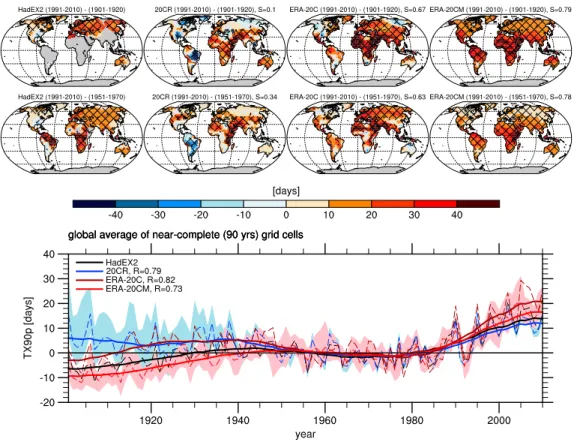
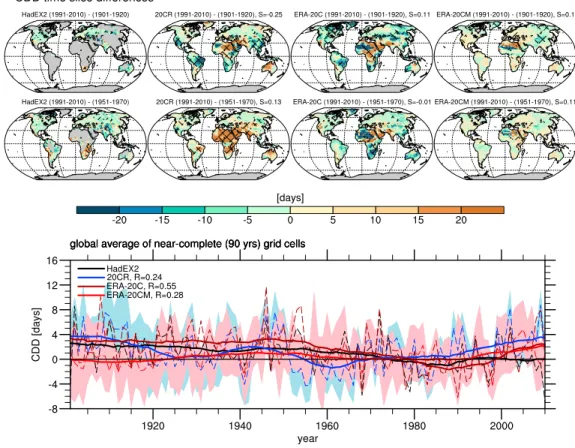
Figure 1. Regional and global changes in the number of warm days (TX90p). ( first row) Time slice differences between the most recent 20 year average (1991 –2010) and the earliest 20 year average (1901–1920) of the analysis period
Figure 3. Regional and global changes in the hottest day of the year (TXx). For detailed description of the plot see Figure 1 caption.
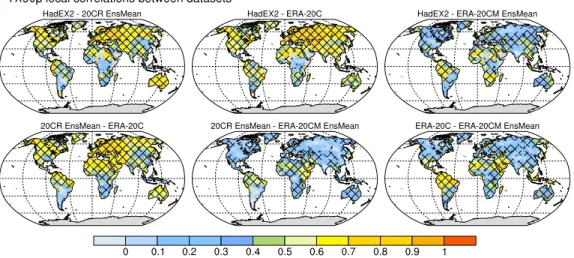
Figure 5. Maps of local correlations between the different data sets for TN10p. The time series from each grid cell were detrended prior to calculating correlations
Figure 9. Regional and global changes in precipitation from very wet days (R95p). For detailed description of the plot see Figure 1 caption.
+2

References

Related documents