EuroVis Workshop on Visual Analytics (2017) M. Sedlmair and C. Tominski (Editors)
Visual Comparative Case Analytics
Dominik Sacha1, Wolfgang Jentner1, Leishi Zhang2, Florian Stoffel1, and Geoffrey Ellis1 1University of Konstanz, Germany2Middlesex University London, UK
Abstract
Criminal Intelligence Analysis (CIA) faces a challenging task in handling high-dimensional data that needs to be investigated with complex analytical processes. State-of-the-art crime analysis tools do not fully support interactive data exploration and fall short of computational transparency in terms of revealing alternative results. In this paper we report our ongoing research into providing the analysts with such a transparent and interactive system for exploring similarities between crime cases. The system implements a computational pipeline together with a visual platform that allows the analysts to interact with each stage of the analysis process and to validate the result. The proposed Visual Analytics (VA) workflow iteratively supports the interpretation of obtained clustering results, the development of alternative models, as well as cluster verification. The visualizations offer a usable way for the analyst to provide feedback to the system and to observe the impact of their interactions.
Categories and Subject Descriptors(according to ACM CCS): H.3.3 [Information Search and Retrieval]: Clustering—H.5.2 [User Interface]: Interaction styles, User-centered design—I.7.5 [Document Capture]: Document analysis—
1. Introduction
Comparative Case Analysis (CCA), also called Similar Fact Anal-ysis (SFA) [PB00] is an important tool for criminal investigation and crime theory extraction [NPI08]. Given a collection of crime reports, the idea is to analyze the commonalities between crime cases in order to support reasoning and decision making. For ex-ample, examining solved crimes that have similar characteristics as an unsolved crime may help the analyst generate a new hypothe-sis during a criminal investigation, and understanding the uneven distribution of crimes in terms of spaces, types of offenders and victims may help the police to allocate police resources more effec-tively [Cop04]. CCA starts with the extraction of relevant headings (factors) that are considered to be useful for the understanding of the crime cases. Information is then collated under the headings, re-sulting in a CCA table where each row is a crime case. A main focus of the heading extraction is the extraction of features and concepts from free text fields such as the Modus Operandi (MO) of crimes. For example given the MO of a burglary case“offender smashed a window to enter the apartment, untidily searched for money or jewelery, and exited through the main door”, concept terms such as“smash”,“window”, “search”,“money”and“jewelry” may be extracted from the text and used as CCA table headings.
The work reported in this paper addresses some challenges in CCA as part of the EU funded project “Visual Analytics for Sense-making and Criminal Intelligence Analysis” [VAL] that aims to develop VA tools that improve the effectiveness of current CIA solutions. We design our system in close collaboration with one police officer with data analysis background and receive feedback
on a regular basis from several involved police forces across Eu-rope. According to our police partners, traditionally CCA is car-ried out manually on a spreadsheet. The task becomes increas-ingly difficult due to the growing volume and complexity of to-day’s crime data, especially in terms of heading extraction and pattern identification and exploration. Existing visual text ana-lytics approaches such as IN-SPIRE [Wis99] (and its predeces-sors [EFN12a,BNHL14]), or recent works described by Ruppert et al. [RSB∗17] shed light on the possibility of automatically pro-cessing textual documents to obtain and explore document clus-ters. Recent work by Sacha et al. [SZS∗17] surveyed existing vi-sual Dimensionality Reduction (DR) approaches that let the an-alyst interact with different parts along the DR pipeline (e.g., [JZF∗09,ML14,BLBC12,RL15]). Few related works deal with the application of CCA (e.g., Zhang et. al [ZRN∗16]) and generic, vi-sual intelligence data analysis systems such as Jigsaw [SGL08] and a projection based approach presented by Jäckle et al. [JSM∗17] do not allow police officers to form the customary structured tables.
In this paper, we present our ongoing research on the develop-ment of a VA system to assist crime analysts in conducting CCA more efficiently and effectively. The system design is based on a number of analytical tasks we derived through the discussion with our end users, including:
Task 1. Understand Cluster Characteristics: A major task of CCA is to identify groups of crimes that have similar patterns and to understand the key features that “define” their main characteristics. Task 2. Develop Alternative Clusterings:The analyst needs to be able to evaluate the clustering result. Therefore, it is essential to
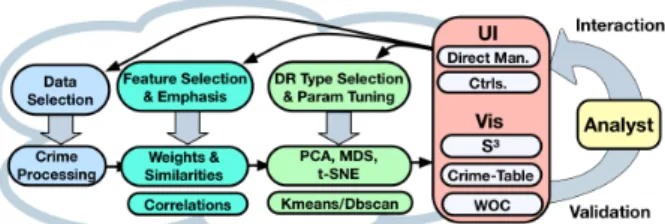
Figure 1:The described visual interactive DR system embeds a DR pipeline (bottom) into an iterative exploration process (right) with several user interactions (top).
enable interactive exploration by letting the analyst provide feed-back about important/uninteresting features or groupings.
Task 3. Verify Cluster Robustness:The analyst needs to ver-ify the robustness and stability of the clustering result. This in-cludes examining changes of grouping caused by different feature weightings (e.g., removing or adding features) as well as checking if the clustering result is stable across different computation meth-ods (e.g., using different DR or clustering algorithms).
Driven by these tasks, we designed a VA approach in a user-driven design study with domain experts from CIA. The system instantiates the process model for interactive DR proposed Sacha et al. [SZS∗17] with the aim to provide an interactive visual plat-form for the analyst to examine groups of similar crimes as well as their main characteristics. Figure1illustrates the framework. The DR pipeline (bottom row) is embedded in an iterative exploration process (right) with several ways to provide interactive feedback to the underlying analytics (top row).
2. Dimensionality Reduction (DR) Pipeline
The DR pipeline takes crime reports as input, transforms the data into a binary feature vector, calculates weighted similarities and ap-plies several DR and clustering techniques to obtain crime clusters.
Crime Processing:We apply a natural language processing
ap-proach to extract semantically meaningful terms from the unstruc-tured text field (“Modus Operandi”), based on a number of seed word lists. The result is a binary feature vector where each row records the presence or absence of each term in a crime report.
Feature Space:A weighted similarity model multiplies each
bi-nary feature value with a weight between zero and 100. Changing the weights triggers a recalculation of the distance matrix and the DR algorithm. Euclidean distance is used to compute the distances serving as input to the distance-based DR algorithms. For linear DR techniques we normalize the feature values according to weights to adjust the features’ variance. The system also calculates Pearson correlations between features to support the analyst in understand-ing relationships between features.
Dimensionality Reduction:Three DR algorithms for
generat-ing 2D embeddgenerat-ings of the data are implemented, includgenerat-ing the widely used linear approachPCA[Pea01], the distance-based ap-proachesMDS[KW78] that tries to preserve large distances in the data, andt-SNE[MH08] that aims to preserve neighborhoods.
Clustering:The final step of our pipeline appliesDBSCAN
clus-tering to the obtained embedding. The parameters can be tuned by
the analyst if the clustering does not provide useful groupings. Al-ternatively the analyst can set the number of desired clusters (k) and apply thek-meansalgorithm.
Note that the data processing techniques, DR/clustering algo-rithms, distance measures and correlation coefficient described above are only a subset of possible choices selected based on their popularity and suitability for the analysis tasks. We are still work-ing with domain experts to evaluate and refine the selection. The computational result of the entire pipeline are passed to the visual-ization components. In the next section we describe how they can be used in an interactive and iterative exploration process.
3. Visual Interactive Crime Case Exploration
Our work focuses on the development of a crime cluster table (CCT) that tightly integrates with different interactive visualiza-tions of the DR pipeline (Similarity Space Selector – S3). The pre-sented components are part of a web-based framework that includes further tools to analyze crimes from different perspectives. It is pos-sible to apply data selections based on terms, as well as, spatial, and temporal constraints. All components are linked to enable interac-tive data exploration (linking & brushing).
3.1. CCT – Crime Cluster Table
We adopted a spreadsheet based approach that comes close to the mental models of the domain experts to visualize detailed crime and cluster characteristics. The analyst is presented with an ag-gregated cluster representation that encodes feature frequencies in each cell of the table (clusters are represented as rows and features in columns, see Figure2-steps 4,8,11). Sorting the feature columns results in comparable feature histograms for each cluster. We devel-oped this visualization as an essential component for investigating and understanding crime clusters (Task 1). The analysts can further expand any cluster representation to reveal the detailed crimes as columns listing the contained concept terms (see Figure2-step 4). Outliers without a cluster label will be listed in separate rows below the clusters. Feature weights are mapped to font size and the user can directly adjust them within the table (by clicking on a term and changing the weight using a slider, see Figure2-step 4). Updated results are then obtained from the DR pipeline (Tasks 2 and 3).
3.2. S3– Similarity Space Selector
S3combines several visualizations of the underlying DR pipeline and allows the analyst to interactively explore and steer the com-putations to develop a task-driven similarity model (or spatializa-tion) of crimes. It includes: a) a scatterplot visualizing the crimes (dots) and cluster boundaries (convex hulls), with the most frequent features of each cluster shown as labels on top of the cluster (see Figure2-step 1); b) a correlation matrix for identifying highly cor-related (often redundant) or mutually exclusive features (see Fig-ure2-steps 2,3) and c) an interactive bar chart that shows weights of features used for the current configuration (see Figure2-step 5). The aim is to help the analyst understand characteristics of the data and the clusters (e.g., cluster sizes and shapes as well as fea-ture weightings, Task 1). Dragging the feafea-ture bars will change the weights and trigger a recalculation of the pipeline (similar to the weight slider in the CCT). Alternatively, the analyst can click on
Fe at ur e Se le ct io n & E m ph as is
1 Initial Clustering (T1) 2 Correlations (T1)
3 Rem. Dupl. (T2)
4 Interpret Clusters (T1) & Feature Weighting (T2) 5 Observe Cluster Distortion (T3)
DR T yp e Se le ct io n & P ar am et er T un in g 6 Switch to MDS (T3) 7 Apply Clustering (T2) 8 Interpret Clusters (T1) 9 Switch to t-SNE (T3)
10 Develop new Clustering (T2) 11 Interpret Cluster Characteristics (T1) 12. Switch to MDS (T3)
13. Switch to PCA (T3) 1.00 smash smash -0.49 window door 0.40 smash window
Figure 2:Example usecase: The system can be used to understand and refine the feature weights (top) as well as the used DR and
clus-tering configurations (bottom). Clusters can be explored and interpreted using the crime table. Changes to the similarity model and DR configuration can be tracked using animated transitions and cluster distortions.
cells in the correlation matrix to remove redundant (highly corre-lated) features. The analyst can switch between different DR algo-rithms in the control panel (top panel in Figure2-step 5, Task 2). A re-computation of the embedding will be triggered each time when the analyst changes the feature weight or the DR algorithm. Ani-mated transition of the dots is used to transform the old embedding to the new one in order to preserve users mental map and highlight the changes. Importantly, changes of weight and DR algorithm does not automatically trigger re-clustering of the data. This allows the analyst to track if clusters get distorted or repositioned in the em-bedding enabling the cluster verification task (Task 3). Based on the observations, the analyst can go ahead with the new clustering.
3.3. Example Use Case
This section describes an exemplary use case that emerged from our initial requirements analysis and was refined based on several rounds of user feedback provided by our domain experts. Figure2
illustrates a simple use case where the analyst starts with feature selection & emphasis (top) and changes over to DR type selec-tion & parameter tuning (bottom) to generate clusters. In step 1, the analyst is presented with the result computed with the default configuration (equal weights, PCA, DBSCAN) that does not pro-vide much to go on. Therefore, the analyst switches to the corre-lation plot and investigates the correcorre-lation matrix (step 2) as well as a version with sorted correlation cells (step 3). First, the ana-lyst detects interesting relations, such as the positive correlation between“smash”and“window”and negative correlation between
“door”and“window”. The analyst also spots some redundant fea-tures (correlation = 1, e.g.,“door”occurs twice in the feature vec-tor) and removes the redundancy by clicking at the respective cells to dis-select. Subsequently, the analyst investigates the CCT to un-derstand the clustering result and decides to increase the weight of the features“window”and“door”. After the feature selection and emphasis step, the analyst notices that the cluster gets verti-cally distorted (step 5). In order to double check, the analyst gen-erates a new embedding using MDS and noticed that the crimes are re-grouped in four clusters (step 6). Continuing the investiga-tion, the analyst tunes the parameters of the clustering algorithm and reruns the clustering. The resulting clusters are shown in step 7 and propagated back to the CCT (step 8) where the analyst spots that the clusters are mainly distinguished by two features,“door”
and“window”(as intended). To verify these clusters the analyst updates the embedding by running t-SNE instead of MDS (step 9) and observes that the clusters are similar (valid), however, some sub-clusters seem to emerge. The analyst then develops a new clus-tering by tuning the parameters (step 10) and the results are auto-matically updated in the CCT (step 11). The S3projection and the CCT can now be used in combination to analyze cluster character-istics (e.g., features) and spatial properties (e.g., shape, size, and distance). These clusters can be further tested and verified by going back to other DR types. In MDS (step 12) the three main clusters (colored in light blue, blue, and purple) are still separated with the remaining clusters as subsets. Switching to PCA also reveals that these clusters overlap (from a feature perspective) and some ob-jects are plotted on top of each other. In this way the analyst gets
Feature Selection & Emphasis Clusterings
DRTypes
DR Type Selection & Parameter Tuning
Figure 3:The component (WOC) tracks user defined changes to the
similarity model (line chart) and DR pipeline configurations (bars).
a feeling about different DR types without much expertise in the computational aspects of the algorithms. By investigating the final clustering result in more detail (steps 10 and 11) the analyst finds that the three main clusters (colored in light blue, blue, and purple) cover multiple features and mainly differ in terms of the contain-ments of“door”and/or“window”, while the other clusters repre-sent crimes that cover only a single concept term of interest (e.g., orange –“insecure”, green –“force”, red –“door”). The analyst may explore these crimes further with other widgets (e.g., map) or apply other data filters to investigate clusters in more detail. Note that the feature characteristics (such as the dominance of“window”
and“door”in our example) vary depending on the selected input data and analysis task (e.g., a specific region or timespan).
3.4. WOC – Weight Observer Component
We are in the process of developing a weight observer component (Figure3) that records analytic provenance [XAJ∗15] with the aim of capturing and evaluating user interactions [End16]. The feature weights are visualized as line charts and the bars below represent the used clustering (top bar) and DR configuration (bottom bar). Hovering over the lines or bars will reveal the tracked information (e.g., feature identifier, clustering technique with parameters, and DR type). The component can be used to understand and observe what the analyst did and which functionalities of the pipeline were used. For example, in Figure3we can track the interaction of our example use case and clearly identify the two phases of the anal-ysis. In the beginning the analyst changed some feature weights (line chart) before the analyst developed cluster alternatives and tested different DR types (blue bars change over to different con-figurations). We can use this approach to further investigate how different analyst use our tool and which interactions are used to solve particular analysis tasks. This can also be used as a history tool to recalculate the saved configurations on demand.
4. Discussion
The system was developed in collaboration with domain experts who provided us with feedback over a period of 1.5 years and hence, we are able to enumerate observations and lessons learned.
Our initial user interface comprised multiple scatterplots that show visual embeddings of crimes generated using different con-figurations (DR types, feature subsets, etc.). Without much train-ing, our end users reported that it was difficult to understand the
different results and settings. They considered the concept of DR to be very abstract and found it hard to interpret and trust the result shown in scatterplots where the “meaning of axis” is missing. Our experts reported more positive feedback after we added the crime table and focused our visual interface on a single plot that can be in-teractively explored. Interacting with the system and observing the changes helped the analysts to understand how the methods work and how they can interpret the obtained results. There might be a training effect, however, we also learned that it is essential to pro-vide the analysts with tools they are familiar with (e.g., the spread-sheets) and the interpretablity of the results is the key to build trust in the system and to provide useful interactive feedback. It is also worth mentioning that the system helped us (as developers) to un-derstand the extracted data. We realized that some features occur with high frequency while others are very sparse. We will continue to refine the seed lists and introduce a threshold to “cut off’ sparse features. The cut will also speed up the pipeline calculations.
Like many VA tools, the scalability of our system is limited. Our domain experts suggested a typical “targeted” analysis task (e.g., looking at crimes happened in last three months in a spe-cific region) involves no more than 500 crimes. For our use cases the tool worked reasonably well on 1000 crimes with 200 fea-tures. However, calculating the distances and sorting is bounded by computational complexity. We plan to improve this by apply-ing samplapply-ing [KVHD17] or progressive approaches [Fek15,FP16] to improve the scalability. For future work, we aim to enrich the table interactions with semantic mappings to DR pipeline adaption (inspired by Endert et al.’s work on semantic interac-tion [EFN12a,EFN12b,End16]). For example, we want to allow the analyst to re-arrange columns or rows to derive feature weights. Similarly, we want to automatically derive which DR type is closest to the analyst’s feedback (e.g., when the analyst declares two clus-ters as similar). Furthermore, the VALCRI project will move into its final phase that will focus on the deployment and integration of all partner’s components, fine-tuning the data preparation, and the evaluation of the VALCRI system. Our plan is to measure quantita-tively which interactions are used, to capture the analysis processes of different analysts, and to collect qualitative feedback.
5. Conclusions
We introduced our research in designing an interactive CCA sys-tem in collaboration with domain experts. Our DR pipeline imple-mentation supports a variety of interactions but we observed and learned that analysts may be overwhelmed by a plethora of visual alternatives and configuration options. To tackle this problem we allow the users to interpret the obtained results and interact directly in the crime table (the tool that they are familiar with) that helped them to understand and importantly, build trust in the computations. Our visual interaction design is generalizable to other data types and applications. To this end, we now include additional structured metadata, such as the weekday or known offender properties (e.g., gender) in our analysis.
Acknowledgments
This work was supported by the EU project VALCRI under grant number FP7-SEC-2013-608142.
References
[BLBC12] BROWNE. T., LIUJ., BRODLEYC. E., CHANGR.: Dis-function: Learning distance functions interactively.IEEE Conf. on Visual Analytics in Science and Technology (VAST)(2012), 83–92. doi:10. 1109/VAST.2012.6400486.1
[BNHL14] BRADEL L., NORTH C., HOUSEL., LEMAN S.: Multi-model semantic interaction for text analytics. IEEE Conf. on Visual Analytics in Science and Technology (VAST)(2014), 163–172. doi: 10.1109/VAST.2014.7042492.1
[Cop04] COPEN.: Intelligence led policing or policing led intelligence?: Integrating volume crime analysis into policing. Br. J. Criminol. 44 (2004), 188–203.1
[EFN12a] ENDERTA., FIAUXP., NORTHC.: Semantic interaction for sensemaking: Inferring analytical reasoning for model steering. IEEE Trans. on Visualization and Computer Graphics 18, 12 (2012), 2879– 2888.doi:10.1109/TVCG.2012.260.1,4
[EFN12b] ENDERTA., FIAUXP., NORTHC.: Semantic interaction for visual text analytics. InACM SIGCHI Conf. Human Factors in Comput-ing Systems (CHI)(2012), pp. 473–482. doi:10.1145/2207676. 2207741.4
[End16] ENDERTA.: Semantic Interaction for Visual Analytics: Infer-ring Analytical Reasoning for Model SteeInfer-ring. Synthesis Lectures on Visualization. Morgan & Claypool Publishers, 2016. doi:10.2200/ S00730ED1V01Y201608VIS007.4
[Fek15] FEKETEJ.-D.: ProgressiVis: a Toolkit for Steerable Progres-sive Analytics and Visualization. In1st Workshop on Data Systems for Interactive Analysis(Chicago, United States, Oct. 2015), p. 5.4
[FP16] FEKETEJ., PRIMETR.: Progressive analytics: A computation paradigm for exploratory data analysis.CoRR abs/1607.05162(2016).4
[JSM∗17] JÄCKLED., STOFFELF., MITTELSTÄDTS., KEIMD. A., REITERERH.: Interpretation of Dimensionally-Reduced Crime Data: A Study with Untrained Domain Experts. Proc. Int. Conference on Infor-mation Visualization Theory and Applications(2017).1
[JZF∗09] JEONGD. H., ZIEMKIEWICZC., FISHERB. D., RIBARSKY
W., CHANG R.: iPCA: An interactive system for pca-based visual analytics. Computer Graphics Forum 28, 3 (2009), 767–774. doi: 10.1111/j.1467-8659.2009.01475.x.1
[KVHD17] KWONB. C., VERMAJ., HAASP. J., DEMIRALPÇ.: Sam-pling for scalable visual analytics.IEEE Computer Graphics and Appli-cations 37, 1 (2017), 100–108.doi:10.1109/MCG.2017.6.4
[KW78] KRUSKALJ. B., WISHM.:Multidimensional scaling, vol. 11. Sage, 1978.2
[MH08] MAATENL.V.D., HINTONG.: Visualizing data using t-sne. Journal of Machine Learning Research 9, Nov (2008), 2579–2605.2
[ML14] MOLCHANOV V., LINSENL.: Interactive Design of Multidi-mensional Data Projection Layout. InEuroVis - Short Papers(2014), Elmqvist N., Hlawitschka M., Kennedy J., (Eds.), The Eurographics As-sociation.doi:10.2312/eurovisshort.20141152.1
[NPI08] NPIA: National policing improvement agency: Professional practice on analysis, 2008. URL:http://www.acpo.police.uk/ documents/crime/2008/200804CRIPAA01.pdf.1
[PB00] PROWSEJ., BENNETTE.: Working Manual of Criminal Law. Carswell Legal Pubns, Mar 2000.1
[Pea01] PEARSONK.: On lines and planes of closest fit to systems of points in space.Philosophical Magazine 2(1901), 559–572.2
[RL15] RIECKB., LEITTEH.: Persistent homology for the evaluation of dimensionality reduction schemes. Computer Graphics Forum 34, 3 (2015), 431–440.doi:10.1111/cgf.12655.1
[RSB∗17] RUPPERTT., STAABM., BANNACHA., LÜCKE-TIEKEH., BERNARDJ., KUIJPERA., KOHLHAMMERJ.: Visual interactive cre-ation and validcre-ation of text clustering workflows to explore document collections.Electronic Imaging 2017, 1 (2017), 46–57.1
[SGL08] STASKOJ. T., GÖRGC., LIUZ.: Jigsaw: supporting investiga-tive analysis through interacinvestiga-tive visualization.Information Visualization 7, 2 (2008), 118–132. doi:10.1057/palgrave.ivs.9500180.
1
[SZS∗17] SACHAD., ZHANGL., SEDLMAIRM., LEEJ. A., PELTO
-NENJ., WEISKOPFD., NORTHS. C., KEIMD. A.: Visual interaction with dimensionality reduction: A structured literature analysis. IEEE Trans. on Visualization and Computer Graphics 23, 1 (2017), 241–250.
doi:10.1109/TVCG.2016.2598495.1,2
[VAL] Visual analytics for sense-making and criminal intelligence anal-ysis, http://www.valcri.org/, last retrieved 22nd feb.,2017. URL:http: //www.valcri.org/.1
[Wis99] WISE J. A.: The ecological approach to text visualiza-tion. JASIS 50, 13 (1999), 1224–1233. doi:10.1002/(SICI) 1097-4571(1999)50:13<1224::AID-ASI8>3.0.CO;2-4.
1
[XAJ∗15] XU K., ATTFIELD S., JANKUN-KELLY T. J., WHEAT A., NGUYENP. H., SELVARAJN.: Analytic provenance for sensemaking: A research agenda. IEEE Computer Graphics and Applications 35, 3 (2015), 56–64.doi:10.1109/MCG.2015.50.4
[ZRN∗16] ZHANG L., ROONEY C., NACHMANSON L., WONG B. L. W., KWONB. C., STOFFELF., HUNDM., QAZIN., SINGHU., KEIMD. A.: Spherical similarity explorer for comparative case analy-sis. InVisualization and Data Analysis 2016, San Francisco, California, USA, February 14-18, 2016(2016), pp. 1–10.1