Zurich Open Repository and Archive University of Zurich Main Library Strickhofstrasse 39 CH-8057 Zurich www.zora.uzh.ch Year: 2013
A comparison of the strength of biodiversity effects across multiple functions
Allan, Eric ; et al
Abstract: In order to predict which ecosystem functions are most at risk from biodiversity loss, meta-analyses have generalised results from biodiversity experiments over different sites and ecosystem types. In contrast, comparing the strength of biodiversity effects across a large number of ecosystem processes measured in a single experiment permits more direct comparisons. Here, we present an analysis of 418 separate measures of 38 ecosystem processes. Overall, 45 % of processes were significantly affected by plant species richness, suggesting that, while diversity affects a large number of processes not all respond to biodiversity. We therefore compared the strength of plant diversity effects between different categories of ecosystem processes, grouping processes according to the year of measurement, their biogeochemical cycle, trophic level and compartment (above- or belowground) and according to whether they were measures of biodiversity or other ecosystem processes, biotic or abiotic and static or dynamic. Overall, and for several individual processes, we found that biodiversity effects became stronger over time. Measures of the carbon cycle were also affected more strongly by plant species richness than were the measures associated with the nitrogen cycle. Further, we found greater plant species richness effects on measures of biodiversity than on other processes. The differential effects of plant diversity on the various types of ecosystem processes indicate that future research and political effort should shift from a general debate about whether biodiversity loss impairs ecosystem functions to focussing on the specific functions of interest and ways to preserve them individually or in combination.
DOI: https://doi.org/10.1007/s00442-012-2589-0
Posted at the Zurich Open Repository and Archive, University of Zurich ZORA URL: https://doi.org/10.5167/uzh-81794
Journal Article Accepted Version
Originally published at:
Allan, Eric; et al (2013). A comparison of the strength of biodiversity effects across multiple functions. Oecologia, 173(1):223-237.
A comparison of the strength of biodiversity effects across multiple functions
Eric Allan1,2, Wolfgang W. Weisser1,3, Markus Fischer2,4, Ernst-Detlef Schulze5, Alexandra Weigelt1,6,
Christiane Roscher5,7,, Jussi Baade8, Romain L. Barnard9, Holger Beßler10, Nina Buchmann9, Anne
Ebeling1, Nico Eisenhauer11,12,3, Christof Engels10, Alexander J. F. Fergus13, Gerd Gleixner5, Marlén
Gubsch13, Stefan Halle1, Alexandra M. Klein14,15, Ilona Kertscher1,Annely Kuu1,16, Markus Lange1,
Xavier Le Roux17, Sebastian Meyer3, Varvara D. Migunova18, Alexandru Milcu19,20, Pascal A.
Niklaus13, Yvonne Oelmann21, Esther Pašalić1, Jana S. Petermann 13,22, Franck Poly17, Tanja
Rottstock4, Alexander Sabais11, Christoph Scherber14, Michael Scherer-Lorenzen23, Stefan Scheu12,
Sibylle Steinbeiss5,24, Guido Schwichtenberg25, Vicky Temperton5,26, Teja Tscharntke14, Winfried
Voigt1, Wolfgang Wilcke27, Christian Wirth5,28, Bernhard Schmid13
1
Institute of Ecology, Friedrich Schiller University of Jena, Dornburger Str. 159, 07749 Jena, Germany
2
Institute of Plant Sciences, University of Berne, Altenbergrain 21, 3013 Berne, Switzerland
3
Technische Universität München, Department für Ökologie und Ökosystemmanagement, Hans-Carl-von-Carlowitz-Platz 2, 85354 Freising, Germany
4
Department of Botany, Institute of Biochemistry and Biology, University of Potsdam, Maulbeerallee 1, 14469 Potsdam, Germany
5
Max Planck Institute for Biogeochemistry, Hans-Knoell Str10, 07745 Jena, Germany
6
Institute for Biology I, University of Leipzig, Johannisallee 21-23, 04103 Leipzig, Germany
7
UFZ, Helmholtz Centre for Environmental Research, Department of Community Ecology, Theodor-Lieser-Strasse 4, 06120 Halle, Germany
8 Institute of Geography, Friedrich Schiller University Jena, Loebdergraben 32, 07743 Jena, Germany 9 Institute of Plant Sciences, ETH Zurich, Universitaetsstr. 2, 8092 Zurich, Switzerland
10 Institute of Plant Nutrition, Humboldt University Berlin, Invalidenstr. 42, 10115 Berlin, Germany 11 Darmstadt University of Technology, Institute of Zoology, Schnittspahnstr. 3, 64287 Darmstadt,
12 University of Goettingen, J.F. Blumenbach Institute of Zoology and Anthropology, 37073
Goettingen, Germany
13 Institute of Evolutionary Biology and Environmental Studies, University of Zürich,
Winterthurerstr.190, 8057 Zurich, Switzerland
14 University of Göttingen, Agroecology, Department of Crop Sciences, Waldweg 26, 37073
Göttingen, Germany
15 Institute of Ecology, Ecosystem Functions, Leuphana University of Lüneburg, Germany 16 Tallinn University of Technology, Tartu College, Puiestee 78, 51008 Tartu, Estonia.
17 Université de Lyon, INRA, CNRS, Université Lyon 1, Microbial Ecology Centre (UMR 5557
CNRS, USC 1193 INRA), bat. G. Mendel, 43 boulevard du 11 Novembre 1918, 69622 Villeurbanne, France.
18 K.I. Skryabin All–Russian Institute of Helminthology, Moscow, Russia 19
Imperial College London, Silwood Park, Buckhurst Road, Ascot SL5 7PY, UK
20
CNRS Ecotron, 1 Chemin du Rioux, Campus Baillarguet, 34 980 Montferrier-sur-Lez, France
21
Geographic Inst., Professorship of Soil Geography/Soil Science, Johannes Gutenberg Univ., Johann-Joachim-Becherweg 21, 55128 Mainz, Germany
22
Institute of Biology, Freie Universität Berlin, Königin-Luise-Str. 1-3, 14195 Berlin, Germany
23
Faculty of Biology, University of Freiburg, Schaenzlestr. 1, 79104 Freiburg, Germany
24
Helmholtz Centre Munich, German Research Center for Environmental Health (GmbH), Ingolstaedter Landstr. 1, 85764 Neuherberg, Germany
25
Helmholtz Centre for Environmental Research (UFZ), Permoserstraße 15, 04318 Leipzig, Germany
26
Phytosphere Institute ICG-3, Forschungszentrum Juelich GmbH, 52425 Juelich, Germany
27 Soil Science Group, Geographic Institute, University of Bern, Hallerstrasse 12, 3012 Bern 28 Department of Special Botany and Functional Biodiversity Research, Institute of Biology I,
Abstract
In order to predict which ecosystem functions are most at risk from loss of biodiversity, recent meta-analyses have generalised results from biodiversity experiments over different sites and ecosystem types. In contrast comparing the strength of biodiversity effects across a large number of ecosystem processes measured in a single large-scale experiment permits more direct comparisons. Here we present an analysis of 418 separate measures of 38 ecosystem processes. Overall 45% of processes are significantly affected by plant species richness, suggesting that whilst diversity affects a large number of processes not all respond to biodiversity. We therefore compare the strength of plant diversity effects between different categories of ecosystem processes: grouping processes according to their biogeochemical cycle, trophic level and compartment (above- or belowground) and according to whether they are measures of animal diversity or other measures, biotic or abiotic measures and static measures of pool sizes or dynamic measures of fluxes. We find that measures of the carbon cycle were affected more strongly by plant diversity loss than were the measures associated with the nitrogen cycle. We also found greater plant species richness effects on measures of animal diversity than on other measures, suggesting that loss of diversity at one trophic level can have strong cascading effects on diversity at other trophic levels. The differential effects of biodiversity on the various types of ecosystem processes indicate that future research and political effort should shift from a general debate about whether biodiversity loss impairs ecosystem functions, to focussing on the specific functions of interest and ways to preserve them individually or in combination.
Keywords: biodiversity ecosystem functioning, functional groups, carbon storage, nitrogen cycling, Jena Experiment
Introduction
Understanding the relationship between biodiversity and ecosystem functioning is of great theoretical interest for understanding the processes structuring communities and of practical importance to predict the effect of human-induced biodiversity loss. Numerous experiments have demonstrated that a range of ecosystem functions depend on biodiversity (usually species richness) (Hector et al. 1999; Loreau et al. 2001; Tilman et al. 2001; Hooper et al. 2005). In addition, certain key functional groups, such as grasses and legumes in grassland ecosystems, can also have large effects on ecosystem functioning (Hooper et al. 2005). However it is still not clear which particular ecosystem variables are most strongly affected by species richness or functional group composition: this question is important as it relates to our understanding of the mechanisms that underlie the biodiversity-ecosystem functioning relationship. For biodiversity research to be predictive, it is therefore necessary to move forward from showing that biodiversity has an effect on functioning to investigating which functions are most strongly affected.
Recently meta-analyses and syntheses have attempted to answer this question by comparing the strength of biodiversity effects on different processes, across different experiments (Balvanera et al. 2006; Cardinale et al. 2006; Schmid et al. 2009; Cardinale et al. 2011). This generalises across sites; but processes measured in different experiments may not always be directly comparable. An alternative approach is to synthesize data from a single experiment and to investigate the effect of biodiversity on different processes measured on the same plots (Proulx et al. 2010; Scherber et al. 2010; Rzanny and Voigt 2012). This has the advantage that different variables and ecosystem functions can be directly compared, without being affected by variance between experimental sites. We therefore use this approach here and present a large analysis of results from a German biodiversity experiment, the Jena Experiment (Roscher et al. 2004): we include 418 measures of 38 ecosystem processes.
The length of time an experiment has been running is likely to be an important factor affecting the strength of biodiversity effects found. Biodiversity effects have been shown to be stronger in longer-term experiments, as complementary interactions between species become more important (Cardinale et al. 2007) resulting in less saturating relationships between biodiversity and
function (Reich et al. 2012). Studies have so far focussed on individual variables such as biomass production and it is not clear if this pattern holds across a wider range of ecosystem processes.
The interactions between carbon, nutrient and water cycles are fundamental to ecosystem functioning (Schulze and Zwölfer 1994), and it is therefore important to know whether they are affected differently by biodiversity loss. Loss of biodiversity has been shown to reduce biomass production (Hector et al. 1999; Tilman et al. 2001; Marquard et al. 2009), and affect other pools and fluxes of the carbon (Hooper et al. 2005; Fornara and Tilman 2008; Steinbeiss et al. 2008) and nitrogen cycle (Tilman et al. 1996; Scherer-Lorenzen et al. 2003; Hooper et al. 2005; Palmborg et al. 2005; Oelmann et al. 2011). A relationship between plant biomass production and nutrient uptake would be expected in ecosystems strongly limited by nutrients where resource-use complementarity for nutrients may be the dominant mechanism driving the species richness biomass relationship (Tilman et al. 2001). However such a tight relation between biomass production and nutrient uptake might not be expected in productive systems or those limited by factors other than nutrient availability: for instance if plant enemies not nutrients limit biomass production in low diversity communities (Maron et al. 2010; Schnitzer et al. 2011).
Plant diversity has been shown to have a larger effect on above- than belowground animal groups in the Jena Experiment (Scherber et al. 2010) and belowground processes in general might therefore be less strongly affected by species richness than are aboveground processes (Hooper et al. 2005). Plant diversity might also have larger effects on biotic than on abiotic measures, in particular strong effects of plant species richness on animal abundance and diversity are to be expected due to co-evolutionary interactions between plants and animals (e.g. Haddad et al. 2009) but this might not be true for plant species richness effects on abiotic processes such as biogeochemical cycling. Finally, the contrast between measures of fluxes and measures of standing stocks has been suggested as a major distinction between types of functions (Pacala and Kinzig 2001). Many of these contrasts, between biogeochemical cycles, above and belowground variables and biotic and abiotic variables will be at least partially confounded, for instance many nutrient measures are likely to be abiotic and belowground. Therefore only a large analysis with many measures of each category of process can determine which contrasts are the most important for predicting plant diversity effects.
It has also been suggested that soil processes such as decomposition, nutrient uptake and nutrient retention are affected more by the functional traits of dominant species than by species richness per se (Hooper et al. 2005). Functional composition, and the presence of legumes in particular
(Vitousek and Howarth 1991; Temperton et al. 2007), could therefore have a larger effect on nutrient cycling than species richness does.
Understanding the effect of changes in plant diversity for other trophic levels is important for predicting the impact of plant species extinctions on total biodiversity. A previous synthesis of results from the Jena Experiment (Scherber et al. 2010) investigated the effects of plant species richness on the abundance and diversity of other organisms, and on some organism–related processes, and found that the response of different organisms to plant diversity varied strongly. Herbivores were more likely to show a significant response to plant species richness than were predators, parasitoids or omnivores. This suggests strong bottom-up effects on multitrophic interaction networks and shows that plant diversity effects on higher trophic levels are indirectly mediated through bottom-up trophic cascades. Here, we also test these ideas and extend the analysis of Scherber et al. (2010) by including a larger number (418) of measures of ecosystem processes that come from all compartments of the ecosystem, i.e. our analysis is not restricted to measures of animal groups.
Plant species richness might have larger effects on animal species richness than on abundance, if rare animal species are only present in diverse plant communities. The analysis by Scherber et al. (2010) showed this pattern for a number of invertebrate groups. In this more extensive dataset we can investigate whether measures of animal diversity are also affected more strongly by plant species richness than other types of measures.
To investigate variation in the strength of plant species richness effects between different types of ecosystem processes, we grouped measured variables into a number of categories (Table 1) associated with basic ecological processes. For each of the measures analysed here, we quantified the effect size of species richness and functional group (legume and grass) presence using Zr-values
(Balvanera et al. 2006). We then analysed the Zr-values for species richness and presence of legumes
and grasses using the ecosystem process categories (Table 1) as explanatory terms (Balvanera et al. 2006; Schmid et al. 2009). We tested the following hypotheses:
1) Plant species richness effects increase in strength over time.
2) Plant species richness has stronger effects on carbon than on nutrient cycling because our experiment is conducted in a productive system and here plant biomass should respond more strongly to species richness than should nutrient uptake.
3) Plant species richness has larger effects on processes measured above- than belowground. 4) Functional groups such as legumes and grasses have stronger effects on nutrient cycling
than plant species richness does.
5) Plant species richness has strong bottom up effects on higher trophic levels (Scherber et al. 2010) and these are larger on lower trophic levels (herbivores vs. carnivores).
6) Plant diversity has its strongest effects on the species richness of animal groups.
Methods
Experimental Design
The measurements reported here were gathered between 2002 and 2008 in the Jena Experiment, a grassland biodiversity experiment in Germany which controlled the number of plant species, functional groups and plant functional identity in 82 plots, each 20 x 20 m, in a randomized block design. Plants belonged to one of four functional groups (for details see Roscher et al. 2004): legumes, grasses, tall herbs and small herbs and the presence/absence of these functional groups was manipulated factorially with species richness. Thus, the design included communities of single functional groups with 1–16 species as well as communities of 16 species ranging from 1–4 functional groups. In our analyses we focus on the effects of legumes and grasses because many studies have identified these as important functional groups and because the herb functional groups might not be comparable with groups in other grasslands. Plots were seeded in May 2002 with 1, 2, 4, 8, 16 or 60 perennial grassland plant species, with 16, 16, 16, 16, 14 and 4 replicates respectively. Plot compositions were randomly chosen from 60 plant species typical for local Arrhenatherum grasslands.
Plots were maintained by mowing, weeding and where possible by applying grass or herb specific herbicides, all twice per year (Roscher et al. 2004).
The dataset
We included 418 measurements of ecosystem processes in our analysis: all measurements were taken independently, i.e. none of the measurements are direct functions of other measures. The 418 measures were nested within 119 variables and these variables were nested within 38 ecosystem processes (see Table S1). The ecosystem processes were in turn nested within 6 larger categories of processes, such as carbon- vs. nutrient-related processes; these groups were partially crossed with each other, e.g. carbon variables could be measured above or below ground and could be biotic or abiotic. Our analysis tested for differences between these larger groups (shown in Table 1). Many of the 119 variables had been measured in multiple years and/or at multiple soil depths and we included all of these multiple measures in our analyses in order to test for trends in the strength of effects over time and soil depth. However, we used mixed modelling to account for the nestedness of measurements and the spatial and temporal autocorrelation of variables; see below.
Statistical analysis
Deriving Zr-values and significances for the individual measures
We calculated effects of plant species richness, or the presence of functional groups, on each of these 418 measures as the standardized correlation coefficient Zr, an effect-size value often used in meta-analysis (Gurevitch and Hedges 1999). Zr-values were extracted from analysis of variance (ANOVA) models using the following formula:
(1: ANOVA model)
r-values were calculated as the proportion of total sum of squares explained by species richness,
legume or grass presence and were converted with a Z-transformation to improve normality, using the formula (Rosenberg et al. 2000):
Zr = 0.5 ln ((1 + r) / (1 – r))
Sequential (type-I) sums of squares were used (Schmid et al. 2009), which means effects of legumes were corrected for species richness and effects of grasses were corrected for species richness and legumes. According to the design of the Jena Experiment these explanatory factors are as nearly as possible, but not perfectly, orthogonal to each other (Roscher et al. 2004). All analyses were conducted using the statistical package R 2.14 (R Development Core Team 2010).
Comparing diversity effects between different categories of ecosystem process
To compare different categories of process we then analysed Zr-values, related to plant species richness and functional group effects, as a function of the ecosystem process categories in Table 1. This analysis is essentially a derived variable analysis and is therefore equivalent to a repeated measures analysis using the original data. It is also similar to a analysis in which meta-data taken from a single experiment are analysed to show differences among within-experiment explanatory terms but is different to standard meta-analysis conducted on data from many experiments. Within-experiment here refers to the fact that each particular ecosystem process category (for instance all measures related to the carbon cycle) is represented by several variables which can be considered as independent replicate measures for the purpose of comparing between different groups (e.g. comparing carbon and nitrogen measures). Of course, however, unlike in a typical meta-analysis, but as in all experimental studies, our conclusions will only apply to this one experiment.
Mixed modelling
Linear mixed-models (fitted using the lme4 package Bates and Sarkar 2007 in R) were used to analyse the Zr-values. The different ecosystem process categories presented in Table 1 were used as
fixed explanatory terms. We used random effects to account for the nestedness of our data: measures nested within ecosystem variables, ecosystem variables within ecosystem processes. Mixed models included ecosystem variable identity as a random effect with 119 levels (Variable in model formula, column 2 in Table S1). Crossed with this term, were random effects for year and soil depth (many soil measures were taken at different depths; all aboveground measures were coded as 0 depth). Ecosystem process (Fig. 1) was included as a random effect with 38 levels and we also included the interaction between ecosystem process and year as another random effect; this had 109 levels. In order to test for temporal or spatial trends in the Zr-values we included linear contrasts for year and soil depth as fixed
terms. We also conducted a jackknife analysis (see below) to check that our results were robust to any additional sources of non-independence between measures. As some measures were only taken on a subset of plots, the Zr-values were also weighted by the proportion of plots on which the original
measure was taken.
All fixed terms (the explanatory terms in Table 1 as well as year and soil depth) were fitted both individually and in a combined analysis, i.e. they were removed from the full model (equation 2) and added to the minimal model (equation 3). As a conservative test, we only considered fixed effects significant if they were significant in both cases, i.e. when added to the null model and when removed from the full model. We used these stringent rules because the fixed effects were not fully orthogonal to each other and we wanted to ensure that our conclusions would hold both if an explanatory term of interest was, or was not, corrected for other, correlated explanatory terms. Significance for each term was assessed by model comparison using likelihood ratio (L-ratio) tests (Crawley 2007). In addition, significance of terms was assessed using Markov Chain Monte Carlo sampling (Baayen et al. 2008), for terms fitted in the full model, which did not change the significance of any terms. The full and null models (using the syntax of the lme4 package Bates and Sarkar 2007) are shown below; see Table 1 for a description of the fixed effect terms and Table S1 for the assignment of variables to the different fixed and random effect terms:
(2: full model)
year(linear) + SoilDepth(linear) + BiogeochemicalCycle + TrophicLevel + DiversityOthers + AbioticBiotic + Compartment + StaticDynamic + (1|Variable) + (1|SoilDepth) + (1|year) + (1|EcosystemProcess) + (1|EcoystemProcess:year)
(3: minimal model)
intercept + (1|Variable) + (1|SoilDepth) + (1|year) + (1|EcosystemProcess) + (1|EcoystemProcess:year)
Further analyses with biogeochemical cycle
In order to explore species richness effects on different biogeochemical cycles further, the analysis was restricted to variables that were direct measures of carbon, nutrients or water. This analysis, therefore, excluded variables such as plant biomass or animal abundances, which could be associated with multiple biogeochemical cycles (see Table S1 for list of excluded variables), and was conducted with 67 carbon measures, 83 nutrient measures and 38 water measures. Equation 2 was used to fit these models but without the terms “TrophicLevel” and “DiversityOthers”, as there were no measures of animals included. We also repeated this analysis including aboveground pool sizes of carbon and nitrogen in plant tissue (shoot and root), instead of measures of carbon and nitrogen concentrations in plant biomass. Pool size is calculated as concentration × plant biomass. Note that we included concentrations and not pool sizes in the main analysis because pool sizes are closely correlated with plant biomass and would therefore not be independently measured variables, as they represent linear combinations of concentrations and biomass.
Differences between carbon and nutrient cycles could be due to differences in the size or in the sign of the Zr values. For some variables it could be argued that a negative sign indicates a positive
effect of diversity on function. It is clear that a positive correlation between species richness and biomass equates to a positive effect on function but in other cases this might not be straightforward. For instance, lower soil nitrogen levels might correspond to increased plant nitrogen uptake, which would be associated with an increase in functioning. However, lower soil nitrogen might also result
from a decreased mineralization rate, which would imply a decrease in functioning. To avoid these problems we analysed Zr-values with their original sign but repeated the analysis with the sign
reversed for soil N variables. As a more conservative test we also repeated the analysis of direct measures of carbon, nutrients and water, including pool sizes rather than concentrations and reversing the sign for all those ecosystem variables that had a negative mean Zr-value (these were: soil nitrate,
soil 15N values, soil phosphorus, plant 15N values and methane oxidation). Therefore, in this analysis all ecosystem variables analysed had a positive mean Zr-value, although clearly some of the individual measures of each ecosystem variable were still negative. Note that it is not possible to analyse absolute Zr-values because this would inflate effect sizes. Ecosystem variables that are not significantly affected by diversity should on average have a Zr-value of zero, corresponding to a mix of slightly positive and slightly negative Zr-values for the different measures. Absolute Zr-values
would mean ecosystem variables always had a positive mean Zr-value and thus would appear to be
correlated with diversity even if they were not.
A larger number of carbon-related measures (294) had been taken compared with nutrient-related measures (83) or water-nutrient-related measures (41). To assess whether this unequal sampling affected the significance of the biogeochemical cycle term, the number of carbon and nutrient-related measures was equalised with the number of water-related variables by randomly selecting 41 carbon-related and 41 nitrogen-carbon-related measures. This process of jackknifing also provides a much more conservative test, as only 123 measures are included instead of 418. The analysis was repeated 1000 times with different sets of randomly selected carbon and nutrient variables using the following formula:
(4: Jackknife model)
year(linear) + SoilDepth(linear) + BiogeochemicalCycle + (1|Variable) + (1|SoilDepth) + (1|year) + (1|EcosystemProcess) + (1|EcoystemProcess:year)
Significance of the term biogeochemical cycle was therefore assessed by comparing models fitted with (4) to models fitted with (3), using L-ratio tests.
Results
Across all processes species richness had on average a positive effect (mean effect size ± one standard error = 0.08±0.05; this is the intercept from a linear mixed model without any fixed effects (equation 3) and is therefore corrected for the random effects). The linear terms for year and soil depth were significant in the analysis of species richness Zr-values: the slope for year was positive
(0.026±0.008) indicating an increase in the magnitude of Zr values, and thus effects of species
richness, over time from 0.02 in 2002 to 0.19 in 2008, Figure 1. The slope for the soil depth term was negative (–0.0022±0.0007), indicating a decrease in the strength of the species richness effect with increasing soil depth.
Overall, nearly half of the ecosystem processes measured were affected by species richness. When confidence intervals were calculated around the mean Zr-value for each of the 38 ecosystem
processes (see Figure 2), 17 (45%) had confidence intervals which did not cross 0, suggesting that 45% of processes are significantly affected by species richness on average.
Differences between ecosystem processes categories
Two of the ecosystem process categories showed significant overall species richness effects: biogeochemical cycle and diversity/others (Fig. 1; Table 2). On average, plant species richness had a strong positive effect on variables related to the carbon cycle (Zr-value 0.15±0.05), but negligible overall effects on nutrient (mostly nitrogen) cycle related variables (–0.05±0.0.7) and variable effects on measures of water (0.2±0.19), see Figs. 1a and 3a. Most variables associated with the carbon cycle, including biomass of plants, abundance of animals and soil organic carbon storage, were positively correlated with diversity (Fig. 1a), while among the water variables only water content of the topsoil was significantly affected. In contrast to the overall positive effects on carbon and water variables, most measures related to the nitrogen cycle had small Zr-values (Fig. 1a) and their confidence
intervals included zero, suggesting zero or small effects of plant species richness on soil nitrogen pools and fluxes (Fig. 1a). The Zr-values for species richness effects were also significantly affected by the
other organisms (0.35±0.09) than on other measures such as animal abundances and abiotic measures (0.06±0.05).
None of the grouping variables significantly affected the Zr-values for effects of grasses or
legumes (Fig. 1b-c and Table 2), although the strength of grass effects increased with time (slope 0.011±0.004). Legume effects on nutrient measures were larger than were species richness effects: the average Zr- value for legume effects on nutrient measures was 0.13±0.07 compared to a species
richness Zr-value of –0.05±0.07. Grass effects on nutrient measures were also stronger than species
richness effects but were more negative: the average Zr-value was -0.08±0.04. Most measures of
nutrients increased with legume presence, in particular nitrogen concentrations in plants and microbes as well as the nitrate pool size (Fig. 1b). Grass presence had negative effects on nitrogen tissue concentrations and nitrate pools (Fig. 1c). For carbon measures, species richness effects were larger (0.15±0.05) than were legume (0.07±0.04) or grass (0.008±0.01) effects.
Further analyses with biogeochemical cycle
We also carried out a number of sensitivity analyses to explore the differences in the size of species richness effects between different biogeochemical cycles. When only variables that were direct measures of carbon, nutrients or water (i.e. excluding biomass and abundance measures, see Table S1) were included in the comparison between the biogeochemical cycle groups, this resulted in an increase in the significance of the term, from p=0.03, with all variables included, to = 9.1; p=0.01 with only direct measures (both p-values for deletion of the term from the full model, Fig. 3b), this result further supports stronger species richness effects on the carbon than the nutrient cycle. When aboveground pool sizes of nitrogen and carbon in plant tissue were used instead of concentrations in this analysis, the comparison between groups remained significant on deletion from the full model ( = 6.5 p = 0.04) and marginally so when biogeochemical cycle was tested on its own (= 4.8, p = 0.09).
When the analysis of Zr-values was carried out with the sign for the soil nutrient variables reversed, the biogeochemical cycle term was still significant (addition = 8.2, p = 0.01; deletion
p=0.03). When the sign was reversed for only those soil variables with a negative mean
-value, biogeochemical cycle also remained significant (addition = 6.9, p = 0.03; deletion = 8.2, p = 0.02). When direct measures of C and N were analysed, using pool sizes rather than concentrations and with the sign for all variables with a negative mean Zr-value reversed, biogeochemical cycle remained significant when deleted from the full model ( = 8.2 p=0.01), although not when tested alone ( = 2.6, p=0.27).
When the analysis of biogeochemical cycles was repeated using equal numbers of carbon-, nutrient- and water-related measures, the biogeochemical cycle term was significant in 836 out of 1000 runs. This suggests that unequal sampling did not affect the results. It also suggests that the result was robust to a decrease in the degrees of freedom for testing the effect of biogeochemical cycle, as it generally remained significant when only 30% of the variables were included. This indicates that any additional non-independence between variables, not accounted for by our random effect structure, did not bias the result for the biogeochemical cycle term.
Together, our additional sensitivity analyses on the differences between biogeochemical cycles support larger overall species richness effects on the carbon cycle and small or variable effects on the nutrient and water cycles.
Discussion
Overall ecosystem processes were positively correlated with plant diversity. The average Zr
-value for species richness effects was 0.08±0.05, slightly higher than the figure of 0.039 reported in a meta-analysis of grassland studies by Balvanera et al. (2006). This shows that positive effects of species richness dominate across a wide range of ecosystem processes. Our analysis also revealed that around 45% of ecosystem processes were significantly affected by plant species richness. Plant species richness effects are therefore important for a large number of ecosystem processes, though not all processes respond. It is, however, likely that simultaneously maintaining the other processes (those not affected by plant species richness here) at high levels, i.e. maintaining high levels of multifunctionality, would require high plant diversity (Hector and Bagchi 2007; Isbell et al. 2011).
Trends over time
The magnitude of the species richness effect increased since the start of the experiment. Other studies have shown that biodiversity effects on biomass production (Cardinale et al. 2007; Reich et al. 2012) and on soil nitrogen variables (Oelmann et al. 2011) become stronger with time. Functional redundancy between species has been shown to decrease over time resulting in less strongly saturating species richness biomass relationships (Reich et al. 2012) This may be due to an increase in positive, complementary interactions between species over time (Cardinale et al. 2007), and turnover between functionally dissimilar species (Allan et al. 2011), resulting in greater functional diversity in more mature plant communities (Reich et al. 2012). Our analysis shows that this pattern of increasing biodiversity effects over time is consistent and strong across a large range of ecosystem functions.
Differences between biogeochemical cycles
Species richness effects differed between groups of variables belonging to different biogeochemical cycles. On average, we found that plant species richness had strong positive effects on carbon and water variables but slightly negative effects on nutrient measures (mostly nitrogen). A previous meta-analysis of biodiversity effects on function did not find this difference in effect size between biogeochemical cycles (Balvanera et al. 2006) but it has been suggested that changes in vegetation composition may cause imbalance between element cycles (Schulze and Zwölfer 1994). Our results suggest that the contrast between carbon and nutrient measures was more important for predicting the strength of plant species richness effects on ecosystem function than was the contrast between abiotic and biotic measures, measures of pools and fluxes or above- and belowground measures. Our analysis therefore suggests that, despite the usual close coupling of nitrogen and carbon cycling, the loss of plant biodiversity should have larger effects on the carbon than the nitrogen cycle.
There are a number of possible reasons for the difference in plant species richness effects between carbon and nutrient cycles. Plant species richness might have larger effects on carbon than nitrogen cycling because overyielding, the increased biomass production of more species-rich communities compared with less diverse communities, was driven by mechanisms other than resource-use complementarity. Direct measurements of belowground niche differentiation have not yet
provided strong evidence for resource use complementarity in diverse mixtures (von Felten et al. 2009). In productive sites, diverse communities may be limited by light competition (Roscher et al. 2011) which causes plants to invest more in N-poor structural tissue (Hirose and Werger 1995), therefore reducing nitrogen concentrations in aboveground biomass in species rich communities. It has also recently been shown that soil fungal pathogens can drive the diversity–productivity relationship by causing large reductions in biomass in species-poor plant communities (Maron et al. 2010; Schnitzer et al. 2011). In low diversity communities, soil pathogens might also reduce rooting volume therefore reducing uptake of nutrients as well as carbon production (de Kroon et al. 2012). However, aboveground fungal pathogens or herbivores could act in a similar way to belowground pathogens and could also drive the species richness productivity relationship: infection by foliar fungal pathogens strongly decreases with species richness in our experiment (Fig. 1a). These aboveground enemies could remove substantial quantities of biomass in low-diversity communities (Carson et al. 2004; Allan et al. 2010), therefore acting as a carbon sink. In general it may be the case that plant species richness has stronger effects on carbon cycling in systems where plant biomass production is not strongly limited by nutrients but is limited by other factors such as light or plant natural enemies.
Differences between above- and belowground processes
The strength of biodiversity effects decreased with increasing soil depth but contrary to our expectations the contrast between above- and belowground processes was not significant. Smaller plant diversity effects at greater soil depths may result from reduced plant inputs to the soil at depths where root biomass is lower (Jackson et al. 1996). Scherber et al. (2010) found smaller plant species richness effects on belowground invertebrates and others have also suggested that responses of soil animal taxa to plant diversity are idiosyncratic (de Deyn and van der Putten 2005) or take many years to appear (Eisenhauer et al. 2010). Plant species richness has also been suggested to influence soil processes less strongly than aboveground productivity (Hooper et al. 2005). These ideas partially agree with our results but we find that the above-belowground contrast is less important for predicting the strength of plant diversity effects and that instead plant diversity effects decline continuously with increasing soil depth.
Functional group effects
Functional group composition also had strong effects on certain ecosystem processes, in particular those associated with the nitrogen cycle. In general, functional group effects on nitrogen cycling were stronger than species richness effects, even though functional group presence was fitted after species richness in the ANOVA models (see equation 1). Our results agree with a number of other experiments, which have shown strong functional group effects (Hooper and Vitousek 1998; Scherer-Lorenzen et al. 2003; Palmborg et al. 2005; Temperton et al. 2007). Most measures of nitrogen increased with legume presence because legumes have positive effects on nitrogen cycling (Craine et al. 2002; Oelmann et al. 2007; Temperton et al. 2007). Grass presence had negative effects on nitrogen measures most likely because grasses are good competitors for nitrogen and deplete soil nutrient pools (Craine et al. 2002; Oelmann et al. 2007). Therefore, whereas the carbon cycle was mainly affected by plant species richness and grass presence, the nitrogen cycle was affected by legume presence and less so by grass presence. This suggests that changes in functional composition should have a larger effect on nitrogen cycling than would changes in species richness.
Bottom-up effects on higher trophic levels
Our results provide strong evidence for positive bottom-up effects of plant diversity on herbivore, pollinator, pathogen, decomposer and carnivore groups. The increased diversity of plant resources in more species-rich plant communities may allow a larger number of herbivore species, particularly specialists, to coexist (Siemann 1998; Haddad et al. 2009). This result also agrees with other, partial, syntheses of Jena Experiment results (Scherber et al. 2010; Eisenhauer et al. 2011). Unlike the analysis by Scherber et al. (2010), here we find no consistent differences between plant species richness effects for different trophic levels, which also suggests that our analysis is quite conservative. We conclude that loss of plant diversity is therefore likely to have strong bottom-up effects on higher trophic levels.
Plant species richness effects on animal diversity
We found that the diversities of animal groups were more strongly influenced by plant species richness than were abundances of these animals. This might be due to a higher number of rare insect species in high diversity plant communities (Haddad et al. 2009). Declining plant diversity should lead to a faster decline in species richness than in total abundance of animal groups if rarer animal species are the first to be affected by plant diversity loss. This further implies that ecosystem services which depend on animal diversity, such as provision of natural enemies and pollinators, are likely to be particularly threatened by loss of plant species (Blüthgen and Klein 2011).
Conclusions
Our analysis, focused on measures from a single experiment, shows clear patterns of variation among biodiversity effects on a large number of different ecosystem functions. Taken together, our results stress that a wide variety of ecosystem functions will be at risk from local extinctions of plant species, but some will be more sensitive than others. This emphasises the importance of considering a wide set of functions, and a broad range of measures representing those functions, in order to draw general conclusions in biodiversity–ecosystem functioning studies.
Our study indicates that the ability of ecosystems to sequester carbon will be particularly impaired by loss of plant species (Fornara and Tilman 2008; Steinbeiss et al. 2008). While nutrient cycling will probably be less severely affected by plant species loss. In this case, direct effects of nitrogen deposition on nutrient cycling may be more severe than indirect effects mediated through changing species composition (Manning et al. 2006), although a loss of species from the particular functional group of legumes could have strong indirect effects. However, in more strongly nutrient limited systems than ours, loss of plant species richness might have larger effects on nutrient cycling. By the same logic, in arid systems plant diversity might have the largest effects on water cycling. In general, the strength of plant diversity effects on different types of ecosystem processes might depend on which factor most limits biomass production. Further comparative studies, comparing biodiversity effects on multiple processes measured in the same experiment, are needed to test this idea in other systems. We therefore hope that our findings stimulate further tests of the mechanisms underlying
biodiversity effects in order to better understand variation in the strength of effects between different types of ecosystem processes.
Acknowledgments
We would like to thank Volker Kummer (supervised by MF), Peter Mwangi, Maike Habekost (supervised by GG), Yvonne Kreutziger (supervised by WW & YO) and Ramona Müller (supervised by WV) for contributing data. The gardeners and technical staff who have worked on the Jena Experiment, for maintaining the site, weeding, mowing and data collection: Steffen Eismann, Steffen Ferber, Silke Hengelhaupt, Sylvia Junghans, Ute Köber, Katja Kunze, Heike Scheffler and Sylvia Creutzburg, Jens Kirchstein, Olaf Kolle, Gerlinde Kratzsch, Anett Oswald, Ulrike Wehmeier. We would also like to thank a large number of student helpers who were involved in the weeding of the experiment, Cornelius Middelhoff and Jens Schumacher for maintaining the database and Jean-Francois Soussana and Tania Jenkins for comments on the manuscript. This project was funded by the Deutsche Forschungsgemeinschaft DFG with additional contributions from the Swiss National Science Foundation (grant 31003A-107531 to BS).
References
Allan E, van Ruijven J, Crawley MJ (2010) Foliar fungal pathogens and grassland biodiversity. Ecology 91:2572–2582.
Allan E, Weisser W, Weigelt A, Roscher C, Fischer M, Hillebrand H (2011) More diverse plant communities have higher functioning over time due to turnover in complementary dominant species. Proc Natl Acad Sci USA 108:17034–17039.
Baayen RH, Davidson DJ, Bates DM (2008) Mixed-effects modeling with crossed random effects for subjects and items. Journal of Memory and Language 59:390–412.
Balvanera P, Pfisterer AB, Buchmann N, He J, Nakashizuka T, Raffaelli D, Schmid B (2006) Quantifying the evidence for biodiversity effects on ecosystem functioning and services. Ecol. Lett. 9:1146–1156.
Bates D, Sarkar D (2007) Lme4: linear mixed-effects models using S4 classes 0.99875-9.
Blüthgen N, Klein A (2011) Functional complementarity and specialisation: The role of biodiversity in plant–pollinator interactions. Basic and Applied Ecology 12:282–291.
Cardinale BJ, Matulich KL, Hooper DU, Byrnes JE, Duffy E, Gamfeldt L, Balvanera P, O’Connor MI, Gonzalez A (2011) The functional role of producer diversity in ecosystems. Am. J. Bot. 98:572– 592.
Cardinale BJ, Srivastava DS, Duffy JE, Wright JP, Downing AL, Sankaran M, Jouseau C (2006) Effects of biodiversity on the functioning of trophic groups and ecosystems. Nature 443:989–992. Cardinale BJ, Wright JP, Cadotte MW, Carroll IT, Hector A, Srivastava DS, Loreau M, Weis JJ
(2007) Impacts of plant diversity on biomass production increase through time because of species complementarity. Proc Natl Acad Sci USA 104:18123–18128.
Carson WP, Cronin JP, Long ZT (2004) A general rule for predicting when insects will have strong top-down effects on plant communities: on the relationship between insect outbreaks and host concentration. In: Weisser WW, Siemann E (eds) Insects and Ecosystem Function. Springer-Verlag, Berlin.
Craine JM, Tilman D, Wedin D, Reich P, Tjoelker M, Knops J (2002) Functional traits, productivity and effects on nitrogen cycling of 33 grassland species. Funct. Ecol. 16:563–574.
Crawley MJ (2007) The R Book. John Wiley and Sons Ltd., Chichester.
Deyn GB de, van der Putten WH (2005) Linking aboveground and belowground diversity. Trends Ecol. Evol. 20:625–633.
Eisenhauer N, Beßler H, Engels C, Gleixner G, Habekost M, Milcu A, Partsch S, Sabais AC, Scherber C, Steinbeiss S, Weigelt A, Weisser WW, Scheu S (2010) Plant diversity effects on soil
microorganisms support the singular hypothesis. Ecology 91:485–496.
Eisenhauer N, Milcu A, Sabais AC, Bessler H, Brenner J, Engels C, Klarner B, Maraun M, Partsch S, Roscher C, Schonert F, Temperton VM, Thomisch K, Weigelt A, Weisser WW, Scheu S (2011) Plant Diversity Surpasses Plant Functional Groups and Plant Productivity as Driver of Soil Biota in the Long Term. PLoS One 6:e16055.
Felten S von, Hector A, Buchmann N, Niklaus PA, Schmid B, Scherer-Lorenzen M (2009)
Belowground nitrogen partitioning in experimental grassland plant communities of varying species richness. Ecology. Ecology 90:1389–1399.
Fornara DA, Tilman D (2008) Plant functional composition influences rates of soil carbon and nitrogen accumulation. J. Ecol. 96:314–322.
Gurevitch J, Hedges LV (1999) Statistical issues in ecological meta-analyses. Ecology 80:1142–1149. Haddad NM, Crutsinger GM, Gross K, Haarstad J, Knops JM, Tilman D (2009) Plant species loss
decreases arthropod diversity and shifts trophic structure. Ecol. Lett. 12:1029–1039. Hector A, Schmid B, Beierkuhnlein C, Caldeira MC, Diemer M, Dimitrakopoulos PG, Finn JA,
Freitas H, Giller PS, Good J, Harris R, Hogberg P, Huss-Danell K, Joshi J, Jumpponen A, Korner C, Leadley PW, Loreau M, Minns A, Mulder CP, O'Donovan G, Otway SJ, Pereira JS, Prinz A, Read DJ, Scherer-Lorenzen M, Schulze ED, Siamantziouras AS, Spehn EM, Terry AC, Troumbis AY, Woodward FI, Yachi S, Lawton JH (1999) Plant diversity and productivity experiments in European grasslands. Science 286:1123–1127.
Hector A, Bagchi R (2007) Biodiversity and ecosystem multifunctionality. Nature 448:188–190. Hirose T, Werger MJ (1995) Canopy Structure and Photon Flux Partitioning among Species in a
Herbaceous Plant Community. Ecology 76:466–474.
Hooper DU, Chapin FS, Ewel JJ, Hector A, Inchausti P, Lavorel S, Lawton JH, Lodge DM, Loreau M, Naeem S, Schmid B, Setala H, Symstad AJ, Vandermeer J, Wardle DA (2005) Effects of
biodiversity on ecosystem functioning: a consensus of current knowledge. Ecol. Monogr. 75:3–35. Hooper DU, Vitousek PM (1998) Effects of plant composition and diversity on nutrient cycling. Ecol.
Monogr. 68:121–149.
Isbell F, Calcagno V, Hector A, Connolly J, Harpole WS, Reich PB, Scherer-Lorenzen M, Schmid B, Tilman D, van Ruijven J, Weigelt A, Wilsey BJ, Zavaleta ES, Loreau M (2011) High plant diversity is needed to maintain ecosystem services 477:199–202.
Jackson RB, Canadell J, Ehleringer JR, Mooney HA, Sala OE, Schulze ED (1996) A global analysis of root distributions for terrestrial biomes. Oecologia 108:389–411.
Kroon H de, Hendriks M, van Ruijven J, Ravenek J, Padilla FM, Jongejans E, Visser EJ, Mommer L (2012) Root responses to nutrients and soil biota: drivers of species coexistence and ecosystem productivity. Journal of Ecology 100:6–15.
Loreau M, Naeem S, Inchausti P, Bengtsson J, Grime JP, Hector A, Hooper DU, Huston MA, Raffaelli D, Schmid B, Tilman D, Wardle DA (2001) Biodiversity and Ecosystem Functioning: Manning P, Newington JE, Robson HR, Saunders M, Eggers T, Bradford MA, Bardgett RD,
Bonkowski M, Ellis RJ, Gange AC, Grayston SJ, Kandeler E, Marhan S, Reid E, Tscherko D, Godfray HC, Rees M (2006) Decoupling the direct and indirect effects of nitrogen deposition on ecosystem function. Ecol. Lett. 9:1015–1024.
Maron JL, Marler M, Klironomos JN, Cleveland CC (2010) Soil fungal pathogens and the relationship between plant diversity and productivity. Ecol. Lett. 14:36–41.
Marquard E, Weigelt A, Roscher C, Gubsch M, Lipowsky A, Schmid B (2009) Positive biodiversity– productivity relationship due to increased plant density. J. Ecol. 97:696–704.
Oelmann Y, Buchmann N, Gleixner G, Habekost M, Roscher C, Rosenkranz S, Schulze E, Steinbeiss S, Temperton VM, Weigelt A, Weisser WW, Wilcke W (2011) Plant diversity effects on
aboveground and belowground N pools in temperate grassland ecosystems: Development in the first 5 years after establishment. Global Biogeochem. Cycles 25:GB2014.
Oelmann Y, Wilcke W, Temperton VM, Buchmann N, Roscher C, Schumacher J, Schulze ED, Weisser WW (2007) Soil and plant nitrogen pools as related to plant diversity in an experimental grassland. Soil Sci. Soc. Am. J. 71:720–729.
Pacala SW, Kinzig A (2001) Introduction to theory and the common ecosystem model. In: Kinzig A, Pacala S, Tilman D (eds) The functional consequences of biodiversity: empirical progress and theoretical extensions. Princeton Univ Pr, pp 169–174.
Palmborg C, Scherer-Lorenzen M, Jumpponen A, Carlsson G, Huss-Danell K, Hogberg P (2005) Inorganic soil nitrogen under grassland plant communities of different species composition and diversity. Oikos 110:271–282.
Proulx R, Wirth C, Voigt W, Weigelt A, Roscher C, Attinger S, Baade J, Barnard RL, Buchmann N, Buscot F, Eisenhauer N, Fischer M, Gleixner G, Halle S, Hildebrandt A, Kowalski E, Kuu A,
Lange M, Milcu A, Niklaus PA, Oelmann Y, Rosenkranz S, Sabais A, Scherber C, Scherer-Lorenzen M, Scheu S, Schulze E, Schumacher J, Schwichtenberg G, Soussana J, Temperton VM, Weisser WW, Wilcke W, Schmid B (2010) Diversity Promotes Temporal Stability across Levels of Ecosystem Organization in Experimental Grasslands. PLoS One 5:e13382.
R Development Core Team (2010) R: A Language and Environment for Statistical Computing. R Foundation for Statistical Computing, Vienna, Austria.
Reich PB, Tilman D, Isbell F, Mueller K, Hobbie SE, Flynn DF, Eisenhauer N (2012) Impacts of Biodiversity Loss Escalate Through Time as Redundancy Fades. Science 336:589–592. Roscher C, Kutsch WL, Schulze E (2011) Light and nitrogen competition limit Lolium perenne in
experimental grasslands of increasing plant diversity. Plant Biology 13:134–144.
Roscher C, Schumacher J, Baade J, Wilcke W, Gleixner G, Weisser WW, Schmid B, Schulze ED (2004) The role of biodiversity for element cycling and trophic interactions: an experimental approach in a grassland community. Basic Appl. Ecol. 5:107–121.
Rosenberg M, Adams D, Gurevitch J (2000) Metawin 2.0 User’s Manual: Statistical Software for Meta-Analysis. Sinauer Associates, Sunderland, MA.
Rzanny M, Voigt W (2012) Complexity of multitrophic interactions in a grassland ecosystem depends on plant species diversity. Journal of Animal Ecology 81:614–627.
Scherber C, Eisenhauer N, Weisser WW, Schmid B, Voigt W, Fischer M, Schulze E, Roscher C, Weigelt A, Allan E, Beszler H, Bonkowski M, Buchmann N, Buscot F, Clement LW, Ebeling A, Engels C, Halle S, Kertscher I, Klein A, Koller R, Konig S, Kowalski E, Kummer V, Kuu A, Lange M, Lauterbach D, Middelhoff C, Migunova VD, Milcu A, Muller R, Partsch S, Petermann JS, Renker C, Rottstock T, Sabais A, Scheu S, Schumacher J, Temperton VM, Tscharntke T (2010) Bottom-up effects of plant diversity on multitrophic interactions in a biodiversity experiment. Nature 468:553–556.
Scherer-Lorenzen M, Palmborg C, Prinz A, Schulze ED (2003) The role of plant diversity and composition for nitrate leaching in grasslands. Ecology 84:1539–1552.
Schmid B, Balvanera P, Cardinale BJ, Godbold J, Pfisterer AB, Raffaelli D, Solan M, Srivastava DS (2009) Consequences of species loss for ecosystem functioning: meta-analyses of data from
biodiversity experiments. In: Naeem S, Bunker D, Hector A, Loreau M, Perrings C (eds) Biodiversity, Ecosystem Functioning, and Human Wellbeing An Ecological and Economic Perspective. Oxford University Press, Oxford.
Schnitzer SA, Klironomos JN, Hille Ris Lambers J, Kinkel LL, Reich PB, Xiao K, Rillig MC, Sikes BA, Callaway RM, Mangan SA, van Nes EH, Scheffer M (2011) Soil microbes drive the classic plant diversity–productivity pattern. Ecology 92:296–303.
Schulze ED, Zwölfer H (1994) Fluxes in Ecosystems. In: Schulze ED (ed) Flux control in biological systems: from enzymes to populations and ecosystems. Academic Press Inc.
Siemann E (1998) Experimental Tests of Effects of Plant Productivity and Diversity on Grassland Arthropod Diversity. Ecology 79:2057–2070.
Steinbeiss S, BeßLer H, Engels C, Temperton VM, Buchmann N, Roscher C, Kreutziger Y, Baade J, Habekost M, Gleixner G (2008) Plant diversity positively affects short-term soil carbon storage in experimental grasslands. Glob. Change Biol. 14:2937–2949.
Temperton VM, Mwangi PN, Scherer-Lorenzen M, Schmid B, Buchmann N (2007) Positive interactions between nitrogen-fixing legumes and four different neighbouring species in a biodiversity experiment. Oecologia V151:190–205.
Tilman D, Reich PB, Knops J, Wedin D, Mielke T, Lehman C (2001) Diversity and Productivity in a Long-Term Grassland Experiment. Science 294:843–845.
Tilman D, Wedin D, Knops J (1996) Productivity and sustainability influenced by biodiversity in grassland ecosystems. Nature 379:718–720.
Vitousek PM, Howarth RW (1991) Nitrogen limitation on land and in the sea: How can it occur? Biogeochemistry 13:87–115.
Table 1: The explanatory terms used in the analysis.
Six ecosystem process terms were used to group all 418 measurements into the categories shown. In addition to these terms, year and soil depth of measurement were included as continuous fixed terms.
Ecosystem process term
Categories
Biogeochemical cycle
Carbon: variables that are principally carbon, i.e. biomass and abundance measures, carbon concentrations, and CO2 and CH4 emission rates.
Nutrients: measures of nutrient concentrations in the soil and in plant biomass, N-related enzyme activities in soil, N2O emission rates, 15N signals.
Water: measures of soil water.
Trophic Level
Producer: measures of plants.
Herbivore: abundance and species richness of herbivore groups (including pollinating insects and foliar fungal pathogens) and measures of herbivory.
Decomposer: abundance and species richness of decomposer groups. Carnivore: abundance and species richness of carnivorous groups. Ecosystem: abiotic measures.
Compartment Above: all measures taken aboveground. Below: all measures taken belowground.
Diversity vs. others
Diversity: measures of animal species richness. Others: all other measures.
Abiotic vs. Biotic
Abiotic: all abiotic measures. Biotic: all biotic measures.
Static vs. Dynamic
Static: measures of pool sizes Dynamic: measures of fluxes
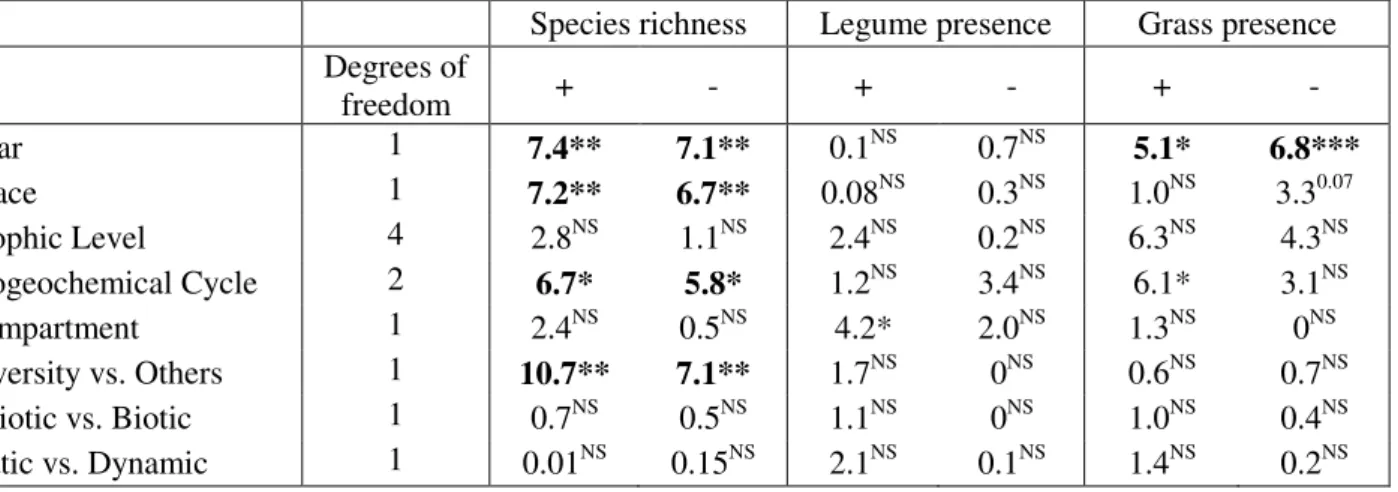
Table 2: The significance of explanatory terms used in the analyses.
Explanatory terms were fitted in linear mixed-effects models with Zr-values for species richness, legume presence or grass presence effects as response variables
(see Methods for description of the models). The table shows values from Likelihood ratio tests: the "+" columns are for the explanatory term fitted alone (i.e. added to the intercept only model) and values in the "-" columns are for terms deleted from a model containing all the other explanatory terms (Methods). Asterisks indicate significance: * at 5% ** 1% and ***0.1%, NS indicates non-significant effects; p-values >0.05 and <0.08 are shown. Values in bold are those that were significant on deletion and on addition, according to our strict criteria these are the only terms that are considered significant.
Species richness Legume presence Grass presence Degrees of freedom + - + - + - Year 1 7.4** 7.1** 0.1NS 0.7NS 5.1* 6.8*** Space 1 7.2** 6.7** 0.08NS 0.3NS 1.0NS 3.30.07 Trophic Level 4 2.8NS 1.1NS 2.4NS 0.2NS 6.3NS 4.3NS Biogeochemical Cycle 2 6.7* 5.8* 1.2NS 3.4NS 6.1* 3.1NS Compartment 1 2.4NS 0.5NS 4.2* 2.0NS 1.3NS 0NS Diversity vs. Others 1 10.7** 7.1** 1.7NS 0NS 0.6NS 0.7NS Abiotic vs. Biotic 1 0.7NS 0.5NS 1.1NS 0NS 1.0NS 0.4NS Static vs. Dynamic 1 0.01NS 0.15NS 2.1NS 0.1NS 1.4NS 0.2NS
Figure Legends
Fig. 1: Change in the size of species richness effects over time. Species richness Zr-values are shown
for each year. The solid line is the prediction from a linear mixed model with the random effect structure in equation 2 and with year fitted as a fixed effect. Dotted lines show ± one standard error.
Fig 2: The effect of (a) species richness and the presence of (b) legumes and (c) grasses on a range of ecosystem processes. All measures have been grouped according to the ecosystem process with which they are associated. Effect sizes, measured as Zr-values, are shown for the different ecosystem
processes with 95% confidence intervals: ecosystem processes whose confidence intervals do not include 0 can be considered to be significantly affected by species richness or functional group presence. The size of the points is scaled according to the number of processes measured in that group. Points represent estimates calculated from Markov Chain Monte Carlo (MCMC) sampling of terms from a linear mixed effect model with ecosystem process as a fixed effect and the random effect structure specified in equation 3 (Methods), MCMC means are very similar to the weighted means. Error bars represent 95% confidence intervals calculated using MCMC sampling. Processes are grouped according to the biogeochemical cycle to which they belong (carbon, nutrient, water) these are separated by solid lines. Within the carbon variables, processes are grouped according to trophic level (producer, herbivore, decomposer, carnivore, ecosystem) these are separated by vertical dashed lines. Processes in red are those measured belowground and those in black were measured aboveground. Processes in blue are measures of animal species richness (all of these are aboveground measures). Abbreviations are given for elements: carbon (C) nitrogen (N) and phosphorus (P).
Fig. 3: The mean Zr-values for species richness effects, shown for variables belonging to different
biogeochemical cycles. a) The full analysis with all 418 measures and b) the reduced analysis with only the 181 direct measures of the different biogeochemical cycles, i.e. excluding those measures, such as plant biomass, which can be associated with more than one of the cycles. Means and standard errors come from mixed models with the random effects structure shown in equation 2 and with biogeochemical cycle fitted as a fixed effect.
-0.5 0.0 0.5 Year S p e ci e s ri ch n e ss Z r 2002 2003 2004 2005 2006 2007 2008 a) 0 20 40 60 80 100 -0.5 0.0 0.5
Depth below surface (cm)
S p e ci e s ri ch n e ss Z r b) Fig. 1
-0.5 0.0 0.5 species richness effect (Zr value) Soil Water Soil P% Soil Nitrate% Storage Soil N% Root N% N2O emission 15 N Soil Microbial N Soil Ammmonium% Aboveground Plant N%Plant
15
N Storage Soil Organic C% Storage Soil Inorganic C% Methane oxidation
13
C Soil CO2 emission
Below Carnivore Abundance Above Carnivore Diversity Above Carnivore Abundance Microbial C% Below Decomposer Abundance Above Decomposer Diversity Above Decomposer Abundance Below Herbivore Abundance No. Pathogen Groups Pollinator Diversity Above Herbivore Diversity Pathogen Infection Above Herbivore Abundance Pollinator Abundance Herbivore Damage Root Production Root C% Target Seed ProductionPlant
13 C Aboveground Plant C% Dead Biomass Target Production -0.5 0.0 0.5
legume effect (Zr value)
-0.5 0.0 0.5
grass effect (Zr value)
Trophic Level Biogeochemical cycle Producers Herbivores Carnivores Decomposers Ecosystem Carbon Nutrients Water Fig 2
-0.2 -0.1 0.0 0.1 0.2 0.3 0.4 Biogechemical cycle S p e ci e s ri ch n e ss Z r va lu e
Carbon Nutrients Water
a) full analysis n=297 n=83 n=38 -0.2 -0.1 0.0 0.1 0.2 0.3 0.4 Biogechemical cycle S p e ci e s ri ch n e ss Z r va lu e
Carbon Nutrients Water
b) only direct measures
n=60
n=83