1 COSTS, EFFICIENCY AND ECONOMIES OF SCALE AND SCOPE IN THE ENGLISH HIGHER EDUCATION
SECTOR
Jill Johnes
Huddersfield University Business School University of Huddersfield Queensgate Huddersfield HD1 3DH Email: J.Johnes@hud.ac.uk Tel: +44 1484 472231 Geraint Johnes Department of Economics Lancaster University LA1 4YX Email: G.Johnes@lancs.ac.uk
Tel: +44 1524 594215
February 2016 ABSTRACT
Following recent changes to the funding mechanism for higher education, students in England face high ticket prices on tuition. The taxpayer continues to subsidise this education heavily, however, both through direct contributions and throughwriting off unpaid loans. Government therefore retains an interest in the efficiency with which higher education is delivered. We review the literature, and, using data for 2013-14, apply the appropriate frontier methods to model the structure of costs in this diverse sector. In doing so, we uncover information about the returns to scale and scope within the higher education sector, and identify differences in efficiency across institutions.
JEL Classification: I23
2 1. Introduction
Under the current funding mechanism for higher education in England, many students will not pay off the whole of the debt that they accrue while studying. The Resource Accounting and Budgeting (RAB) cost – the proportion of the value of student loans that, owing to the write-off of debt after 30 years, will not be repaid – is currently estimated to amount to around 45 per cent1. The tuition fee charged by providers is not necessarily the same, therefore, as the amount paid by customers. In addition, the fact that students do not make up-front payments might make the demand for higher education less price sensitive than would otherwise be the case. These factors have the potential to produce a market failure such that the usual competitive pressures fail to incentivise providers to become more efficient. Moreover, the government continues to subsidise both teaching (through covering the cost of student debt that remains unrecovered after 30 years and also through subsidy of some of the costliest subjects) and research, and therefore has an interest in the efficient operation of all aspects of higher education. An analysis of the cost structure and efficiency of higher education institutions (HEIs) is therefore of on-going interest and importance.
Extensive work has been undertaken on evaluating efficiency in the higher education sectors of various countries. Work in the United Kingdom (UK) is of particular relevance here (see, for example, Johnes 1990; Johnes and Taylor 1990; Johnes, J 1996; Johnes et al. 2005; Johnes 2008; Thanassoulis et al. 2011). Much of the literature on efficiency measurement has emphasised the statistical evaluation of costs (Cohn et al. 1989), since efficiency concerns how a given output can be produced at as low a cost as possible. Statistical and econometric techniques have been developed which allow efficiency to be evaluated for each institution. These statistical methods do not drill down into the detail of how institutions do what they do2; rather they offer the analyst both an understanding of how costs are determined in higher education institutions as a whole, and a measure of the extent to which different institutions manage to produce their outputs efficiently. They thereby allow an assessment to be made of the extent to which institutions differ in terms of their efficiency. The methods provide, at a higher level of abstraction, much the same input into benchmarking exercises as do more detailed qualitative exercises, but offer the advantage of a focus on the front-end activities of teaching and research. A number of studies exist which have adopted this general approach for UK higher education3 (Glass et al. 1995a; 1995b; Johnes, G 1996; Johnes 1997; 1998; Izadi et al. 2002; Johnes et al. 2005; Stevens 2005; Johnes et al. 2008b; Johnes and Johnes 2009; Thanassoulis et al. 2011).
The purpose of this paper is to undertake an empirical study of costs and efficiency in English higher education using data on the most recent available year, namely 2013-14. The paper is in 5 sections of which this is the first. A review of empirical studies of costs in UK higher education is presented in section 2. Section 3 discusses the methodological issues associated with estimating cost functions, and examines how estimates of efficiency can be derived from the cost function. The results of the empirical analysis are presented in section 4. Conclusions are drawn in section 5.
1http://www.publications.parliament.uk/pa/cm201314/cmhansrd/cm140320/text/140320w0002.htm. 2 Unlike, for example, the Transparent Approach to Costing (TRAC).
3 Note that there are also notable studies of cost structures of higher education systems of other countries such as Japan, Italy, Spain, Portugal, the USA and Germany, respectively (Hashimoto and Cohn 1997; Agasisti and Salerno 2007; Johnes and Salas Velasco 2007; Johnes et al. 2008a; Agasisti and Johnes 2010; Johnes and Schwarzenberger 2011).
3 2. Review of the literature on costs in higher education in the UK
As in many developed countries, higher education funding in the UK poses challenges for governments under pressure to reduce public budget deficits and for HEIs which face continuous competitive pressure to do more with less. A thorough understanding of universities’ costs and economies of scale and scope is crucial in determining how universities should be organised to make the best use of their resources.
There is now a considerable literature concerning the cost structure and efficiency of systems of higher education. While the earliest work on university cost functions for the UK (Verry and Layard 1975; Verry and Davies 1976) acknowledges that universities are multi-product firms (producing teaching and research), both the estimation method and specification of the cost function are restrictive since they allow for only limited economies of scale and preclude altogether the possibility of economies of scope. Indeed, the complexities of the operation of multiproduct organisations identified by Baumol et al. (1982) were first recognised in the higher education context in the seminal work of Cohn et al. (1989). Subsequent studies have exploited developments in frontier estimation methods (Aigner et al. 1977; Charnes et al. 1978; 1979) in order to combine the estimation of multi-product cost functions with estimation of efficiency (in the UK context see, for example, Johnes, G 1996; Johnes 1998; Izadi et al. 2002; Johnes et al. 2005; Stevens 2005; Thanassoulis et al. 2011).
The adoption of frontier estimation techniques to estimate cost functions and efficiency leads to analysts facing a choice of methods of analysis. While all empirical cost efficiency evaluations are theoretically rooted in the work of Farrell (1957), they have generally employed one of two main methodological approaches. The non-parametric approach of data envelopment analysis (DEA) (Charnes et al. 1978; 1979) allows, in the evaluation of a production or cost technology, input and output weightss to differ across institutions;the method consequently has an advantage when applied to a sector comprised of a highly diverse set of institutions as it allows universities to pursue their own specific missions without penalising their estimated efficiency. By way of contrast, the parametric approach of stochastic frontier analysis (SFA) (Aigner et al. 1977) is less flexible in its basic form, estimating a cost function with – in its simplest variant at least – identical parameters for all units in the sector, but it has the advantage of permitting statistical inference and calculation of economies of scale and scope.
Institutions within the English higher education sector are highly diverse in terms of, for example, age, size, subject mix, research intensity and external engagement. There is no reason to expect that cost structures and efficiency should be the same across all these HEIs, and parametric estimation methods have therefore needed to be adapted in order to accommodate this heterogeneity.
One way of addressing this is to focus attention on particular (pre-defined) groups of universities, and to estimate a separate cost function for each one. The English higher education sector can be categorised into three broad groups. Traditional universities, which had university status prior to 1992, offer degree programmes across the spectrum of academic subjects and have a well-developed research mission. Indeed these institutions often describe themselves as being ‘research led’. A large cohort of other institutions received university status in 1992; these institutions have a
4 balanced portfolio offering degree programmes across a range of academic and vocational subjects, and undertake research. Finally, since 2003 a third wave of institutions, previously colleges of higher education, have been awarded university status. This last group comprises a diverse set of institutions; some are small and specialist, and many lack a strong research mission.
Early cost studies focus solely on traditional (pre-1992) universities (Glass et al. 1995a; 1995b; Johnes, G 1996; Johnes 1998) where scale economies appear to be significant and unexhausted for the typical university; evidence on economies of scope is mixed and varies according to how the outputs are aggregated. In essence, the more highly aggregated the teaching outputs across subjects in the cost function specification, the less likely we are to observe economies of scope.
Later studies use data across both pre- and post-1992 HEIs to estimate cost functions (Johnes 1997; Izadi et al. 2002), and more recent work has included English universities from across all three groupings (Johnes et al. 2005; Johnes et al. 2008b; Thanassoulis et al. 2011). These studies have taken advantage of the increasing availability of appropriate data which permit the use of panel estimation methods as a means of dealing with unobserved heterogeneity. But changes over time in the funding regime of the English higher education sector mean that obtaining a panel which is comparable over time is difficult, and this has led to modelling problems in the panel context, especially for longitudinal data over a relatively long time period (Johnes and Johnes 2013). These studies find that scale economies are close to constant or decreasing for the typical university (Johnes 1997; Izadi et al. 2002; Johnes et al. 2005; Johnes et al. 2008b; Johnes and Johnes 2009) while global diseconomies of scope are a consistent finding (Johnes 1997; Izadi et al. 2002; Johnes et al. 2005; Johnes et al. 2008b; Johnes and Johnes 2009).
There is also clear evidence that efficiency estimates vary by mission group: former colleges of higher education appear to be least efficient, followed by post-1992 and then pre-1992 HEIs (Johnes et al. 2005; Johnes et al. 2008b; Johnes and Johnes 2009; Thanassoulis et al. 2011). There is, across the full range of institutions, a considerable range in efficiency scores; for example, Thanassoulis et al. (2011) find, using SFA, that while mean efficiency is 0.75, it varies from 0.06 to 0.99. This vast range is likely a consequence of the diversity of the HEIs in the sample. Institutions at the lower end of the distribution of efficiencies tend to have characteristics (such as quality, size or specialisation), inadequately captured in the ‘one size fits all’ specification of the cost function, that ‘explain’ their relatively high costs. The efficiency scores attached to these institutions therefore need to be treated with considerable caution.
One way of addressing the issue of diversity adopted in a number of studies is to add a set of exogenous control variables which might affect costs into the estimated cost function. Such factors include ‘quality’ of students, input prices (as reflected by geographical location dummies), real estate costs, success in strategies to widen student participation in higher education, and measures of third mission (knowledge transfer) activity. While one study finds that the proportion of students achieving first and upper second class degrees has a positive influence on both costs and on efficiency (Stevens 2005), student quality has generally not been found to be a significant determinant of costs (Verry and Davies 1976; Johnes et al. 2005; Johnes et al. 2008b; Johnes and Johnes 2009). Accounting for third mission activity has proved to be very difficult in practice because of the paucity of data. Variables used to reflect third mission include income from other services rendered (Johnes et al. 2005), income from intellectual property (including contract research,
5 consultancy and income from engagement with business and the community), and staff time directed at and attendees at public events (Johnes and Johnes 2013). Data around public events seem particularly unreliable; income from intellectual property has the expected positive relationship with costs (Johnes and Johnes 2013). More generally, identifying control variables that might influence costs, over and above the standard outputs of teaching and research, has not proved particularly successful in studies to date.
A small number of recent cost studies has therefore experimented with random parameter stochastic frontier models (Tsionas 2002; Greene 2005). These models do not require data on time-invariant influences on costs, but – as an advance on fixed effects models – allow all parameters of the cost equation to vary across institutions. Much like DEA, the random parameter stochastic frontier estimation method thus effectively estimates a separate technology for each unit of observation. Applications of this method are limited with only one applied to higher education in England (Johnes and Johnes 2009) and the others to universities in Italy, Germany and the USA (Agasisti and Johnes 2010; Johnes and Schwarzenberger 2011; Agasisti and Johnes 2015). A common theme of these studies is that, for the typical university, economies of scale are generally exhausted (although this is not the case for typical universities in Germany) and opportunities for savings arising from global economies of scope are limited. The disadvantage of this approach is that the model is very demanding of the data and can, in consequence, be difficult to estimate. In addition, by allowing each HEI to have its own mission and be judged in isolation, the random parameters approach might be considered to be too tolerant of high-cost practices.
An alternative to random parameter frontier estimation involves estimating separate frontiers for two or more groups of institutions. This is less permissive than the random parameters method in that it allows variation in the parameters between institutions in different classes, but no variation within each class. The latent class approach is particularly attractive because it allows the membership of each class to be determined by the data without need for the analyst to prescribe which institutions belong in which class. Unlike the random parameter approach, the latent class model can be estimated using a cross-section of data; in a policy environment that is rapidly changing, this is an important advantage. To date this method has not received much attention in the higher education literature (exceptions include Johnes and Johnes 2013; Agasisti and Johnes 2015). This is a gap which we intend to fill with this study.
3. Methodological approach
The review of the literature indicates that the functional form of the cost function, the modelling of economies of scale and scope, and the choice of estimation technique are all important issues to address in undertaking an analysis of university costs and efficiency.
3.1 Functional form
A cost function relates costs to the set of outputs produced, given prices of inputs. For institution 𝑘𝑘 this is written in the general form
𝐶𝐶𝑘𝑘 = 𝑓𝑓(𝑦𝑦𝑖𝑖𝑘𝑘, 𝑤𝑤𝑙𝑙𝑘𝑘) (1)
Where 𝐶𝐶𝑘𝑘 represents costs for university 𝑘𝑘, 𝑦𝑦𝑖𝑖𝑘𝑘 is quantity of output 𝑖𝑖 for university 𝑘𝑘 and 𝑤𝑤𝑙𝑙𝑘𝑘 is the price of input 𝑙𝑙 for university 𝑘𝑘. We estimate a quadratic cost function; this satisfies the desiderata
6 identified by Baumol et al. (1982) – including the requirement that the equation should produce sensible estimates of costs when there is zero production of one or more of the outputs. The specification is therefore:
𝐶𝐶𝑘𝑘 = 𝛼𝛼0+ ∑ 𝛽𝛽𝑖𝑖 𝑖𝑖𝑦𝑦𝑖𝑖𝑘𝑘+12∑ ∑ 𝛾𝛾𝑖𝑖 𝑖𝑖 𝑖𝑖𝑖𝑖𝑦𝑦𝑖𝑖𝑘𝑘𝑦𝑦𝑖𝑖𝑘𝑘+ ∑ 𝛿𝛿𝑙𝑙 𝑙𝑙𝑤𝑤𝑙𝑙𝑘𝑘+ 𝜀𝜀𝑘𝑘 (2) where 𝜀𝜀𝑘𝑘 is an institution-specific residual, and 𝛼𝛼0, 𝛾𝛾𝑖𝑖𝑖𝑖 and 𝛿𝛿𝑙𝑙 are parameters to be estimated. 3.2 Economics of scale and scope
Measures of the returns to scale and scope suggested by the estimated cost function are evaluated following Baumol et al. (1982). These measures are defined in Table 1. In the case of the returns to scale, the measures all draw on the idea, familiar from the literature on single-product firms, that average costs are higher than marginal costs over the range of output where the former are decreasing. Where the measure of ray or product-specific returns to scale exceeds unity, there are increasing returns to scale; where the measure is below unity, returns to scale are decreasing. The evaluation of global economies of scope involves examining the cost of producing all the outputs of the typical university together and comparing that to the sum of the costs of producing each output (at the same level) in separate production units. Product-specific economies of scope refer to the cost savings (or otherwise) of producing one specific output along with all the others. Economies of scope (global or product-specific) are observed when the corresponding measure is positive.
<Table 1 here> 3.3 Estimation method
A review of the literature identifies problems of estimating higher education cost functions for a diverse higher education sector such as that observed in England. Panel data estimation with a random parameters specification might offer a way forward, but recent changes in the student funding mechanism – notably the increase in undergraduate tuition fees to £9000 – limit the extent to which data from different years are comparable. In this paper, we therefore apply a latent class stochastic frontier estimation approach to cross-section data. Specifically the latent class stochastic frontier model for each class 𝑚𝑚 is
𝐶𝐶𝑘𝑘,𝑚𝑚 = 𝛼𝛼0,𝑚𝑚+ ∑ 𝛽𝛽𝑖𝑖 𝑖𝑖,𝑚𝑚𝑦𝑦𝑖𝑖𝑘𝑘+12∑ ∑ 𝛾𝛾𝑖𝑖 𝑖𝑖 𝑖𝑖𝑖𝑖,𝑚𝑚𝑦𝑦𝑖𝑖𝑘𝑘𝑦𝑦𝑖𝑖𝑘𝑘+ ∑ 𝛿𝛿𝑙𝑙 𝑙𝑙,𝑚𝑚𝑤𝑤𝑙𝑙𝑘𝑘+ 𝑣𝑣𝑘𝑘,𝑚𝑚+ 𝑢𝑢𝑘𝑘,𝑚𝑚 (3) is estimated, with the analyst prescribing how many latent classes exist, but with the membership of each latent class being determined alongside the parameter values and the residual terms by maximum likelihood.
To summarise, it is possible to combine the stochastic frontier and latent class approaches so that (i) cost frontiers (or envelopes) are estimated (ii) yielding measures of the efficiency of each organisation in the data set and (iii) establishing which organisations belong in each of the latent classes or groups. It is useful to illustrate this method graphically. Consider Figure 1. This shows a scatter plot of points, each of which describes the costs and output levels of a single observation. Each observation might represent a decision-making unit or organisation – in our case a higher education institution. A straightforward latent class analysis of these data might involve the analyst in specifying that there are two different types of institution in the data set. The latent class model
7 therefore fits two lines to the data. These are shown by the two dashed lines. In fitting these two lines, the model also determines which observations belong to which of the two latent classes – thus the model classifies some of the cost-output pairings into class X and some into class Y. These letters are shown as the data points on the diagram, but it should be emphasised that the observations are placed in these classes by the maximum likelihood algorithm used in the latent class estimation itself; the observations are not placed within one class or the other by the analyst.
<Figure 1 here>
Now the two dashed lines represent the best fit that is associated with the observations (given that there are two latent classes), but they do not represent the cost envelope faced by organisations within each of these two classes. To find these cost envelopes, the latent class method must be used alongside a stochastic frontier model. Doing this moves the lines down (though this is not necessarily a parallel shift). The resultant cost envelopes are represented by the solid lines. Note that, within each latent class, some observations lie below the cost frontier (because of the stochastic error component), but most lie above. The preponderance of observations above the frontiers represents inefficiency. The technique allows the efficiency of each observation to be evaluated by reference to its position relative to the frontier for the latent class to which the observation belongs.4
4. Empirical analysis
Data on costs and outputs in higher education are published by the Higher Education Statistics Agency (HESA) in a series of annual publications, including Students in Higher Education and Finances of Higher Education Providers. In the analysis that follows, we draw on these data to estimate a frontier model of costs as a function of several outputs and input prices, recognising the multi-product nature of higher education.
The costs variable includes current expenditures excluding ‘hotel’ costs associated with residences and catering. Student numbers – classified, in the case of undergraduates, into the sciences and other subjects – are expressed as full-time equivalents. We eschew the option to employ a finer disaggregation of the student body owing to problems of multicollinearity. Following the precedent set by earlier studies, we use research income as the measure of research activity. This measure has the virtue of providing a market value for research, hence appropriately weighting quantity and quality. While it is a prospective measure, and may be criticised for being an input rather than an output, it is typically highly correlated with measures (such as publications or citations) that are more unambiguously considered to be research outputs, but which are more retrospective in nature (Johnes and Johnes 2013).
Previous analyses of university costs have, with few exceptions, failed to control for variations in costs due to the impact of labour market conditions differentially affecting institutions. An important exception – albeit one that predates the use of frontier methods – is that of Cohn et al. (1989) where wage is found to be a significant variable in the cost function. In this paper, we use as a control a measure of hedonic costs in the labour market derived as the residual from a regression of institutions’ salary costs against a vector of variables describing the numbers of staff in each of ten age groups. Definitions of all variables can be found in Table 2.
8 <Table 2 here>
The sample used for estimation comprises 103 higher education institutions in England.5 A latent class stochastic frontier model (with 2 classes) is applied to these data, employing a quadratic specification to capture returns to scale and scope, the latter being due to synergies across the various teaching activities and research. Results are shown in Table 3.6
<Table 3 here>
These results are not amenable to straightforward interpretation, and we defer to later a consideration of what they imply about cost structures in the higher education sector.7 First, we examine the composition of the two latent classes. Recall that the classification of institution into one class or the other is determined (alongside the coefficient estimates and the one-sided residual that captures inefficiency) by the criterion that this should optimise the fit of the model to the data. In essence, the latent classes each contain institutions that are, in some sense not directly observed in the variables, similar to one another but are distinct from those in the other class. Using the latent class approach thus accommodates a degree (albeit limited) of unobserved heterogeneity across institutions, and a look at the composition of each class should teach us something about which institutions are alike and which are not.
Table 4 reports descriptive statistics for the key variables for the institutions belonging to each class, and detail of class membership appear in Table 5. On most measures, the means of the variables are quite similar across classes, though the extent of research activity is on average somewhat higher in the second latent class than in the first. More detailed investigation shows some more pronounced differences between the two classes, however. Latent class 2 contains the largest universities, and also includes many of the smaller institutions that have gained university status since the turn of the millennium (see Table 5 for details). The standard deviation attached to all variables is correspondingly greater for this latent class than for the first.8
<Tables 4 and 5 here>
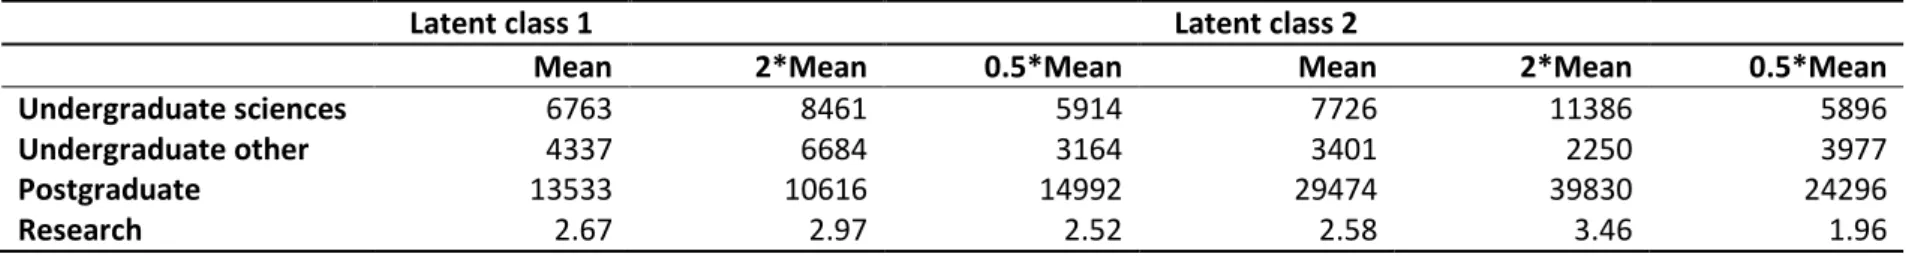
In Table 6, we report the levels of average incremental costs for each output. The calculations are provided for the institution producing, respectively, an average output vector, twice and half the average output vector, in each of the latent classes. It is worth noting that an average institution (or
5 We exclude from the sample a number of institutions that are, for one reason or another, idiosyncratic. These are: the ancient universities of Oxford and Cambridge, whose costs are affected by their internal structures and teaching methods; small and specialist institutions with costs below £25m per year; the University of Arts, London, for which, owing to an unusual employment structure, we were unable to obtain hedonic salary cost; Buckingham, which is fully private; Open University, which specialises in distance learning; and the London University (Institutes and Activities), which comprises a number of highly specialised research centres. Data for University Campus, Suffolk are divided equally between the Universities of Essex and East Anglia; figures for Liverpool Tropical Medicine are added to Liverpool University.
6 The Akaike Information Criterion rejects the 1-class model (a conventional model applied across the whole sample) in favour of the 2-class latent class model at a conventional significance level.
7 Relatively few coefficients differ significantly from zero. This is usual in this type of analysis, given the highly nonlinear nature of the functional form.
8 The mixed character of the institutions in the second latent class begs the question of whether the number of classes ought to be extended. We have tried to do this, but statistical considerations (specifically a singular variance matrix) prevent estimation.
9 one that is double or half the size of the typical institution) is a hypothetical construct; in reality, HEIs may specialise to a greater or lesser extent in a particular output.
In class 1, the costs associated with undergraduate education for the typical university in that class average between £6000 and £7000 for both the sciences and other subject areas. This is low in comparison with tuition fees, which in most cases amount to the maximum permitted £9000 for domestic students. Postgraduate tuition involves institutions in greater expenditure per student. This is unsurprising in view of the facts that classes for taught programmes are often relatively small, and that research requires one-on-one supervision. The average incremental cost of research is high, at around 2.5 – indicating that each pound of research income is associated with more than twice as much expenditure. This confirms the conventional wisdom that income from teaching is used to cross-subsidise research. The main distinction between classes 1 and 2 is that postgraduate costs are considerably higher in class 2 than class 1. The general pattern of average costs across output types in both classes is similar for the scenarios in which output is greater than or less than the average.
<Table 6 here>
In Table 7, we report estimates of product-specific and ray returns to scale for institutions within each latent class for the HEI of average, twice and half the average output vector. Ray economies of scale are unambiguously exhausted across both classes at large sizes; but there are potential economies for the smallest HEIs (in both classes) and also for typical universities in class 1. Note that the typical HEI in class 2, for which ray economies of scale are already exhausted, is larger in some dimensions than its counterpart in class 1.
<Table 7 here>
Typically product-specific economies of scale are exhausted, but there are two exceptions – unexhausted economies are observed for postgraduate education and for research in institutions in the second latent class. This finding is consistent with earlier studies (Johnes et al. 2008b; Johnes and Johnes 2009), and suggests that there is some scope for increased concentration of postgraduate and research activity amongst these institutions.
Estimates of economics of scope are reported in Table 8. We find that global economies of scope are exhausted (to varying degrees) in both classes. Undergraduate teaching in subjects other than science, however, exhibits economies of scope across both classes and all sizes of HEI. The opposite is observed for undergraduate teaching in science subjects and research.
<Table 8 here>
The one-sided regression residuals that emerge from the stochastic frontier model can be compared across institutions by calculating the ratio of predicted costs to the sum of predicted costs and the residual. This gives a measure, bounded from above by unity, of the extent to which each institution is efficient. As may be observed in Figure 2, the degree of efficiency in our sample is very high: all institutions are better than 90% efficient, and most are very close to full efficiency9. The institution
9 Note that the efficiency component for each of the latent class models is not significantly different from zero, adding further evidence that efficiency is high.
10 achieving the lowest efficiency score, at 90.6%, is the University of Arts, Bournemouth – a small and specialist institution whose costs are only marginally above the lower limit of £25m used as a cutoff for the purposes of this study.
<Figure 2 here> 5. Conclusions
The statistical approach to evaluating efficiency offers an evidence base on which to begin a more refined consideration. Most studies of efficiency in the higher education have demonstrated that the sector appears to be reasonably efficient – though it should be borne in mind that efficiency is defined by reference to best observed practice. The results do not, therefore, support the notion that substantial sector-wide gains could be made by using efficiency scores as a criterion for resource allocation.
That said, efficiency is a slippery concept. A user of the results of a statistical analysis may deem some characteristics of institutions, but not others, to be legitimate explanations of cost variations. This issue is further complicated by the fact that some of the characteristics that influence costs can be measured whereas others cannot – though, by using latent class modelling, both observable and (some) unobservable characteristics can be allowed for in the calculation of an efficiency score. In sum, statistical analysis can take us some of the way towards understanding efficiency, but a full understanding requires more qualitative research.
11 Figure 1: Illustration of the latent class approach
X X X X X X X X X X X X X X Y Y Y Y Y Y Y Y Y Y costs output Key:
Line of best fit Stochastic frontier
12 Figure 2: Distribution of efficiency scores
F re q u en cy EFF 0 18 36 54 72 . 900 . 925 . 950 . 975 1. 000
13
Table 1: Evaluating economies of scale and scope
Ray/global Product-specific Economies of scale 𝑆𝑆𝑅𝑅=∑ 𝑦𝑦𝐶𝐶(𝑦𝑦) 𝑖𝑖𝐶𝐶𝑖𝑖(𝑦𝑦) 𝑖𝑖 𝑆𝑆𝑖𝑖(𝑦𝑦) = 𝐴𝐴𝐴𝐴𝐶𝐶(𝑦𝑦𝑖𝑖)/𝐶𝐶𝑖𝑖(𝑦𝑦)
Implication If 𝑆𝑆𝑅𝑅> 1 (𝑆𝑆𝑅𝑅< 1) then we have ray
economies (diseconomies) of scale. If product-specific economies (diseconomies) 𝑆𝑆𝑖𝑖(𝑦𝑦) > 0 (𝑆𝑆𝑖𝑖(𝑦𝑦) < 0) then there are of scale for output 𝑖𝑖.
Economies of scope 𝑆𝑆𝐺𝐺= �� 𝐶𝐶(𝑦𝑦𝑖𝑖) 𝑖𝑖 − 𝐶𝐶(𝑦𝑦)� /𝐶𝐶(𝑦𝑦) 𝑆𝑆𝐶𝐶𝑖𝑖 = �� 𝐶𝐶(𝑦𝑦𝑖𝑖) 𝑖𝑖 + 𝐶𝐶(𝑦𝑦𝑛𝑛−𝑖𝑖) − 𝐶𝐶(𝑦𝑦)� 𝐶𝐶(𝑦𝑦)�
Implication If 𝑆𝑆𝐺𝐺> 0 (𝑆𝑆𝐺𝐺 < 0) then we observe global economies (diseconomies) of scope from producing all the outputs together rather than each one in a separate firm.
If 𝑆𝑆𝐶𝐶𝑖𝑖 > 0 (𝑆𝑆𝐶𝐶𝑖𝑖< 0) then there are product-specific economies (diseconomies) of scope for output 𝑖𝑖 suggesting that there are cost savings (dissavings) from producing this output with all the others.
Where 𝐶𝐶(𝑦𝑦) is the total cost of producing the output vector 𝑦𝑦; 𝐶𝐶𝑖𝑖(𝑦𝑦) is the marginal cost of producing the 𝑖𝑖th output; the average incremental cost of output 𝑖𝑖 is 𝐴𝐴𝐴𝐴𝐶𝐶(𝑦𝑦𝑖𝑖) = [𝐶𝐶(𝑦𝑦𝑛𝑛) − 𝐶𝐶(𝑦𝑦𝑛𝑛−𝑖𝑖)]/𝑦𝑦𝑖𝑖; 𝐶𝐶(𝑦𝑦𝑛𝑛) is the total cost of producing all the outputs at the levels in vector 𝑦𝑦; 𝐶𝐶(𝑦𝑦𝑛𝑛−𝑖𝑖) is the total cost of producing all outputs at the levels in vector 𝑦𝑦 except for output 𝑖𝑖 which is set to zero; 𝐶𝐶(𝑦𝑦𝑖𝑖) is the cost of producing output 𝑖𝑖 in a separate firm at the same level as in the output vector 𝑦𝑦.
14 Table 2: Data Definitions
Variable name Definition Units
Dependent variable
COST Total expenditure minus expenditure on residences and catering operations
£000s
Undergraduate teaching UGS
UGA
Undergraduate students (first degree and other) in sciences (medicine and dentistry, subjects allied to medicine, biological sciences, veterinary science, agriculture and related subjects, physical sciences, mathematical sciences, computer science, engineering and technology, and
architecture, building and planning)
Undergraduate students (first degree and other) in all other subjects (social studies, law, business and administrative studies, mass communications and documentation, languages, historical and philosophical studies, creative arts and design, and education)
FTEs FTEs
Postgraduate teaching
PG Postgraduate students in all subjects FTEs
Research
RES HEFCE R plus income from research grants and contracts £000s
Input prices
WAGE The residual from a hedonic wage function i.e. a regression of institutions’ salary costs against a vector of variables describing the numbers of staff in each of ten age groups
15 Table 3: Latent class stochastic frontier quadratic cost functions
Latent class 1 Latent class 2
Constant 36.179 5.526
(573x105) (5.36)
Undergraduates: non-science (UGA) 1.990 4.553
(4.93) (2.45)
Undergraduates: science (UGS) 5.065 4.067
(6.05) (2.59) Postgraduates (PG) 16.450 19.118 (18.03) (7.38) Research (RES) 2.365 1.664 (1.09) (0.21) UGA2 0.217 0.023 (0.76) (0.31) UGS2 0.003 0.498 (1.14) (0.49) PG2 2.592 -3.653 (4.32) (3.55) RES2 0.004 -0.008 (0.01) (0.00) UGA*UGS 0.014 -0.220 (1.51) (0.57) UGA*PG -1.199 0.622 (4.28) (1.93) UGA*RES 0.176 -0.061 (0.22) (0.07) UGS*PG 0.843 0.893 (3.29) (1.52) UGS*RES -0.025 0.005 (0.17) (0.08) PG*RES -0.284 0.398 (0.43) (0.22)
Hedonic wage costs 0.797 0.222
(0.48) (0.31)
Log likelihood -407.88
16 Table 4: Descriptive statistics of variables, by latent class
Latent class 1 Latent class 2
mean SD mean SD Cost 193.443 123.661 184.298 205.650 Undergraduates, science (thou) 4.938 2.648 5.078 3.997 Undergraduates, other (thou) 6.029 2.955 5.819 3.530 Postgraduates (thou) 2.579 1.410 2.536 2.465 Research (mill) 23.045 43.774 28.784 58.878 Number in class 54 49
17
Table 5: Latent class membership, ranked within each class from highest to lowest total cost Latent Class 1
>£200K £100K-£200K <£100K
Imperial College Lancaster Northampton
Liverpool City Southampton Solent
Southampton Surrey St George’s Hospital
Bristol Nottingham Trent SOAS
Warwick Sussex West London
Queen Mary College Kent Royal Veterinary College
Exeter Bath University for the Creative Arts
York Portsmouth Falmouth
Durham Anglia Ruskin
Leicester Salford
Reading Middlesex
Sheffield Hallam Brunel
London School of Economics Hull
East Anglia Brighton
Northumbria Westminster Hertfordshire De Montfort Wolverhampton Cranfield East London Oxford Brookes Bradford South Bank Sunderland Derby
Royal Holloway and Bedford Huddersfield London Metropolitan
Keele
London Business School Lincoln
Latent Class 2
>£200K £100K-£200K <£100K
University College London Central Lancashire Birkbeck
Manchester Kingston Edge Hill
King’s College Greenwich Institute of Cancer Research
Nottingham Liverpool John Moores Chester
Leeds Leeds Beckett Goldsmiths
Sheffield Birmingham City Roehampton
Birmingham Essex Institute of Education
Newcastle-upon-Tyne London Sch Hygiene & Trop Med Worcester
Plymouth Bournemouth Gloucestershire
Manchester Metropolitan Bedfordshire Cumbria
Coventry Staffordshire Buckinghamshire New
Loughborough Teesside Bath Spa
West of England Aston Winchester
Canterbury Christ Church Liverpool Hope York St John
Chichester Bolton Royal College of Art University College Birmingham
St Mary’s Twickenham Harper Adams Arts University Bournemouth
18 Table 6: Estimates of Average Incremental Costs (AICs) at various levels of output by latent classes
Latent class 1 Latent class 2
Mean 2*Mean 0.5*Mean Mean 2*Mean 0.5*Mean
Undergraduate sciences 6763 8461 5914 7726 11386 5896
Undergraduate other 4337 6684 3164 3401 2250 3977
Postgraduate 13533 10616 14992 29474 39830 24296
Research 2.67 2.97 2.52 2.58 3.46 1.96
Table 7: Estimates of returns to scale at various levels of output by latent classes
Latent class 1 Latent class 2
Mean 2*Mean 0.5*Mean Mean 2*Mean 0.5*Mean
Undergraduate sciences 1.00 1.00 1.00 0.75 0.69 0.82
Undergraduate other 0.77 0.72 0.83 0.96 0.89 0.98
Postgraduate 0.67 0.44 0.82 1.46 1.87 1.24
Research 0.97 0.94 0.98 1.37 1.66 1.11
19 Table 8: Estimates of economies of scope at various levels of output by latent classes
Latent class 1 Latent class 2
Mean 2*Mean 0.5*Mean Mean 2*Mean 0.5*Mean
Undergraduate sciences -0.04 -0.08 -0.02 -0.03 -0.06 -0.02
Undergraduate other 0.15 0.03 0.32 0.08 0.10 0.09
Postgraduate 0.13 0.24 0.06 -0.30 -0.55 -0.15
Research -0.03 -0.05 -0.01 -0.20 -0.36 -0.07
20 References
Agasisti, T. and G. Johnes (2010). 'Heterogeneity and the evaluation of efficiency: The case of Italian universities.' Applied Economics 42(11): 1365-1376.
Agasisti, T. and G. Johnes (2015). 'Efficiency, costs, rankings and heterogeneity: The case of US higher education.' Studies in Higher Education 40(1): 60-82.
Agasisti, T. and C. Salerno (2007). 'Assessing the cost efficiency of Italian universities.' Education Economics 15(4): 455-471.
Aigner, D., C. A. K. Lovell and P. Schmidt (1977). 'Formulation and estimation of stochastic frontier production models.' Journal of Econometrics 6: 21-37.
Baumol, W. J., J. C. Panzar and R. D. Willig (1982). Contestable Markets and the Theory of Industry Structure. London, Harcourt Brace Jovanovich.
Charnes, A., W. W. Cooper and E. Rhodes (1978). 'Measuring the efficiency of decision making units.' European Journal of Operational Research 2(4): 429-444.
Charnes, A., W. W. Cooper and E. Rhodes (1979). 'Measuring the efficiency of decision making units: a short communication.' European Journal of Operational Research 3(4): 339.
Cohn, E., S. L. W. Rhine and M. C. Santos (1989). 'Institutions of higher education as multi-product firms: economies of scale and scope.' Review of Economics and Statistics 71(2): 284-290. Glass, J. C., D. G. McKillop and N. S. Hyndman (1995a). 'The achievement of scale efficiency in UK
universities: a multiple-input multiple-output analysis ' Education Economics 3(3): 249-263. Glass, J. C., D. G. McKillop and N. S. Hyndman (1995b). 'Efficiency in the provision of university
teaching and research: an empirical analysis of UK universities.' Journal of Applied Econometrics 10(1): 61-72.
Greene, W. (2005). 'Reconsidering heterogeneity in panel data estimators of the stochastic frontier model.' Journal of Econometrics 126: 269-303.
Hashimoto, K. and E. Cohn (1997). 'Economies of scale and scope in Japanese private universities.' Education Economics 5(2): 107-115.
Izadi, H., G. Johnes, R. Oskrochi and R. Crouchley (2002). 'Stochastic frontier estimation of a CES cost function: the case of higher education in Britain.' Economics of Education Review 21(1): 63-71.
Johnes, G. (1996). 'Multi-product cost functions and the funding of tuition in UK universities.' Applied Economics Letters 3: 557-561.
Johnes, G. (1997). 'Costs and industrial structure in contemporary British higher education.' Economic Journal 107: 727-737.
Johnes, G. (1998). 'The costs of multi-product organisations and the heuristic evaluation of industrial structure.' Socio-Economic Planning Sciences 32(3): 199-209.
Johnes, G., A. S. Camanho and M. C. A. S. Portela (2008a). 'Assessing Efficiency Of Portuguese Universities Through Parametric And Non-Parametric Methods.' Portuguese Journal of Management Studies 13(1): 39-66.
Johnes, G. and J. Johnes (2009). 'Higher education institutions’ costs and efficiency: taking the decomposition a further step.' Economics of Education Review 28(1): 107-113.
Johnes, G., J. Johnes and E. Thanassoulis (2008b). 'An analysis of costs in institutions of higher education in England.' Studies in Higher Education 33(5): 527-549.
Johnes, G., J. Johnes, E. Thanassoulis, P. Lenton and A. Emrouznejad (2005). An Exploratory Analysis of the Cost Structure of Higher Education in England. London, Department for Education and Skills.
Johnes, G. and M. Salas Velasco (2007). 'The determinants of costs and efficiencies where producers are heterogeneous: the case of Spanish universities.' Economics Bulletin 4(15): 1-9.
Johnes, G. and A. Schwarzenberger (2011). 'Differences in cost structure and the evaluation of efficiency: The case of German universities.' Education Economics 19(5): 487-499.
21 Johnes, J. (1990). 'Unit costs: some explanations of the differences between UK universities.' Applied
Economics 22(7): 853-862.
Johnes, J. (1996). 'Performance assessment in higher education in Britain.' European Journal of Operational Research 89: 18-33.
Johnes, J. (2008). 'Efficiency and productivity change in the English higher education sector from 1996/97 to 2004/05.' The Manchester School 76(6): 653-674.
Johnes, J. and G. Johnes (2013). Effiicency in the Higher Education Sector: A Technical Exploration. London, Department for Business Innovation and Skills.
Johnes, J. and J. Taylor (1990). Performance Indicators in Higher Education. Buckingham, Society for Rresearch into Higher Education and Open University Press.
Jondrow, J., C. A. K. Lovell, I. S. Materov and P. Schmidt (1982). 'On the estimation of technical inefficiency in the stochastic frontier production function model.' Journal of Econometrics 19(2-3): 233-238.
Stevens, P. A. (2005). 'A stochastic frontier analysis of English and Welsh universities.' Education Economics 13(4): 355-374.
Thanassoulis, E., M. Kortelainen, G. Johnes and J. Johnes (2011). 'Costs and efficiency of higher education institutions in England: A DEA analysis.' Journal of the Operational Research Society 62(7): 1282-1297.
Tsionas, E. G. (2002). 'Stochastic frontier models with random coefficients.' Journal of Applied Econometrics 17: 127-147.
Verry, D. W. and B. Davies (1976). University Costs and Outputs. Amsterdam, Elsevier. Verry, D. W. and P. R. G. Layard (1975). 'Cost functions for university teaching and research.'