Katja rost/margit osterloh*
M
anageMent
F
ashion
P
ay
-
For
-P
erForMance
For
ceo
s
**abstract
We show theoretically and empirically that Pay-for-Performance, like many manage-ment fashions, has not achieved its intended aim. our research focuses on previous empirical studies that examine the relation between variable executive pay and firm performance on various different dates. our results indicate that a variable ceo income contributes very little to the increase of the firm’s performance, and that ceo salary and firm performance are not linked. the example of Pay-for-Performance shows that in the long run, many management fashions do not solve the problems that they promise to solve.
JeL classifications: g35, o31, J41.
Keywords: ceo compensation; corporate governance; crowding out; management fashion; Pay-for-Performance.
1 the riseoFthe ManageMent “Fashion” Pay-For-PerForMance
Management fashions promise solutions for problems that are considered urgent. “A management fashion (…) is a relatively transitory collective belief, disseminated by management fashion setters, that a management technique leads rational management progress.” (Abrahamson (1996)). Examples of management fashions of the last few years are Business Process Reengineering, ISO 9000 ff., Lean Management, Downsizing, Share-holder Value, Empowerment, Core Competences, Corporate Culture and Open Inno-vation (Kieser (2000; 2002); Teichert and Talaulicar (2002)). Management fashions sell management concepts (Kieser (1996; 1997). These concepts are supposed to structure and
* Katja Rost, Research Assistant, University of Zurich, IOU Institute for Organization and Administrative Science, Plattenstrasse 14, CH-8032 Zürich, e-mail: [email protected]; Margit Osterloh, Professor, Uni-versity of Zurich, IOU Institute for Organization and Administrative Science, and Research director, CREMA (Center for Research in Economics, Management and the Arts), Plattenstrasse 14, CH-8032 Zürich, e-mail: [email protected].
** We would like to thank two anonym reviewers and Stephan Kaiser and Thomas Ehrmann for their valuable and helpful comments. Further, we are deeply indebted to Conrad Meyer from the University of Zurich.
settle problems that are considered urgent and worth solving at a certain time. History shows that management fashions occur in ever faster succession (see Figure 1).
Figure 1: Development of management fashions (Ghemawat (2000, 25))
Influence Index
Decision Trees Managerial Grid
Theory X and Theory Y
“Theory Z“
“Theory Z“ Strategic Business Units
Zero Base Budgeting Value Chain Decentralization Wellness “Excellence“ Quality Circles/TQM Just in Time/Kanban Intrapreneuring Corporate Culture One Minute Managing
Benchmarking Cycle Time/Speed
Visioning Workout Business Process Reengenieering
Self Managing Teams Care Competencies Horizontal Organisations
Continuous Improvement/Learning Organization
Restrusturing/Delayering Portfolio ManagementMBWA
Matrix Empowerment Brainstorming T-Group TRaining Conglomeration Experience Curve Management by Objectives Satisfiers/Dissatisfiers 1950 1960 1970 1980 1990 1995
Many management fashions develop and survive despite doubts about their effective-ness, or if they are later shown to be dysfunctional (Sterman and Wittenberg (1999)). At times, management fashions even penetrate domains for which they have not been designed. A particularly dramatic example of this development is Pay-for-Perfor-mance.
The goal of Pay-for-Performance is to compensate staff according to their individual and specific performance, thus motivating them to further efforts. The concept follows the idea of piece rate. The Safelite Glass Company is a prominent example. After the change from fixed pay rates per hour to piece rates, which were measured according to assembled glass units per worker and day, productivity rose by an astonishing 36%, the incentive effect by 20% and the self-selection effect by 16%, while salary cost only rose by 9% (Lazear (1999); Backes-Gellner et al. (2001); Wolff and Lazear (2001); Besanko et al. (2004)). The company transferred this piece-rate concept to managers without
questioning whether their work was comparable to work done at the assembly line. CEOs’ Pay-for-Performance is intended to link the interests of the owners with the inter-ests of the CEOs (Jensen and Meckling (1976)). The aim is to motivate the CEO to act like the owner of the firm even in situations which he cannot monitor, e.g., during nego-tiations1. Pay-for-Performance embodies nearly all the components of a management
fashion (Kieser (1996; 1997); Benders and van Veen (2001)):
It is perceived as new, progressive, innovative, rational, and functional (Carson et al. (2000)).
It promises to solve an acute problem, i.e., the incompetence of the board of directors (Galbraith (1967); Mace (1971); Allen (1974); Herman (1981)). At the beginning of the 1960s, shareholders questioned the effectiveness of monitoring by the board and claimed that the board's influence on the decisions by management was limited. A key factor of the Pay-for-Performance program is heavily promoted and a simple transposition is suggested. In this case, the linking of the different interests of share-holders and management by means of monetary compensation dependent on perfor-mance (Jensen and Murphy (1990b)).
Fashion-setters such as gurus, mass media, or business schools interact as suppliers with the demanding enterprises (Abrahamson (1991; 1996); Abrahamson and Fairchild (1999)).
Consultants grasp the concept and promise an enormous improvement of efficiency (Schiltknecht (2004); Schütz (2005)).
Pay-for-Performance soon became as popular in practice as it was in research. More and more often, companies in stock markets replaced the prevailing fixed salaries of CEOs with variable performance pay components such as bonus, option, and share programs. American corporations acted as the pioneers. Indeed, in the beginning, Pay-for-Perform-ance showed positive effects. The variable part of a CEO’s salary in 1993 was 37% and rose in 2003 to 57% (Bebchuk and Grinstein (2005)). In 2005, the variable part of a CEO’s salary in Switzerland was 59%, in Germany 57%, in Austria 50%, and in the United States 81% (Piazza (2006)). In research, the number of published articles in the
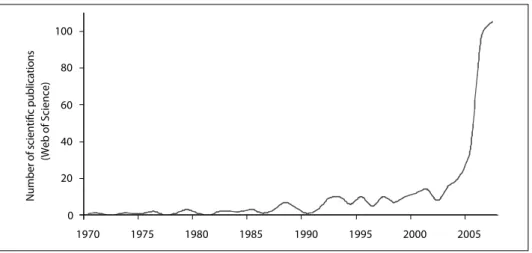
Web of Science on Pay-for-Performance has greatly increased since 2002 (see Figure 2). The causes for the increasing popularity of Pay-for-Performance are unsolved corporate govern-ance problems in modern stock corporations.
1 Eccles (1985); Eisenhardt (1985; 1989); Jensen and Murphy (1990a); Gomez-Mejia and Balkin (1992); Wel-bourne et al. (1995); Fernie and Metcalf (1996); Henderson and Fredrickson (1996); Core et al. (1999); Tosi et al. (2000).
n n
n
Figure 2: Increase of publications regarding Pay-for-Performance 0 0 2 0 4 0 6 0 8 0 0 1 5 0 0 2 0 0 0 2 5 9 9 1 0 9 9 1 5 8 9 1 0 8 9 1 5 7 9 1 0 7 9 1 N um be r o f s ci en tifi c pu bl ic at io ns (W eb o f S ci en ce )
In this article we argue that like many management fashions, Pay-for-Performance for CEOs, not only fails to satisfy the anticipated expectations, but also turns out to be dysfunctional. In section 2 we present the arguments of the proponents of Pay-for-Performance systems. In section 3 we present our empirical findings and theoretical argu-ments for the counterproductive effect of Pay-for-Performance. In section 4 we show our methods and results of our meta-analysis. In section 5 we question why the Pay-for-Perfor-mance fashion not only persist, but even penetrate domains in which even the fashion setters did not intend them to occur.
2 arguMentsin FavoroFthe Pay-For-PerForMance systeM
The basic idea of Pay-for-Performance is built on standard microeconomics, in particular on the principal agent view proposed by Jensen and Murphy (1990b). These theories build on the model of the self-interested ‘homo oeconomicus,’ accepting as a matter of course that “cash compensation should be structured to provide big rewards for outstanding performance and meaningful penalties for poor performance” (Jensen and Murphy (1990b)); in other words; that interests between the agent and the principal can be aligned via highly contingent, long-term incentives.
Jensen and Meckling (1976) suggest that interest alignment via monetary incentives can solve agency problems. The typical publicly traded commercial organizations in most Western countries has a corporate structure with hundreds, thousands, or even millions of owners, each having a small claim on the firm (Jensen and Meckling (1976)). These widely dispersed shareholders delegate the responsibility of running the business to hired professional CEOs, who act on behalf of absentee firm owners in exchange for compensa-tion packages. However, the interests of professional managers may not necessarily coin-cide with those of absent owners (Berle and Means (1932)). Ideally, the financiers and the
managers would sign a complete contract. The trouble is that most future contingencies are hard to foresee and describe, and as a result, complete contracts are technologically infea-sible. Because of these problems in designing their contract, the manager and the financier must allocate the residual control rights that allow the manager to make decisions in circum-stances not fully foreseen by the contract. Thus, managers end up with significant control rights (managerial discretion) over how to allocate investors’ funds. Managers can expro-priate shareholders by entrenching themselves and staying on the job even if they are no longer competent or qualified to run the firm (Shleifer and Vishny (1989)). Poor managers who resist being replaced might be the costliest manifestation of the agency problem (Jensen and Ruback (1983)). Further, managerial opportunism, whether in the form of expropria-tion of investors or of misallocaexpropria-tion of company funds, reduces the amount of resources that investors are willing to put up ex ante to finance the firm (Williamson (1985)).
Thus, shareholders can motivate CEOs by controlling their incentives (Eisenhardt (1989); Gomez-Mejia and Balkin (1992)) because an optimal incentive contract makes the agent’s compensation (and thus the agent’s utility) contingent on outcomes desired by the prin-cipal, i.e., expected performance (Fong and Tosi (2007)). Incentive contracts can take a variety of forms, including share ownership or stock options, with the aim of awarding the CEO according to his/her individual and specific performance. The core message is that a person who acts in the interest of another person will be rewarded2.
Agency theory proposes that organizations choose between fixed and variable pay by deter-mining how easy it is to monitor behavior. For shareholders, the actions of CEOs are not directly observable. CEOs work in less structured jobs, in highly turbulent organizations, and in work environments that encourage short-term work relationships. Therefore, CEOs should receive a higher proportion of their compensation in the form of variable pay than other workers (Stroh et al. (1996)).
3 arguMentsthat oPPosethe Pay-For-PerForMance systeM
Here, we present the arguments for why Pay-for-Performance for CEOs not only does not achieve its targets, it may even worsen the conflicts between shareholders, staff, and management.
3.1 Empirical Findings
Despite the ongoing popularity of Pay-for-Performance, firm owners (Minder (2007)), researchers3, publishers (Schwarz (2006)) and board members (Krauer (2004); Amstutz
2 By depicting compensation as a reward for performance, finance scholars are interested in the ex post settling up of contracts (Fama (1980)). “The principal-agent (…) model provides a compelling theoretical framework for understanding executive compensation.” (Aggarwal and Samwick (1999)).
3 Zajac and Westphal (1994); Tosi et al. (2000); Bertrand and Mullainathan (2001); Bebchuk and Fried (2003); Benz and Stutzer (2003); Schiltknecht (2004); Tosi and Greckhamer (2004); Bebchuk and Grinstein (2005); Frey and Osterloh (2005); Wade et al. (2006); Rost and Osterloh (2007).
(2007); Maucher (2007)) are increasingly critical of this strategy. In their opinion, many CEOs receive a far too high a salary for far too low a performance. Pay-for-Performance is said to have turned into “Pay-without-Performance” (Bebchuk and Fried (2004)). Their opinion is based on the following empirical findings (Ettore (1997)):
No incentive effect. A considerable number of empirical research papers show that there is actually no relation between the performance-related salary of a CEO and the perfor-mance of an enterprise4.
No market conformity in terms of salaries. In the United States, between 1990 and 2005 the average salary of a CEO rose 298% (Anderson et al. (2006)). In Switzerland, since 2002 CEO income has risen 60%. It is highly questionable whether this development is market-related (Rost and Osterloh (2007))5.
Pay-for-Performance as an additional income. On average, companies do not replace part of a CEO’s fixed income with variable performance components. Instead, firms pay the vari-able share, e.g. bonus pay, stocks and stock options, in addition (see Figures 3 and 4). Figure 3: Pay-for-Performance and increase of salaries of CEOs in S&P 500
enterprises in USA (Jensen et al. (2004)) $ 14,000 $ 12,000 $ 10,000 $ 8,000 $ 6,000 $ 4,000 $ 2,000 $ 0 $ 2,618 $ 3,257 $ 3,644 $ 5,309 $ 9,325 $ 10,030 $ 14,042 $ 12,940 $ 9,389 $ 6,935 Other Options Bonus Salary 1992 1993 1994 1995 1996 1997 1998 1999 2000 2001 2002 A ver age CEO P ay ($ 000s) 13% 14% 18% 54% 17% 17% 19% 47% 17% 17% 17% 17% 17% 15% 16% 17% 15% 17% 17% 20% 20% 23% 23% 23% 28% 28% 24% 21% 24% 22% 24% 24% 22% 27% 31% 34% 37% 37% 34% 38% 17% 47% 41% 49%
4 Marris (1964); Lawler (1971); Herman (1981); Redling (1981); Aoki (1984); Rich and Larson (1984); Dyl (1985); Deckop (1988); Tosi and Gomez-Mejia (1989); Tosi et al. (2000); Bertrand and Mullainathan (2001); Dalton et al. (2003); McGuire et al. (2003); Bebchuk and Grinstein (2005); Tosi (2005).
Figure 4: Pay-for-Performance and increase of salaries of CEOs in 200 SPI enterprises in Switzerland (Rost and Osterloh (2007, 47))
% 1 61% 6 % 2 22% 2 % 6 16% 1 1144%% % 9 29% 2 % 6 56% 5 % 4 14% 1 % 7 37% 3 % 9 49% 4 % 2 12% 1 % 0 70% 7 % 8 18% 1 % 5 25% 2 % 2 % 2 52% 5 % 3 2 2500 2000 1500 1000 500 0 2002 2003 2004 2005 2006 A ver age CEO C ompensation (S Fr 1000s) 14% 56% 61% 49% 14% 12% 25% 18% 52% 18% 70% 37% 29% 22% 18% 16%
Salary (Fix & Bonus) Stocks Options
As a consequence, it does not appear that Pay-for-Performance has achieved its targets. The explosion of management salaries and the string of financial scandals in big enter-prises, e.g., Enron, WorldCom, Xerox, and Tyco, as well as the present financial market crisis, contradict the view that Pay-for-Performance aligns the interests of shareholders and management6.
3.2 Wrong applicationsoF principal-agEnt-thEory
According to Principal-Agent Theory, a well-designed remuneration package for execu-tives will accomplish three things: it will attract the right execuexecu-tives at the lowest cost, retain the right executives at the lowest cost (and encourage executives to leave the firm at an appropriate time), and motivate executives to take actions that create long-run share-holder value and avoid actions that destroy value (Jensen et al. (2004)). However, since 1990, elements of conflict and negotiation have led to inefficient remuneration packages (Jensen et al. (2004)).
Nonlinear design. Pay-for-Performance is wrong applied because bonuses in enterprise practices are mostly nonlinear by design (Holthausen et al. (1995); Jensen et al. (2004)). Under the typical bonus plan, no bonus is paid until the CEO achieves a threshold
6 Some managers and compensation consultants propose that the “war for talents” demands high compensation packages (Martin and Moldoveanu (2003)). In their view, the recruitment of highly talented leaders in a global economy necessitates the payment of high salaries (Wuffli (2006)).
performance. The firm pays a threshold bonus for the threshold performance and target bonuses for achieving the target performance. Often, there is a cap on bonuses paid. The range between the threshold and cap is labelled the “incentive zone”, where incremental improvement in performance corresponds to incremental improvement in bonuses. This nonlinear design can have detrimentral incentive effects. Managers are able to trade off current for future performance by lowering their performance as soon as they realize that they cannot meet that year’s threshold (Jensen et al. (2004)). Managers capable of performing well above the cap tend to stop producing once they have maximized their bonuses.
Lack of information. Many pay packages and processes are poorly designed because remu-neration committees routinely lack the information, expertise, and necessary negotiating skills (Conyon and Peck (1998); Jensen et al. (2004)).
Remuneration committees often treat options as being a gift that they are essentially free to grant, and the perceived costs of options seem to vary with the number of options granted, rather than with the dollar value of the grants, i.e., their cost to the firm. The reason is that granting options carries no accounting charge and incurs no outlay of cash. The wide-spread use of option award plans, in which roughly the same number of share options are awarded each year, supports this view. Further, remuneration committees rarely conduct market studies of competitive pay levels, or initiate and propose new incentive plans, or retain their own compensation experts. Recommendations are made by the management working in conjunction with compensation consultants. This lacking independence implies that the committee only sees plans that have already been blessed by top managers (Daily et al. (1998)). Boards that are looking for new CEOs usually hire a professional recruiting firm to identify qualified candidates. Negotiations over pay typically begin only after the preferred candidate is identified and told that he is to be the new CEO. At this point, the bargaining power shifts to the candidate rather than to the firm.
3.3 croWding-out EFFEctsoF intrinsic motivation
Some opponents of Pay-for-Performance argue that theories based on self-interest cannot provide sufficient grounds to analyze motivation of employees, particularly those employees, such as CEOs, who perform difficult tasks7. Thus, the idea of enhancing
performance through pay is, under certain conditions, wrong in itself. This criticism can be substantiated by psychological economics (for an overview, see Frey and Benz (2004)), and motivation psychology (for an overview, see Deci and Ryan (2000)). Psychological economics challenges agency theory’s basic assumptions by proceeding from the ideas of bounded rationality and bounded self-interest (Baker (1990)). These theories distinguish between extrinsic and intrinsic motivation. An action is intrinsically motivated if it is performed for its own sake, i.e., out of interest or pleasure or to maintain an internalized norm. An action is extrinsically motivated if it is done instrumentally for the purpose of
7 Davis et al. (1997); Wiseman and Gomez-Mejia (1998); Frey and Osterloh (2002); Sundaramurthy and Lewis (2003); Osterloh and Frey (2005b); Frey and Osterloh (2006a); Reberioux (2007).
achieving a result other than the action itself, e.g., for the purpose of money. The differ-entiation between intrinsic and extrinsic motivation dates back to Atkinson (1964), De Charms (1968) and Deci (1975).
Under certain conditions, external incentives, particularly money, crowd out intrinsic motivation and have a negative effect on the performance. The conditions are: there must exists an intrinsic motivation in the first place, the external incentive is perceived as controlling, and the external incentive does not compensate the loss of intrinsic motiva-tion (Osterloh and Frey (2000)). The so called crowding-out effect (Frey (1997)) is empir-ically well documented (Frey and Jegen (2001)). Numerous laboratory experiments show that monetary rewards for intrinsically motivated tasks lead to a decline in future intrinsic motivation (Rummel and Feinberg (1988); Wiersma (1992); Tang and Hall (1995); Deci and Ryan (2000); Fehr and Gächter (2000)). Furthermore, field research confirms the crowding-out effect (Frey and Jegen (2001); Weibel et al. (2007)). These results contra-dict the standard economic model.
The crowding-out effect basically consists of three sub-effects: the overjustification effect, the spill-over effect, and the multitasking effect.
Overjustification effect. If intrinsically motivated persons are caused to act according to external control, then their intrinsic motivation is reduced (Deci (1975); Frey and Ober-holzer-Gee (1997); Deci et al. (1999); Weibel et al. (2007)). Their internal locus of causality is replaced by an external locus of causality (De Charms (1968)). They tend to enjoy their work less because their autonomy is reduced. If the reduced intrinsic motiva-tion is not compensated for by external incentives, e.g., money, the performance decreases. Using adult populations, Weibel et al. (2007) show in a meta-analysis of Pay-for-Perfor-mance studies that tangible rewards only have a positive net effect on perforPay-for-Perfor-mance when the original intrinsic motivation is low. In contrast, tangible rewards decrease efforts, i.e., such rewards have a negative net effect on performance when the original intrinsic moti-vation is high. Kominis and Emmanuel (forthcoming) support the theory, arguing that compared to extrinsic rewards, intrinsic rewards have a higher positive impact on mana-gerial motivation at the middle management level8.
Spill-over effect. If persons who were previously intrinsically motivated are rewarded monetarily for a certain task, then the intrinsic motivation is not only reduced for the task in question, but is also transferred to other domains. For example, a child who is rewarded for clearing the table will also ask to be rewarded for taking out the garbage (Frey and Osterloh (1997)). Frey and Benz (2001) offer experimental evidence for the spill-over effect. Their basic results are that in the specific area at which the performance incentives are targeted, there is on average a higher effort; but in the area not subject to the incentive mechanism, incentives crowd out intrinsically motivated voluntary cooperation. As a consequence of this spill-over effect, total efforts over the two areas tend to be reduced when extrinsic incentives are applied.
8 The value of extrinsic rewards is significantly affected by other elements of the evaluation and reward system de-sign, namely the accuracy of the performance measures and the transparency of the performance measures-re-wards link.
Multitasking effect. Pay-for-Performance promotes strategic behavior in people. In other words, they will concentrate only on tasks that carry monetary rewards and neglect anything else (Holmström and Milgrom (1991); Pfaff et al. (2000); Backes-Gellner et al. (2001); Pfaff and Stefani (2003)). For example, transactions that cannot be monitored easily, such as organizational citizenship behavior, are ignored (Weibel (2007)). There is a huge amount of empirical evidence for CEOs that confirms that Pay-for-Performance, especially stock options and bonus payments, promote manipulation.9 Examples are
“creative accounting” and “cooking the books”10. Murphy (2000) finds that firms that
tie executive pay to accounting-based performance measures are most likely to show evidence of income smoothing, thus supporting the view that executives exert influ-ence over measures of performance. The multitasking effect has caused stock options to become more and more “heroin for managers” (Jensen et al. (2004)). Rynes et al. (2005, 595) conclude that Pay-for-Performance is “…so powerful that one of the main chal-lenges is to make sure that compensation systems are not motivating the wrong kinds of behaviour…”.
3.4 adjustmEnt EFFEcts
In a dynamic perspective, the counterproductive effects of Pay for Performance are rein-forced by self-selection, strategic reactions, and budget gaming.
Self-selection. Pay-for-Performance attracts extrinsically motivated persons more than intrinsically motivated individuals (Bohnet and Oberholzer-Gee (2000); Backes-Gellner and Wolff (2001); Osterloh and Frey (2005a)). Extrinsically motivated employees rein-force the need for external control measures (Lepper and Greene (1978)). Intrinsically motivated persons perceive such a control as unfair and may search for new employment (Osterloh et al. (2007)).
An example of this self-selection-effect is the increasing tendency to fill CEO openings through external recruiting rather than through internal promotions. Murphy and Zábo-jník (2004) show that the proportion of external recruiting has doubled and the recruits’ pay premium almost quadrupled over the last 30 years. Unfortunately, the trend to hire externally is linked to the decreasing integrity of the predecessor. A possible reason is the self-selection effect: CEO positions become less attractive for intrinsically motivated persons (Rost et al. (2008)).
Strategic behavior. Compensation consultants contribute to the abuses in executive pay (Wade et al. (1997); Colvin (2001); Jensen et al. (2004)): The compensation consultant’s client is most often the CEO, not the firm’s compensation committee. Thus, compensa-tion consultants make recommendacompensa-tions on the pay of the clients who hire them (Fryer
9 Osterloh and Frey (2004); Denis et al. (2005); Efendi et al. (2006); Erickson et al. (2006); Johnson et al. (2006); Marciukaityte et al. (2006)) or even fraud (Staffelbach (2001); Osterloh and Frey (2004); Denis et al. (2005); Efendi et al. (2006); Erickson et al. (2006); Johnson et al. (2006); Marciukaityte et al. (2006); O’Connor et al. (2006).
et al. (2003)). Thus, they are inclined to serve the interests of the CEOs. Pay below the 50th percentile is often labelled “below market”, while pay above the 50th is percentile considered “competitive”. As a consequence an “elevator” effect in executive pay levels sets in (O’Reilly et al. (1988); Ezzamel and Watson (1998); Bizjak et al. (2000)). The correla-tion between firm size and executive pay is turned into a causal mechanism that rewards managers for increasing the size of the firms, even though they may destroy value in doing so (Tosi et al. (2000); Jensen et al. (2004))11. Executives who are affected by the
compen-sation consultant’s executive pay recommendation often engage the consultants in more lucrative firm-wide employee-pay-practice areas (Zehnder (2001)). These prospects for cross-selling other services increase the conflicts of interest (Jensen et al. (2004)). First, it is not realistic to expect a compensation consultant to aggressively argue against over-paying a CEO. Second, it is not realistic to expect an overpaid CEO to aggressively argue against the abuse of pay practices for lower-level employees. For example, the escalation in option-based compensation has not been limited to CEOs, but in fact has been extended down the corporate hierarchy. However, the efficiency explanation for increased equity pay might be relevant to top-level executives who can take direct actions to affect share prices, but not to lower-level employees.
Budget gaming. Normally, firms go through an annual budget cycle, in which lower-level managers submit budgets for targeted outputs in the following year. If managers are punished for submitting demanding targets, then they will start to provide informa-tion necessary to find realistic or more easily achievable targets. Therefore, over the long term, bonus plans cause a cycle of manipulations that keep multiplying. Thus, the design of many bonus plans does not reward performance, but does reward hiding information (Jensen et al. (2004)).
Therefore, we hypothesize that Pay-for-Performance systems often do not ensure that managers take optimal actions, and that over time the negative effects will be reinforced due to selection effects, strategic behavior of compensation consultants, and budget gaming:
Hypothesis 1: Pay-for-Performance reduces performance over the course of time. Today, a high pay-for-performance compensation for CEOs is not correlated with firm performance and can even reduce firm performance.
4 Method
Our research is based on previous empirical studies that examine the relation between variable executive pay and firm performance on numerous different dates. By using meta-analysis we can perform a statistical analysis of primary examinations (Hunt
11 Nearly all studies find an association between size and compensation (Tosi et al. (2000)). However, there is no agreement on whether this correlation is to be viewed as indicating management entrenchment, or whether it in-dicates the complexity of tasks and demands for managerial ability.
(1997)). As an empirical design, meta-analysis has the following advantages: quanti-fication of surveys and results, replicability, and impartiality. However, the empirical design has several disadvantages: comparability of the surveys; integration of surveys of differing quality; “publication bias” in favor of published, significant results; and “non-independent effects”12 when a survey documents several correlations (Eisend (2004)).
The disadvantages can be minimized by systematically sampling and by using properly applied methods of analysis.
We have considered all previous studies that have been published. First, we searched the Business Source Premier, Elsevier, Emerald, and Jstor databases by using the key words “executive compensation”, “CEO compensation”, CEO remuneration”, “top management compensation”, “tangible rewards”, “equity based compensation”, “high incentives”, “vari-able compensation”, “pay for performance”, “performance based compensation”, “subse-quent performance”. Second, we scanned the sources cited within these surveys for further studies. Third, we included all surveys identified by previous meta-analyses (Tosi et al. (2000); Dalton et al. (2003)).
We use studies that meet the following requirements: (1) The study measures either the CEO’s salary or the salary of the top management. (2) The survey takes performance-dependent salary components into consideration. We designate these components as
total compensation = fixed salary + bonus plans + shares and option plans, or cash compensation = fixed salary + bonus plans, or
bonus plans and/or shares and/or option plans.
(3) The survey measures the firm performance either according to the market value of a firm or according to accounting-based measurements such as ROA, ROE, or operating results. We assigned the different performance measurements according to the survey of Tosi et al. (2000) to the market value or rather to the enterprise profit in the books. (4) The survey measures the relation between salary and firm performance.
The final sample comprises 75 empirical studies with n = 123,797 firms13. These studies
document 259 statistical correlations between CEO-pay and firm performance with
n = 486,422 observations.
Most surveys do not report bivariate correlation coefficients, but indicate only the t-values of the regression coefficients, which are not supposed to be used in meta-analyses. We have considered these studies in the analyses and have checked for systematic biases. First, there is the danger of systematically biasing the results against economics authors, espe-cially when such researches are exempted. Economics journals are not likely to demand
12 For more details see (Eisend (2004)).
13 The actual sample size is smaller than 123,797 firms because some studies use a similar sample of firms. How-ever, we are not able to count the “real” sample size.
n n n n n
that researchers document the correlation coefficients. Second, authors often use analogue control variables in regressions, because the correlation between CEO salary and perfor-mance is one of the most frequently analyzed phenomena. Third, a “controlled” correla-tion measures the extent of a correlacorrela-tion more accurately.
Year. We code the studies in terms of the time period in which the study measures the relation between pay and performance. For panel studies, we determine the average year of the time period investigated.
Type of the Performance Link. To examine the effect of Pay-for-Performance of the CEO on firm performance, we distinguish between two frequently applied measures of the link between pay and performance. Bonus compensations are meant to increase the short-term, accounting-based firm value. Shares and option plans are meant to increase the long-term, market-based firm value. In our models we investigate how Pay-for-Performance affects either the market-based value of a firm or the accounting-based value of a firm.
Type of Pay Link. We differentiate between three frequently applied types of incentive pay in order to measure their separate incentive effects on performance. In our models we investigate how cash-based plans (bonus), equity-based plans (shares/options), or cash- and equity-based plans affect performance.
We also determine the overall correlation between Pay-for-Performance and average performance of the firm.
Moderation effects. We check whether the form in which the results are documented (one represents the correlation coefficient, two represents the t-value of the regression coeffi-cient) biases the investigation results systematically.
We perform computations for the meta-analysis by using the Comprehensive Meta Analysis (Borenstein (2000)). This software package transforms correlation values into Fisher’s Z, uses the approach of Hunter and Schmidt (2004), and allows us to search for sampling and measurement errors and range restriction. Before running the analyses, we plot a study’s effect size against its standard error. The studies are distributed symmetrically around the combined effect size and point out the absence of publication bias.
For each single study we determine a total effect d, also called Cohen’s d. To ensure an acceptable level of independence among studies with multiple subgroups, our unit of anal-ysis is the study. If a study documents more than one statistic correlation subgroup, we summarize these effects first on the level of the single study. We calculate this effect with the indication of the correlation coefficient r or with the indication of the t-value of the regression coefficient as follows:
d_______ i = 2 · ri
√
_____1 – r i2 di = ti √ __ Ni _____ √__Ni (1)We then calculate an average effect d for the total sample and for each period of inves-tigation respectively. We assume that an effect of 0.8 is a large effect, an effect of 0.5 is average, and an effect factor of 0.2 is small (Rustenbach (2003)). We correct for this effect by means of sampling errors. We use Fixed-Effects models as integration models, i.e., the correlations are weighted by the sample size of a study. This assumption is based on an overall population parameter of all surveys, whereby the effects of a single study randomly differ from the error in the overall sample. We calculate the total effect from the study-specific weights w, as follows:
__
d = _______ Ʃ(wi · di)
Ʃwi (2)
To estimate the development of the incentive-effect of Pay-for-Performance over the time period, we run a fixed-effect meta-regression analysis.
We also check our results for their internal homogeneity. A significant Q-value shows that we have not taken into account moderator variables, i.e., the dissimilarity between the effects in different studies results from sampling errors. We calculate the Q-value as follows: Q =
∑
i = 1 k wi (wi – _ d )2 (3) 5 results5.1 cross-sEctional modEls
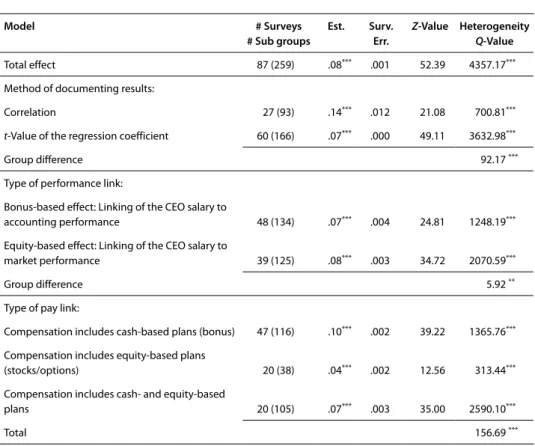
We begin by examining the incentive effect of Pay-for-Performance without consid-ering the year of investigation. Our analyses determine a correlation between CEO salary and performance of d = 0.08*** (Table 1). According to this finding, the variable CEO income contributes 0.64% to the increase of the firm performance, in other words a negligible amount. Previous investigations find similar results14. Here, the market value of an
enter-prise is increased by d = 0.08*** by shares and option plans, and bonus compensations increase the accounting value of a firm by d = 0.07***. Therefore, despite marginal differences (z = 5.92**), the incentive effect of both types of performance links appears to be equally ineffective. However, a differentiation of both types reduces the heteroge-neity in the sample (Q-Total = 4357.17***/Q-Bonus-pay = 1248.19***/Q-Equity-pay
= 2070.59***). This finding indicates moderator variables, such as the time factor. Further, a distinction of incentive types shows that (short-term) cash-based plans exert a greater influence on performance (d = 0.1***) compared to (long-term)
equity-14 Marris (1964); Lawler (1971); Herman (1981); Redling (1981); Aoki (1984); Rich and Larson (1984); Dyl (1985); Deckop (1988); Tosi and Gomez-Mejia (1989); Tosi et al. (2000); Bertrand and Mullainathan (2001); Dalton et al. (2003); McGuire et al. (2003); Bebchuk and Grinstein (2005); Tosi (2005).
based plans (d = 0.04***). This result contradicts the assumptions of agency theory, which suggests that long-term incentive contracts are especially effective in ensuring that managers take optimal actions to maximize returns. A mix of cash- and equity-based compensation exert a medium influence on performance (d = 0.07***). The magni-tude of the incentive effect differ significantly (z = 156.69**) and reduces the heteroge-neity in the sample (Q-Total = 4357.17***/Q-cash-pay = 1365.76***/Q-equity-pay
= 313.44***/Q-cash & equity-pay = 2590.10***).
Table 1: Results of the meta-analysis fixed-effects model
Model # Surveys # Sub groups Est. Surv. Err. Z-Value Heterogeneity Q-Value total effect 87 (259) .08*** .001 52.39 4357.17***
method of documenting results:
correlation 27 (93) .14*** .012 21.08 700.81***
t-Value of the regression coefficient 60 (166) .07*** .000 49.11 3632.98***
group difference 92.17 ***
type of performance link:
Bonus-based effect: Linking of the ceo salary to
accounting performance 48 (134) .07*** .004 24.81 1248.19***
equity-based effect: Linking of the ceo salary to
market performance 39 (125) .08*** .003 34.72 2070.59***
group difference 5.92 **
type of pay link:
compensation includes cash-based plans (bonus) 47 (116) .10*** .002 39.22 1365.76***
compensation includes equity-based plans
(stocks/options) 20 (38) .04*** .002 12.56 313.44***
compensation includes cash- and equity-based
plans 20 (105) .07*** .003 35.00 2590.10***
total 156.69 ***
Significance levels: **p < 0.05, ***p < 0.01.
A systematic bias is considered to be minor. The heterogeneity is reduced only margin-ally in a differentiated analysis (Q-Total = 4357.17***/Q-Correlation = 700.81***/ Q-t-value = 3632.98***). Studies documenting bivariate correlations determine that Pay-for-Performance (d = 0.14***) has a significantly higher incentive effect than do studies displaying correlations that are controlled regression-analytically (d = 0.07***).
5.2 longitudinal modEls
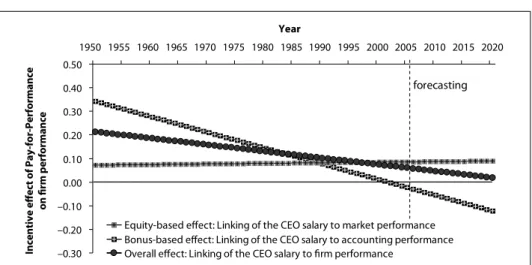
Figure 5 and Table 2 display the development of the incentive effect of Pay-for-Perform-ance over time15. The development of the general correlation between variable CEO
sala-ries and firm performance suggests that the Pay-for-Performance was not always ineffective. It is rather that the effectiveness decreases over the years (β = –0.003***). According to regression results, in 1950 a variable CEO income increased the firm performance at d = 0.21.This result is a statistically moderate correlation. Nowadays, salary and perform-ance are only linked to each other atd = 0.05; an almost nonexistent link. Extrapolating these results into the future means that in 2025, a variable CEO salary and firm perform-ance will not be linked at all anymore(d = zero).
Figure 5: Graphic diagram of the regression results
–0.30 –0.20 –0.10 0.00 0.10 0.20 0.30 0.40 0.50 1950 1955 1960 1965 1970 1975 1980 1985 1990 1995 2000 2005 2010 2015 2020 Year In ce nt iv e eff ec t o f P ay -f or -P er fo rm an ce on fi rm p er fo rm an ce
Equity-based effect: Linking of the CEO salary to market performance Bonus-based effect: Linking of the CEO salary to accounting performance Overall effect: Linking of the CEO salary to firm performance
forecasting
Over a period of time, Pay-for-Performance has a constant incentive effect of d = 0.07
on the long-term, market-based value of a firm (β = zero; see Figure 5). The result docu-mented in the surveys does not change this finding (for the t-value: β = zero). For surveys that examine the correlation coefficient, there are not enough cases for reliable regression estimations. Therefore, whether and how many options and shares firms give their CEOs was and is irrelevant for the firm performance. The time-effect of equity-based plans on performance confirms this result: Over time, equity-based plans have a constant incentive effect of d = 0.04 on the performance of a firm (β = zero). This tautolog-ical “correlation” between Pay-for-Performance and the market-based value of a firm is substantiated by Jensen et al. (2004). These authors show that the variable salary of CEOs consisting of shares and options fluctuates in line with the S&P 500 index.
15 We verified the regression results by robustness checks because early studies are under-represented and therefore might skew the results. When we exclude studies for the years 1950-1960 we obtain similar results.
Pay-for-Performance reduces the short-term, accounting-based value of a firm over a number of years (β = –0.007***). In 1950, a CEO-bonus caused an impressive increase of the firm profit by d = 0.34, but in 2007, a higher CEO bonus causes a slight decline of the enterprise profit (d = –0.04). If we extrapolate this result, then the negative correlation will be clear in the year 2020 (d = –0.12). Accordingly, the probability of a downturn of the accounting-based value of a firm will rise in the future when a bonus is granted. The results documented in the surveys do not change this finding (for the t-value:
β = –0.007***, for correlations: β = –0.011***). The time-effect of bonus-based plans on performance confirms that over the long term, equity-based plans have a decreasing incentive effect on firm performance (β = –0.005***).
Table 2: Regression results for the fixed-effects model
Regression coefficient Constant Heterogeneity
Model est. Std. err. Z -value est. Std. err. Z -value Q -Value model Tau- square total effect –.003*** .000 –18.45 6.45*** .345 18.67 340.46 .008
type of performance link: Bonus-based effect: Linking of the
ceo salary to accounting performance –.007*** .000 –21.72 13.28*** .61 21.84 471.64 .007
equity-based effect: Linking of the
ceo salary to market performance .000 .000 .70 –.41 .63 –.66 .62 .012 method of documenting results:
correlation –.005*** .001 –7.40 10.93*** 1.46 7.495 54.80 .026 t-value of the regression coefficient –.002*** .000 10.39 4.91*** .46 10.61 107.84 .011
type of performance link (only correlations):
Bonus-based effect: Linking of the
ceo salary to accounting performance –.011*** .000 –13.09 21.20*** 1.61 13.15 171.24 .015
equity-based effect: Linking of the
ceo salary to market performance – – – – – – – –
type of performance link (only
t-values regression coefficient): Bonus-based effect: Linking of the
ceo salary to accounting performance –.007*** .000 –17.21 12.16*** .70 17.30 296.03 .005
equity-based effect: Linking of the
ceo salary to market performance –.000 .000 –.18 .20 .64 .31 .03 .011 type of pay link:
compensation includes cash-based
plans (bonus) –.005*** .000 –15.93 10.81*** .67 15.93 253.72 .006
compensation includes equity-based
plans (stocks/options) .000 .000 .17 –.09 .80 –.11 .03 .004 compensation includes cash-
& equity-based plans –.003*** .000 –9.66 5.36*** .55 9.79 93.27 .011
5.3 robustnEss chEck
To substantiate our findings, we run a robustness check using recent primary data. Our database comprises 108 companies quoted on the Swiss Exchange SWX. The sample includes the 100 biggest firms measured by market capitalization in the years 2005 and 2006, i.e., all companies of the Swiss Market Index (SMI) and the biggest companies in the Swiss Performance Index (SPI).
We measure executive compensation as the average compensation in Thousend Swiss Francs of executive team members in 2005-2006. We calculate the average compensation of executive team members as the total earnings divided by the number of people being paid in that year. We adjust the number of members to take into account effective atten-dance in months. We use the salary calculations in the Ethos report (2006). We calcu-late the value of shares as the number of shares multiplied by the published value of these shares. We calculate the value of options with the Black-Scholes model. Figure 6 illustrates the level and the composition of executive compensation in our sample.
Figure 6: Executives compensation in 108 Swiss SMI/SPI enterprises
2006 2005 Co m pe ns at io n pe r E xe cu ti ve T ea m M em be r Fixed Pay Fixed Pay Bonus Pay Bonus Pay Stock Options Stocks Stocks Stock Options Other Benefits Other Benefits Tsd.SFr. 3,500 Tsd.SFr. 3,000 Tsd.SFr. 2,500 Tsd.SFr. 2,500 Tsd.SFr. 2,500 Tsd.SFr. 2,500 Tsd.SFr. 500 Tsd.SFr. 4,000 Tsd.SFr. 0
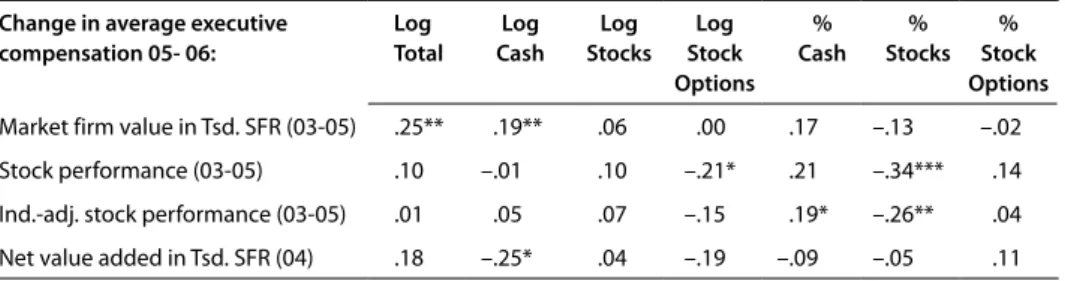
Pay-Performance Sensitivity. First, we test the assumption of agency theory, which relates the sensitivity of pay to performance, i.e., that changes in shareholder wealth are corre-lated with changes in executive compensation (Jensen and Murphy (1990a)). Greater pay-performance-sensitivities indicate greater alignment of executive and shareholder interests. In Table 3, we find three indications of interest alignment. A change in the market value of a firm increases the total executive compensation in the following year (r = 0.25**).
Surprisingly, an increase in shareholder wealth increases cash, but not equity, compen-sation, which we measured as the sum of fixed and bonus pay (r = 0.19**). The last
finding is confirmed by the result that an increase in industry-adjusted stock performance increases the percentage of cash compensation (r = 0.19*). Moreover, we find many indications of missing interest alignment. Most of the correlations between performance changes and pay changes are not significant.
Further, we find three indications that clearly contradict agency theory. An increase in stock performance decreases the total amount(r = –0.21*) and the percentage (r = – 0.34***) of stock compensation. This finding is further confirmed by the result that an increase in industry-adjusted stock performance decreases the percentage of stock compensation (r = –0.26**).We interpret this finding to mean that in compensation practice,the best-paid executives did not perform better; executive compensation practice do not use long-term incentives to align the interests of executives and shareholders. Table 3: Pay-Performance sensitivity of executive compensation16
Change in average executive compensation 05- 06: Log Total Log Cash Log Stocks Log Stock Options % Cash % Stocks % Stock Options
market firm value in tsd. Sfr (03-05) .25** .19** .06 .00 .17 –.13 –.02
Stock performance (03-05) .10 –.01 .10 –.21* .21 –.34*** .14
ind.-adj. stock performance (03-05) .01 .05 .07 –.15 .19* –.26** .04
net value added in tsd. Sfr (04) .18 –.25* .04 –.19 –.09 –.05 .11
*p < 0.1, **p < 0.05, ***p < 0.01, N = 108.
Pay-for-Performance Link. Second, we test the agency theory assumption that individuals are motivated by incentives. From this viewpoint, an optimal incentive contract makes the agent’s compensation contingent on outcomes desired by the principal (Fong and Tosi (2007)). In Table 4, we find no indications for positive incentive effects. Most of the correlations between pay and performance are not significant. We find several indi-cations that clearly contradict with agency theory. A higher amount (–0.16*/–0.22**/ –0.19**) and a higher percentage (–0.17*/–0.22**) of variable pay, measured as the sum of bonus and equity pay, decreases firm performance in the long run. Further, a higher percentage of stock options also decreases firm performance in the long run
(–0.18*/–0.18*). According to these findings, highly contingent or long-term incentive contracts do not motivate, but rather de-incentivize, CEOs to work in the interest of their company. We even find a negative correlation between total executive compensation and expected firm performance, which we measure as the performance expectations of business
16 We calculate Stock performance as a percentage, using the differences between stock performance over a set pe-riod of time. We calculate Industry-adjusted stock performance as a percentage, using the Swiss Performance In-dexes of each industry (SPI) sector end of the year (published by the Swiss Exchange SWX). We measure Net value added as the Sharpe ratio 2004 multiplied by the market capitalization on January 1, 2004, according to corporate action /dividends/ reduction or increase in capital stock. The Sharpe ratio 2004 equals the yield on in-vestment 2004 minus market rate of return 2004 with beta risk 1.1.2004.
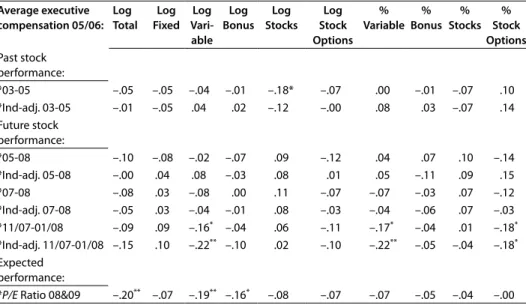
analysts (–0.2**). Thus, higher amounts of executive compensations do not necessarily increase shareholder wealth, but have the potential to decrease shareholder wealth. Table 4: Pay-for-Performance link of executive compensation17
Average executive compensation 05/06: Log Total Log Fixed Log Vari-able Log Bonus Log Stocks Log Stock Options % Variable % Bonus % Stocks % Stock Options Past stock performance: *03-05 –.05 –.05 –.04 –.01 –.18* –.07 .00 –.01 –.07 .10 *ind-adj. 03-05 –.01 –.05 .04 .02 –.12 –.00 .08 .03 –.07 .14 future stock performance: *05-08 –.10 –.08 –.02 –.07 .09 –.12 .04 .07 .10 –.14 *ind-adj. 05-08 –.00 .04 .08 –.03 .08 .01 .05 –.11 .09 .15 *07-08 –.08 .03 –.08 .00 .11 –.07 –.07 –.03 .07 –.12 *ind-adj. 07-08 –.05 .03 –.04 –.01 .08 –.03 –.04 –.06 .07 –.03 *11/07-01/08 –.09 .09 –.16* –.04 .06 –.11 –.17* –.04 .01 –.18* *ind-adj. 11/07-01/08 –.15 .10 –.22** –.10 .02 –.10 –.22** –.05 –.04 –.18* expected performance:
*P/E ratio 08&09 –.20** –.07 –.19** –.16* –.08 –.07 –.07 –.05 –.04 –.00 *p < 0.1, **p < 0.05, ***p < 0.01, N = 108.
6 Why does Pay-For-PerForMance stayin Fashion?
We have shown that in the long run, Pay-for-Performance has no positive incentive effect. Our results indicate that executive pay has become decoupled from firm performance. Given these facts, two questions arise that we believe are essential for further research and compensation practice.
6.1 Why did bonus paymEnts, Which arE linkEdtothE accounting-basEd
valuEoFa Firm, initially opEratEd positivEly?
When they first appear, management fashions often cause a kind of optimism and excite-ment: “...managers apply them successfully in order to flatter, inspire and demand or to induce actions...” (Kieser and Hegele, (1998, 40) referring to Eccles and Nohria (1992)).
17 We calculate Stock performance as a percentage, using the differences between stock performance over a set pe-riod of time. We calculate Industry-adjusted stock performance as a percentage, using the Swiss Performance In-dexes of each industry (SPI) sector end of the year (published by the Swiss Exchange SWX). We measure expect-ed performance by expectexpect-ed Price-Earnings Ratio of business analysts of the ZKB (Züricher Kantonalbank).
A new management fashion motivates firms to test new solutions. As people become increasingly convinced that a management fashion works, they are less likely to seek or notice evidence to the contrary. Positive feedback processes dominate these dynamics, leading to rapid adoption of those new ideas lucky enough to gain a sufficient initial following (Sterman and Wittenberg (1999)). Pay-for-Performance can be interpreted as a management fashion that initially had positive effects.
6.2 Why pay-For-pErFormancEis still appliEdand rEcEntly Why has it EvEn
bEEn transFErrEdto organizations that arE not proFit-oriEntEd?
Numerous firms are aware of the questionable effects of Pay-for-Performance. A 2004 survey of 350 companies showed that 83% of all organizations believe that their Pay-for-Performance programs are either only somewhat successful or not successful at all at accomplishing their goals (Hewitt Associates News & Information (2004)). Neverthe-less, firms do not abolish the systems once they have been introduced. In addition, many authorities have adopted Pay-for-Performance under the concept of “New Public Manage-ment”, even for physicians and judges. Pay-for-Performance has even been introduced for researchers at universities, e.g., by means of periodical evaluations in which publications and citations are counted. The effects are as counterproductive as they are for corporate CEOs. For physicians, treating seriously ill patients becomes unattractive (Osterloh and Rost (2005)). Bøgh Andersen (2007) show that there is a crowding-out effect of intrinsic motivation among dentists. Judges react with less thorough verdicts (Schneider (2007)). And scientists react strategically: they increase the number of their publications at the cost of the quality of their research (Frey (2003); Frey and Osterloh (2006b)).
Further research is needed to explain why the adoption of Pay-for-Performance is increasing despite its obvious failures. Recent research offers three suggestions that partly overlap. First, Ghoshal (2005) laments the fact that in the training of new managers at reputable MBA centers, the prevalence of standard economic approaches leads to a situation in which these theories’ conception of human beings as opportunists tends to become reality. Managers apply what they have learned in their MBA lessons, namely, that it would be naïve to assume that people are benevolent and work voluntarily in the interest of their company. Thus, they have to be motivated extrinsically and the exclu-sionary effect of intrinsic motivation sets in. As a consequence, wrong theories guide management and policy decisions (Ghoshal and Moran (1996)). Second, Ferraro, Pfeffer, and Sutton (2005) state that in social sciences, theory becomes a normative guidance on how to act, which itself sets a fulfilling prophecy in motion. In their view, this self-fulfilling prophecy is true of economics. The authors draw on Robert Merton’s definition of a self-fulfilling prophecy as one that “is, in the beginning, a falsedefinition of a situa-tion evoking a behavior which makes the originally false concepsitua-tion come true”(Merton (1948)). Ferraro, Pfeffer, and Sutton (2005) analyze three mechanisms through which theories become self-fulfilling: institutional designs, e.g., reward systems, measurement practices, and selection processes that reflect the theories of their designers; social norms, e.g., obeying the norm of self-interest so as not to appear foolish; and language, e.g., evoking different cognitive frames, such as the gain frame or a pro-social frame. Third,
neo-institutional organization theory (Meyer and Rowan (1977); Walgenbach and Beck (2003)) and path-dependency theory (Schreyögg and Sydow (2003)) argue that it would false to assume that shareholders can “pick and mix” an optimal compensation contract for CEOs (Buck and Shahrim (2005)). In particular, national culture and antecedent insti-tutions are important contingencies. Key actors have low absorptive capacity, and little ability to quickly unlearn embedded routines and work templates. Firms adopt measures like Pay for Performance, which initially improved the performance of some organizations, even though they have not proven to be effective. Nevertheless, such management fashions are considered as features of modern thinking – until the next new fashion comes along.
7 liMitationsand conclusion Our study has some important limitations.
First, meta-analyses do not allow using a fixed-effect approach. A fixed-effect approach would increase the generalizability of the findings by addressing the important concern of accounting for unchanging firm- or country-specific components. Second, in the meta-analysis, our dependent variable is sometimes overall CEO compensation rather then the incentive compensation of CEOs. More finely grained data would clearly be preferable. Third, our empirical design, using a meta-analysis and a cross-sectional analysis within one country, has disadvantages. It would be illuminating to conduct longitudinal studies on different firms and in countries and examine the conditions under which the pay-for-performance link increases or declines. The generalization of our findings clearly repre-sents areas for further research.
Overall, the results of this study show that Pay-for-Performance has counterproductive effects, especially for CEO,s and like most fashions does not provide solutions to its intended goals. Future research should examine why it is still applied.
reFerences (*bibliograPhyoF studiesinthe Meta-analysis)
Aboody, David, and Ron Kasznik (2000), CEO stock option awards and the timing of corporate voluntary disclosu-res, Journal of Accounting and Economics 29, 73-100.
Abowd, John M. (1990), Does Performance-Based Managerial Compensation Affect Corporate Performance?, Indus-trial and Labor Relations Review 43, 52-73.*
Abrahamson, Eric (1991), Managerial Fads and Fashions – the Diffusion and Rejection of Innovations, Academy of Management Review 16, 586-612.
Abrahamson, Eric (1996), Management fashion, Academy of Management Review 21, 254-285.
Abrahamson, Eric and Gregory Fairchild (1999), Management fashion: Lifecycles, triggers, and collective learning processes, Administrative Science Quarterly 44, 708-740.
Aggarwal, Rajesh K. and Andrew A. Samwick (1999), Executive compensation, strategic competition, and relative performance evaluation: Theory and evidence, Journal of Finance 54, 1999-2043.
Aggarwal, Rajesh K. and Andrew A. Samwick (1999), The Other Side of the Trade-Off: The Impact of Risk on Executive Compensation, Journal of Political Economy 107, 65-105.*
Allen, Michael P. (1974), The structure of interorganizational elite cooptation, American Sociological Review 39, S. 393-406.
Amstutz, Max D. (2007), Macht und Ohnmacht des Aktionärs. Möglichkeiten und Grenzen der Corporate Governance bei der Wahrung der Aktionärsinteressen, Zürich: Verlag Neue Züricher Zeitung.
Anderson, Sarah, John Cavanagh, Chuck Collins, Eric Benjamin, and Sam Pizzigati (2006), Executive Excess 2006: Defense and Oil Executives cash in on Conflict, Working Paper, Institute for Policy Studies, Washington, and United for a Fair Economy, 1-55.
Aoki, Masahiko (1984), The Co-operative Game Theory of the Firm, Oxford: Oxford University Press. Atkinson, John W. (1964), An introduction to motivation, Princeton: Van Nostrand.
Backes-Gellner, Uschi and Brigitta Wolff (2001), Personalmanagement, in Peter-Jürgen Jost (ed.), Die Prinzipal-Agen-ten-Theorie in der Betriebswirtschaftslehre, Stuttgart: Schäffer-Poeschel Verlag, 395-437.
Backes-Gellner, Uschi, Edward P. Lazear, and Birgitta Wolff (2001), Personalökonomik. Fortgeschrittene Anwendungen für das Management, Stuttgart: Schäffer-Poeschel Verlag.
Baker, Terry, Denton Collins, and Austin L. Reitenga (2003), Stock option and earnings management incentives,
Journal of Accounting, Auditing and Finance 18, 557-582.
Baker, Wayne E. (1990), The Social Structure of a National Securities Market, American Journal of Sociology 89, 775-811.
Bartlett, Robin L. and Timothy I. Miller (1988), Executive Earnings by Gender: A Case Study, The Social Science Quarterly 12, 892-909.*
Bebchuk, Lucian and Jesse Fried (2003), Executive Compensation as an Agency Problem, Journal of Economic Per-spectives 17, 71-92.
Bebchuk, Lucian and Jesse Fried (2004), Pay without Performance. The Unfulfilled Promise of Executive Compensation,
London: Mass.
Bebchuk, Lucian and Yaniv Grinstein (2005), The Growth of Executive Pay, Oxford Review of Economic Policy 21, 283-303.*
Belkaoui, Ahmed and Ronald D. Picur (1993), An Analysis of the Use of Accounting and Market Measures of Perfor-mance, CEO Experience and Nature of Deviation from Analyst Forecasts, Managerial Finance 19, 4-11.* Belliveau, Maura A., Charles A. O’Reilly III, and James B. Wade (1996), Social Capital at the Top: Effects of Social
Similarity and Status on CEO Compensation, Academy of Management Journal 39, 1568-1593.*
Benders, Jos, and Kees van Veen (2001), What’s in a Fashion? Interpretative Viability and Management Fashions,
Organization 8(1), 33-53.
Benito, Andrew and Martin J. Conyon (1999), The Governance of Directors’ Pay: Evidence forma UK Companies,
Journal of Management and Governance 3, 117-136.*
Benz, Matthias and Allois Stutzer (2003), Was erklärt die steigenden Managerlöhne?, Die Unternehmung 57, 5-19.
Berle, Adolph A. and Gardiner C. Means (1932), The Modern Corporation and Privat Property, New York: Harcourt, Brace & World.
Bertrand, Marianne and Sendhil Mullainathan (2001), Are CEOs rewarded for luck? The ones without principals are,
Quarterly Journal of Economics 116, 901-932.
Besanko, David, David Dranove, Marc Shanley, and Scott Schaefer (2004), Economics of Strategy, Hoboken: John Wiley & Sons.
Bilimoria, Diana (1992), Corporate Control, Crime and Compensation: An Empirical Exam of Large Corporations,
Human Relations 48, 891-908.*
Bizjak, John M., Michael L. Lemmon, and Lalitha Naveen (2000), Has the use of peer groups contributed to higher levels of executive compensation?, Working Paper, Portland State University.
Bloom, Matt and George T. Milkovich (1998), Relationships among risk, Incentive Pay and Organizational Perfor-mance, Academy of Management Journal 41, 283-297.*
Bøgh Andersen, Lotte (2007), Professional norms, public service motivation and economic incentives. What motivates public employees?, Paper for Study Group III, EGPA 2007.
Bohnet, Iris and Felix Oberholzer-Gee (2000), Leistungslohn: Motivations- und Selektionseffekte, Zeitschrift Führung und Organisation 69, 77-82.
Borenstein, Martin (2000), Comprehensive meta-analysis [Computer Program], Englewood, NJ: Biostat. Boyd, Brian K. (1994), Board Control and CEO Compensation, Strategic Management Journal 15, 335-344.* Buck, Trevor, Alistair C. Bruce, Brian G. M. Main, and Henry Udueni (2003), Long Term Incentive Plans, Executive
Pay and UK Company Performance, Journal of Management Studies 40, 1703-1721.*
Buck, Trevor and Azura Shahrim (2005), Corporate Governance, Path Dependency and Neo-Institutionalism: Busi-ness History and Modern Germany, in Trevor Morrow, Sharon Loane, and Jim Bell (eds.), International business in an enlarging europe, New York: Palgrave Macmillan Ltd.
Carpenter, Mason A., Gerard W. Sanders, and Hal B. Gregersen (2001), Bundling Human Capital with Organiza-tional Context: The Impact of InternaOrganiza-tional Assignment Experience on MultinaOrganiza-tional Firm Performance and CEO-pay, Academy of Management Journal 44, 493-511. *
Carson, Paula Phillips, Patricia A. Lanier, Kerry David Carson, and Brandi N. Guidry (2000), Clearing a Path through the Management Fashion Jungle: Some preliminary Trailblazing, Academy of Management Journal 43, 1143-1158.
Chauvin, Keith W. and Catherine Shenoy (2001), Stock price decreases prior to executive stock option grants, Journal of Corporate Finance 7, 53-76.
Cheng, Suwina and Michael Firth (2005), Ownership, Corporate Governance and Top Management Pay in Hong Kong, Corporate Governance: An International Review 13, 291-302.*
Colvin, Geoffrey (2001), The great CEO pay heist, Fortune 143(14), 64-+.
Conyon, Martin J. (1998), Directors’ Pay and Turnover: An Application to a Sample of Large UK Firms, Oxford Bulletin of Economics and Statistics 60, 485-507.*
Conyon, Martin J. (2006), Executive Compensation and Incentives, Academy of Management Perspectives 20, 25-44.* Conyon, Martin J. and Graham V. Sadler (2001), Executive Pay, Tournaments and Corporate Performance in UK
Firms, International Journal of Management Reviews 3, 141-168.*
Conyon, Martin J. and Kevin J. Murphy (2000), The Prince and the Pauper? CEO-Pay in the United States and United Kingdom, The Economic Journal 110, 640-671.*
Conyon, Martin J. and Simon I. Peck (1998), Board Control, Remuneration Committees, and Top Management Compensation, Academy of Management Journal 41, 146-157.*
Coombs, Joseph E. and Matthew K. Gilley (2005), Stakeholder Management as a Predictor of CEO Compensation: Main Effects and Interactions with Financial Performance, Strategic Management Journal 26, 827-840.* Cordeiro, James J. and Rajaram Veliyath (2003), Beyond Pay for Performance: A Panel Study of the Determinants of
CEO Compensation, American Business Review 21, 56-66.*
Core, John E., Robert W. Holthausen, and David F. Larcker (1999), Corporate Governance, Chief Executive Officer Compensation, and Firm Performance, Journal of Financial Economics 51, 371-406.*
Daily, Catherine M., Jonathan L. Johnson, Alan E. Ellstrand, and Dan R. Dalton (1998), Compensation committee composition as a determinant of CEO compensation, Academy of Management Journal 41, 209-220.
Dalton, Dan R., Catherine M. Daily, S. Trevis Certo, and Rungpen Roengpitya (2003), Meta-analysis of financial performance and equity: Fusion or confusion?, Academy of Management Journal 46, 13-26.
David, Parthiban, Rahul Kochhar, and Edward Levitas (1998), The Effect of Institutional Investors on the Level and Mix of CEO Compensation, Academy of Management Journal 41, 200-208.*
Davis, James H., F. David Schoorman, and Lex Donaldson (1997), The distinctiveness of agency theory and steward-ship theory – Reply, Academy of Management Review 22, 611-613.
De Charms, Richard (1968), Personal causation:the internal affective determinants of behavior, New York: Academic Press.
Deci, Edward L. and Richard M. Ryan (2000), The “what” and “why” of goal pursuits: Human needs and the self-determination of behavior, Psychological Inquiry 11, 227-268.
Deci, Edward L., Richard Koestner, and Richard M. Ryan (1999), A meta-analytic review of experiments examining the effects of extrinsic rewards on intrinsic motivation, Psychological Bulletin 125, 627-668.
Deci, Edward, L. (1975), Intrinsic motivation, New York, London: Plenum Press.
Deckop, John R. (1988), Determinants of Chief Executive Officer Compensation, Industrial & Labor Relations Review
41, 215-226.
Deckop, John R. (1988), Determinants of Chief Executive Officer Compensation, Industrial & Labor Relations Review
41, 215-226.*
Denis, David J., Paul Hanouna, and Atulya Sarin (2005), Is there a dark Side to Incentive Compensation?, SSRN Elec-tronic Paper Collection, http://ssrn.com/abstract=695583, 1-42.
Douglas, Evan J. and Rexford E. Santerre (1990), Incentive Contracts and Stockholder Monitoring: Substitute Source of Executive Compliance, Quarterly Review of Economics and Business 30, 24-31.*
Dyl, Edward A. (1985), Reinganum on Management Succession, Administrative Science Quarterly 30, 373-374. Eccles, Robert G. (1985), The Transfer Pricing Problem: A Theory for Practice, Lexington, MA: Lexington Books. Eccles, Robert G. and Nitin Nohria (1992), Beyond the Hype. Rediscovering the Essence of Management, Boston, MA. Efendi, Jap, Anup Srivastava, and Edward P. Swanson (2006), Why do Corporate Managers misstate Financial State-ments?The Role of Option Compensation and other Factors, SSRN Electronic Paper Collection, http://ssrn.com/ abstract=547922, 1-62.
Eisend, Martin (2004), Metaanalyse. Einführung und kritische Diskussion, Betriebswirtschaftliche Reihe, Fachbereich Wirtschaftswissenschaft der Freien Universität Berlin 8.
Eisenhardt, Kathleen M. (1985), Control: organizational and economic approaches, Management Science 31, 134-149. Eisenhardt, Kathleen M. (1989), Agency Theory – an Assessment and Review, Academy of Management Review 14,
57-74.
Erickson, Merle, Michelle Hanlon, and Edward L. Maydew (2006), Is there a Link between Executive Equity Incen-tives and Accounting Fraud?, Journal of Accounting Research 44, 113-143.
Ethos (2006), Vergütungen der Führungsinstanzen der 100 grössten in der Schweiz kotierten Unternehmen, Ethos Studien.
Ettore, Barbara (1997), What’s the next Business Buzzword?, Management Review 86(8), 33-35.
Ezzamel, Mahmoud and Robert Watson (1998), Market comparison earnings and the bidding-up of executive cash compensation: Evidence from the United Kingdom, Academy of Management Journal 41, 221-231.
Fama, Eugene F. (1980), Agency Problems and the Theory of the Firm, The University of Chicago Press 88, 288-307. Fehr, Ernst and Simon Gächter (2000), Do Incentive Contracts Crowd Out Voluntary Contribution?, Working Paper
(34).
Fernie, Sue and David Metcalf (1996), Low pay and minimum wages: the British evidence: Centre for Economic Performance.
Ferraro, Fabrizio, Jeffrey Pfeffer, and Robert I. Sutton (2005), Economics language and assumptions: How theories can become self-fulfilling, Academy of Management Review 30, 8-24.
Finkelstein, Sydney and Brian K. Boyd (1998), How much does the CEO matter? The Role of Managerial Discretion in the Setting of CEO Compensation, Academy of Management Journal 41, 179-199.*
Finkelstein, Sydney and Donald C. Hambrick (1989), Top Executive Compensation: A Study of the Intersection of Markets and Political Processes, Strategic Management Journal 10, 121-134.*