Why Statically Estimate Code Coverage Is So Hard?
A Report of Lessons Learned
Maur´ıcio F. Aniche, Gustavo A. Oliva, Marco A. Gerosa
Department of Computer ScienceUniversity of S˜ao Paulo
E-mails:{aniche, goliva, gerosa}@ime.usp.br Abstract—The calculation of test coverage is often
unfea-sible for large-scale mining software repositories studies, as its computation requires building each project and executing their test suites. Because of that, we have been working on heuristics to calculate code coverage based on static code analysis. However, our results have been disappointing so far. In this paper, we present our approach to the problem and an evaluation involving 18 open source projects (around 2,700 classes) from the Apache Software Foundation. Results show that our approach provides acceptable results for only 50% of all classes. We believe researchers can learn from our mistakes and possibly derive a better approach. We advise researchers who need to use code coverage in their studies to select projects with a well-defined build system, such as Maven.
I. INTRODUCTION
The use of mining software repositories techniques has been growing in the Software Engineering community [5], [7], [6]. Researchers make use of different sources of data to understand phenomena and validate hypotheses. Calculating metrics from source code and historical data can provide valuable information about the internal quality of code and how it evolved over time.
Certain metrics require the code to be compiled first. An example of such metric is code coverage [9]. This metric defines the percentage of production code that is covered by the test suite. By production code, we mean all code that is executed in the production environment; in other words, all code that is not an automated test.
Many studies argue that code coverage is an important metric when dealing with software maintenance and evolution [2], [3]. Elbaumet al.[4] say that many software development practices and tools are based on this number. However, they argue that developers usually calculate it for a single version of the system, and perform analysis on future versions without recalculating the numbers. We believe one reason for that is the difficulty with calculating this number over many versions of the system.
To calculate the metric, researchers must compile the code and run the automated test suite, which may depend on external resources, such as databases or web services. However, compiling a project is not a straightforward task. Each project usually has its own build process and/or might require external libraries. In practice, it is common that many of these libraries are not available by the time researchers obtain the source code. Therefore, compiling the code may not be feasible when conducting a large-scale mining software
repository study. In addition, calculating code coverage with dynamic analysis may take a while, as it depends on the size of the test suite.
Current tools that do code coverage calculation make use of what is called dynamic analysis. These tools basically instrument the compiled code, execute the tests, and register each instruction that was executed. An alternative approach would be static analysis. However, as the code is not actually executed, we need to develop heuristics to estimate the code coverage.
We have been working on alternative approaches to stati-cally calculate code coverage. Our heuristic, in a higher level, relies on the McCabe’s number [8] and the number of unit tests per method to estimate code coverage. The rationale is that McCabe’s number represents the different paths a method can possibly have. And, in theory, there should be one unit test to each possible path. Based on that, our hypothesis was that the number of tests would be close to the number of paths a method (or a class) has.
Although the idea made sense, the results were not sat-isfactory. We evaluated our implementation on approximately 2,700 classes from 18 open source projects from the Apache Software Foundation. We found that the heuristic works well for only 50% of all classes. In addition, it is not able to estimate coverage in 12% of the classes. In this paper, we present our attempt to statically calculate code coverage, all improvements we have done to our heuristic, and what we have learned during this work. We hope this paper will help researchers who are trying to do similar work.
II. BACKGROUND
Code coverage measures the degree to which production code is tested by a test suite [9]. When a test exercises a piece of code, developers say that such piece is covered. The common output of a tool that implements such metric is a percentage value, which indicates the fraction of production code lines, instructions, or even execution branches that were exercised by the test suite. Such information is shown accord-ing to different perspectives, such as per package, compilation unit, class, or method.
Emma1 and Cobertura2 are popular code coverage tools. Both of them use dynamic analysis to calculate code coverage. They instrument the code, execute the test suite, register all
1http://emma.sourceforge.net. 2http://cobertura.github.io/cobertura.
instructions that were executed, and then calculate the degree to which the production code was exercised by the test suite. These tools have three main problems for researchers: (i) depending on the size of the test suite, they can take a long time to compute the metric, (ii) they are not programming-language agnostic, which makes them less flexible, and (iii) they require compiled code.
To the best of our knowledge, there is only one study that discusses the calculation of code coverage by means of static analysis. Alves and Visser [1] propose a technique that uses slicing of static call graphs to estimate the dynamic test coverage. In their approach, they define method coverage as the ratio between covered and defined methods per class. They have showed that, at system level, the approach proved to be satisfactory. At package and class levels, the difference between the real and the calculated coverage was small in most cases.
This approach is different from ours. As calculating the real call graph of a method is computationally expensive, we used McCabe’s number (which is cheaper to be calculated) to estimate the minimum number of tests that a class should have.
III. THEALGORITHM
In practice, developers write automated tests to cover the different behaviors that a method might have. A method behaves differently if some decision (an if instruction, for example) is taken. Thus, the number of behaviors a method has may be estimated by calculating the number of linearly independent paths inside such method. This metric is known as the McCabe’s cyclomatic complexity number [8].
Based on that, our heuristic considers thatif a production method has N different branches, then it should have at least N associated automated tests. The following sub-sections explain the algorithms behind the calculation of the heuristic, as well as all iterative improvements we have made based on what we learned with each analysis.
A. Calculating McCabe’s number
There are a few techniques on how to calculate the cyclo-matic complexity (CC) of a method. The most precise way is to generate the control flow graph, and then count the number of paths in this graph.
However, creating this graph requires a complicated analy-sis of the source code. To simplify the calculation, many tools, including ours, count the number of statements that can change the flow of execution (i.e. if, for, while, case, catch, and so on). As any method contains at least one possible flow, all methods have a minimum value of 1, and when one of the listed instructions appears, this numbers gets incremented by one.
In this study, we are calculating code coverage at class level. Therefore, to calculate McCabe’s number to the entire class, we sum up the number for all methods, regardless of their external visibility. Basically, the McCabe’s number for a class is equals to the sum of each method’s McCabe’s number.
B. Calculating the number of tests of a method
A production method is tested by an automated test when the test exercises parts of it. In dynamic analysis, that is accomplished by instrumenting the code and finding which parts of the production code were executed by that test.
To accomplish that using only static analysis, we decided to count the number of times that a production method is invoked inside of an automated test. To simplify the explanation, in Listing 1, we present a piece of code that contains production and test code. The methodcalcTaxes(boolean), which belongs to the Invoice class, is tested by testCalculateTaxes(), as an invocation to that production method occurs inside of test body.
1 c l a s s I n v o i c e { 2 3 p r i v a t e d o u b l e c a l c P a r t i a l T a x ( ) { 4 / / any c o d e h e r e 5 } 6 7 p u b l i c d o u b l e c a l c T a x e s (b o o l e a n r u l e ) { 8 d o u b l e p a r t i a l = c a l c P a r t i a l T a x ( ) ; 9 10 / / any c o d e h e r e 11 r e t u r n . . . ; 12 } 13 } 14 15 @Test 16 p u b l i c v o i d t e s t C a l c u l a t e T a x e s ( ) { 17 I n v o i c e i n v = new I n v o i c e (” J o h n ”, 5 0 . 0 ) ; 18 19 d o u b l e t a x = i n v . c a l c T a x e s (f a l s e) ; 20 d o u b l e b i g g e r T a x = i n v . c a l c T a x e s (t r u e) ; 21 22 a s s e r t E q u a l s ( 5 0 ∗ 0 . 0 6 , t a x ) ; 23 a s s e r t E q u a l s ( 5 0 ∗ 0 . 0 7 , b i g g e r T a x ) ; 24 }
Listing 1: An example of a production and unit test code.
C. Calculating Code Coverage
Code coverage can be calculated on different levels, such as method level, class level, or even system level. In this paper, we focus on code coverage at the class level. We conceived our heuristic as follows (Equation 1): for a certain class C
with methods m1, ..., mn, the code coverage of C is the ratio
of the number of unit tests in the suite that target a certain method from C to the sum of McCabe’s number from each method inside C. In the formula, CC stands for Cyclomatic Complexity. The min function covers the scenario in which the number of unit tests for a specific method is higher than its CC.
Cov(C) =
Pn
i=1min(U nitT ests(mi), CC(mi))
Pn
i=1CC(mi)
(1)
Suppose that the classInvoicehas a cyclomatic complexity of 10, and there are 6 unit tests invoking methods that belong to this class. In this case, the result would be 6 / 10 = 0.6, meaning 60% of code coverage.
IV. THEIMPLEMENTATION
To validate our algorithm, we decided to write a proof-of-concept implementation. The tool was developed in Java. It uses the japa-parser framework3 to parse Java code. The framework creates an abstract syntax tree and allows develop-ers to navigate and extract information from this tree.
Our implementation calculates McCabe’s number by count-ing the number of statements, such as ifs, switchs, etc, for each method. It also detects the production methods that are invoked inside an automated test. To do that, the tool stores, in an internal data structure, all variables and their types. And, as soon as a method invocation occurs, such asinv.calcTaxes()in the Listing above, the tool looks for the type of theinvvariable and marks the methodInvoice.calcTaxes()as tested by the unit test methodtestCalculateTaxes.
The tool is freely available at Github4. As the idea was not validate the tool, but the heuristic, it is not production-ready, and contains a few implementation problems, that will be discussed later on. Interestingly, the tool is very performatic and has a linear time of execution.
V. EXPERIMENTALDESIGN
To validate the heuristic, we compared its results with those produced by Cobertura - which is one of the most popular coverage tools for Java (it uses dynamic analysis). We have analyzed around 2,700 classes from 18 different projects from the Apache repository5. All of them were implemented in Java, and belong to different domains.
The projects were chosen based on a few criteria: (i) the build system was Maven; (ii) were written in Java; (iii) had the Cobertura plugin configured in the build file. All of them were cloned into a server through the Apache’s Git interface. After that, all projects were compiled and the tests were executed. As all chosen projects follow Maven’s conventions, the code coverage task was executed, and its output was stored in a database. We then ran multiple versions of our heuristic in all projects, and the output was also stored in the same database.
Both tools generate a number in the interval [0,1]. 0 (zero) means that the class does not have any automated test, while 1 (one) means that the class is fully covered. With both sets of numbers, we calculated the subtraction between our estimate and Cobertura’s. Every time this difference reaches zero, it means that both numbers were equal, and the heuristic has worked as expected and has precisely guessed the coverage. A negative number indicates that our heuristic has calculated a smaller number than the real one. Analogously, a positive number indicates that the heuristic has calculated a higher number.
VI. FINDINGS ANDLESSONSLEARNED
The first version of our heuristic was exactly the same we described:
3https://code.google.com/p/javaparser/.
4 http://www.github.com/mauricioaniche/gelato2.
5The selected projects were: axis2, cloudstack, com, commons, cxf, jcp,
log4j, maven, ode, rahas, rat, schema2template, shiro, sis, sshd, tuscany, webbeans, xml
Attempt #1. We calculated McCabe’s number of all classes in the system, calculated the number of tests methods per production method, and used the Formula 1 to estimate code coverage.
Our first attempt was to try it a single project, as that would make the analysis simpler in this part of the work. We chosed the Apache Collectionsproject, as it was one of the projects evaluated by Alves [1]. For our surprise, our algorithm result was 44.08% of system coverage. In Alves’s work, the code coverage for the same project was 82.62%; Alves also ran Clover (another popular code coverage tool), which resulted in 78.39%.
In our first manual analysis, we found out that many methods do not contain a test specific to itself. Instead, that method is called by another method, which has a test. In our example code, the method calcPartialTax()does not have an exclusive automated test, but it is invoked by calcTaxes(), which is tested by testCalculateTaxes().
We also noticed that a method can be tested by any unit test in the system, and not only in its own unit test class. At the beginning, we believed that all Invoice tests would be at
InvoiceTestclass, which turned out to be a wrong assumption. Because of that, we decided to improve our heuristic, by ”recursively propagating” the test to all production methods that appear in the unit test, and to all methods that are invoked by the implementation of these production methods, and so on and so forth. It means that both calcTaxes() and
calcPartialTaxes() will be considered to be tested by testCal-culateTaxes(), even though the unit test does not directly invoke the calcPartialTaxes() method.
So, our second attempt was:
Attempt #2. We calculated McCabe’s number of all classes in the system, calculated the number of tests methods per production method, recursively propagating the test to all method invocations in the entire test suite, and used the formula to estimate code coverage.
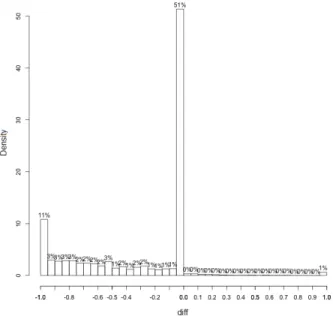
As we were much confident about this approach, we decided to start running it into all selected Apache projects. In the following figures, we show the difference between the number calculated by our heuristic and the number calculated by Cobertura (using dynamic analysis) – that is mathematically expressed in Formula 2. As said before, if the difference is zero, then our approach was able to calculate the right value for that class’ code coverage.
dif f =ourCoverage−coberturaCoverage (2) In Figure 1, One can see that in 51% of the classes, the heuristic was precise (the difference between our number and Cobertura’s number was zero). But there was around 12% in which our heuristic was not even able to calculate the coverage.
Fig. 1: The distribution of the difference in our Attempt #2
In a manual analysis on classes that the coverage was different from the oracle, we noticed another problem. Many developers prefer to write a single test method with many different calls to the same method, than to split it into many unit tests. Up to now, if our heuristic finds an invocation to a method, it was counting as only one test, regardless of the number of times that invocation happened. For example, even though there are two invocations tocalcTaxes()(in which each one can exercise two different branches of this method) inside the testtestCalculateTaxes(), our previous algorithm was counting only one test to that production method.
Based on that, we decided to improve the algorithm, and take into account the number of times methods are invoked inside the same unit test. It means that our algorithm will consider two tests to calcTaxes(), even though there is only one unit test invoking it.
Our third approach was:
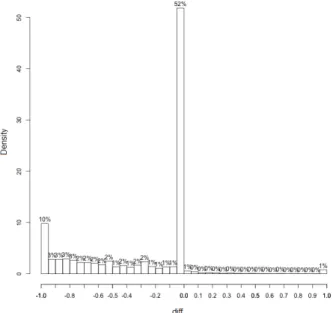
Attempt #3. We calculated McCabe’s number of all classes in the system, calculated the number of tests methods per production method, recursively propagating the test to all method invocations in the entire test suite, taking into account the number of times a method is invoked in the same unit test, and used the formula to estimate code coverage.
In Figure 2, we can see that, although the number of precise assertions increased to 52%, the number of errors were fairly distributed between the rest of the chart. In 12% of the classes, the heuristic was not able to identify the coverage. One can still notice that our heuristic usually estimates a smaller value than the real one.
In another manual analysis, we found out that there were a few classes that were not well-interpreted by our implementa-tion. Although there are many java parsers to be used, correctly
Fig. 2: The distribution of the difference in our Attempt #3
visiting the abstract syntax tree is not an easy task. Developers write code in many different ways, and the visitor must be able to deal with all of them.
We then decided to improve the implementation, and make it understand different constructions, such as constructors, static construtors, and chained invocations. By chained invoca-tions, we mean instructions like object.methodA().methodB(). Our previous implementation did not count methodB() as tested; only methodA().
Based on that, our fourth approach was:
Attempt #4. We calculated McCabe’s number of all classes in the system, calculated the number of tests methods per production method, recursively propagating the test to all method invocations (even the ones in chaining) in the entire test suite, taking into account the number of times a method is invoked in the same unit test, and used the formula to estimate code coverage.
In Figure 3, we can see that our numbers varied little compared to the previous results. The number of times the heuristic was right was still 52%, and the ratio of classes that the heuristic could not work dropped to 10%.
After another manual analysis, we found out a few prob-lems, such as polymorphic invocations, or even branches that are never executed: without actually running the code, it is hard to identify them. Also, we could see that our approach was right only when the class was highly tested (i.e. contained a lot of tests for each method) or not tested at all (i.e. their coverage was zero). On the other hand, the approach was not able to correctly calculate the coverage on classes that had from 30% to 70% coverage (i.e. contained a few methods that were tested and others that were not).
Although our tool implementation has problems, we do not think they affect our general results. As we observed more
Fig. 3: The distribution of the difference in our Attempt #4
than 2,700 classes, we believe that inner classes and method overloading are not frequently used, and thus, they would not affect the general result. Even after all the improvements in the heuristic that we reported, the numbers were very similar. Therefore, we believe that it is the heuristic needs to be enhanced, and not the tool.
To sum up, we do not think that our approach is ready to be used. It gives bad estimates in around 50% of the cases. Currently, we suggest researchers that need to use code coverage in their studies, to select projects with a well-defined build system.Projects that use Maven are good candidates. Because of Maven’s configuration conventions, all projects tend to have similar tasks to clean, compile, execute tests, and execute the code coverage tool. That is why we selected them to be part of this study in the first place: Apache’s projects uses Maven and they follow the same conventions.
VII. THREATS TOVALIDITY
Some of the problems belong to the proposed heuristic, and some of them to our implementation. We listed them below, grouping them by ”tool” or ”heuristic”.
Problems with the tool
1) Inner classes. They mislead our implementation, as the cyclomatic complexity of the outer class should increase. However, it would be necessary to have a more complex implementation to correctly identify them.
2) Method overload. When a method has many over-loads with the same number of parameters, the tool does not know exactly which one was invoked. It would require a more complex analysis of the pa-rameters’ type to identify the right tested method. 3) Helper methods. Some test classes make use of
helper methods, or even inheritance, to encapsulate the invocation of the behavior under test. Because of
that, as the production method is not invoked inside the unit test, these invocations are still not identified. 4) Only supports Java. Our tool only parses Java code. However, we believe that any compiled, statically typed object-oriented language would have the same behavior.
Problems with the heuristic
1) Bad tests. Some tests do not cover all paths in a class, but only the main ones. We have found a few examples in which a single test triggers the maximum quantity of code possible (making all ”ifs” true, all loop conditions true, and so on). Because of that, the line rate calculated by the dynamic tool shows a high code coverage, while our heuristic shows a smaller number.
2) Polymorphic invocations, inheritance, and reflection. When the variable is from an interface type, it is hard to identify which concrete class was executed. Thus, methods that are tested through a polymorphic invocation is not marked as tested.
3) Repeated tests. We saw many different tests that were exercising the same pieces of code in that class. When that happens, our heuristic over estimates the code coverage.
4) Integration tests. Many tests were, in fact, integration tests. It means that a single execution triggers the execution of many classes in runtime. In this case, our heuristic is not able to detect methods that were tested by these kind of tests.
VIII. CONCLUSION ANDFUTUREWORK
Code coverage is an important metric to analyze software maintenance and evolution. However, it is not easy to be calculated in large-scale mining studies, as most tools require compiled code. In this study, we tried to conceive an heuristic to statically calculate code coverage, by relying on McCabe’s cyclomatic complexity number and on number of unit tests per method.
As our numbers show, we do not think that this is a valid, or production-ready, approach. Even with all improvements we have made, it still badly estimates in around 50% of the cases. Based on that, we suggest that researchers that need to use code coverage in their studies, select projects with a well-defined build system, such as Maven.
As a future work, we intend to perform a controlled experiment to determine the cases in which this heuristic works and does not work – currently, we believe that our heuristic can perform better when the test suite contains real isolated unit tests. The results of the experiment may help us improve the heuristic.
ACKNOWLEDGMENTS
We thank Caelum Ensino e Inovac¸˜ao for allowing us to run the study in its environment, as well as supporting the development of the tool. We also thank NAWEB, CNPq, and FAPESP for their financial support. Gustavo has received grant from CNPq under the program Science Without Borders (250071/2013-4) during the development of this work.
REFERENCES
[1] T. L. Alves and J. Visser. Static estimation of test coverage. IEEE International Working Conference on Source Code Analysis and Manip-ulation, 2009.
[2] M. Chen, M. R. Lyu, and W. Wong. An empirical study of the correlation between code coverage and reliability estimation.Proceedings of the 3rd International Software Metrics Symposium, 1996.
[3] F. Del Frate, P. Garg, and et al. On the correlation between code coverage and software reliability. Sixth International Symposium on Software Reliability Engineering, 1995.
[4] S. Elbaum, D. Gable, and G. Rothermel. The impact of software evolution on code coverage information.IEEE International Conference on Software Maintenance, 2001.
[5] A. E. Hassan. The road ahead for mining software repositories. In
Frontiers of Software Maintenance, 2008. FoSM 2008., pages 48–57. IEEE, 2008.
[6] A. E. Hassan and T. Xie. Mining software engineering data. In Pro-ceedings of the 32nd ACM/IEEE International Conference on Software Engineering-Volume 2, pages 503–504. ACM, 2010.
[7] A. E. Hassan and T. Xie. Software intelligence: the future of mining software engineering data. InProceedings of the FSE/SDP workshop on Future of software engineering research, pages 161–166. ACM, 2010.
[8] T. J. McCabe. A complexity measure. In Proceedings of the 2Nd
International Conference on Software Engineering, ICSE ’76, pages 407– , Los Alamitos, CA, USA, 1976. IEEE Computer Society Press. [9] J. Miller and C. J. Maloney. Systematic mistake analysis of digital computer programs. Communications of the ACM, 1963.