201
ALAN GREENSPAN
Greenspan AssociatesThe Crisis
ABSTRACT Geopolitical changes following the end of the Cold War
induced a worldwide decline in real long-term interest rates that, in turn, pro-duced home price bubbles across more than a dozen countries. However, it was the heavy securitization of the U.S. subprime mortgage market from 2003 to 2006 that spawned the toxic assets that triggered the disruptive collapse of the global bubble in 2007–08. Private counterparty risk management and offi-cial regulation failed to set levels of capital and liquidity that would have thwarted financial contagion and assuaged the impact of the crisis. This woe-ful record has energized regulatory reform but also suggests that regulations that require a forecast are likely to fail. Instead, the primary imperative has to be increased regulatory capital, liquidity, and collateral requirements for banks and shadow banks alike. Policies that presume that some institutions are “too big to fail” cannot be allowed to stand. Finally, a range of evidence suggests that monetary policy was not the source of the bubble.
I. Preamble
The bankruptcy of Lehman Brothers in September 2008 precipitated what, in retrospect, is likely to be judged the most virulent global financial crisis ever. To be sure, the contraction in economic activity that followed in its wake has fallen far short of the depression of the 1930s. But a precedent for the virtual withdrawal, on so global a scale, of private short-term credit, the leading edge of financial crisis, is not readily evident in our financial history. The collapse of private counterparty credit surveillance, fine-tuned over so many decades, along with the failure of the global regulatory sys-tem, calls for the thorough review by governments and private risk man-agers now under way.
The central theme of this paper is that in the years leading up to the crisis, financial intermediation tried to function on too thin a layer of capital, owing to a misreading of the degree of risk embedded in ever-more-complex financial products and markets. Section II of the paper reviews the causes of the crisis. In section III the nature of financial intermediation is probed. In section IV a set of reforms is proposed that, I trust, address the shortcomings of the existing regulatory structure. In section V the role of monetary policy in the crisis is examined. I offer some conclusions in section VI.
II. Causes of the Crisis
II.A. The Arbitraged Global Bond Market and the Housing Crisis The global proliferation of securitized, toxic U.S. subprime mortgages was the immediate trigger of the crisis. But the origins of the crisis reach back, as best I can judge, to the aftermath of the Cold War.1The fall of the Berlin Wall exposed the economic ruin produced by the Soviet bloc’s eco-nomic system. In response, competitive markets quietly, but rapidly, dis-placed much of the discredited central planning so prevalent in the Soviet bloc and the then Third World.
A large segment of the erstwhile Third World nations, especially China, replicated the successful export-oriented economic model of the so-called Asian Tigers (Hong Kong, Singapore, South Korea, and Taiwan): fairly well educated, low-cost workforces, joined with developed-world technol-ogy and protected by increasingly widespread adherence to the rule of law, unleashed explosive economic growth.2The International Monetary Fund (IMF) estimated that in 2005 more than 800 million members of the world’s labor force were engaged in export-oriented and therefore compet-itive markets, an increase of 500 million since the fall of the Berlin Wall.3 Additional hundreds of millions became subject to domestic competitive forces, especially in the former Soviet Union. As a consequence, between 2000 and 2007 the real GDP growth rate of the developing world was almost double that of the developed world.
Consumption in the developing world, however, restrained by culture and inadequate consumer finance, could not keep up with the surge of income, and consequently the saving rate of the developing world soared from 24 percent of nominal GDP in 1999 to 34 percent by 2007, far
out-1. For a more detailed explanation see Greenspan (2007, chapter 20).
2. Foreign direct investment in China, for example, rose gradually from 1980 to 1990, but then rose 39-fold by 2007.
stripping its investment rate. With investment elsewhere in the world slow to take up the slack, the result was a pronounced fall from 2000 to 2005 in global long-term interest rates, both nominal (figure 1) and real.
Although the decline in global interest rates indicated, of necessity, that global saving intentions were chronically exceeding global intentions to invest, ex post global saving and investment rates in 2007, overall, were only modestly higher than in 1999, suggesting that the uptrend in the saving intentions of developing economies tempered declining investment intentions in the developed world.4 Of course, whether it was a glut of intended saving or a shortfall of investment intentions, the conclusion is the same: real long-term interest rates had to fall.
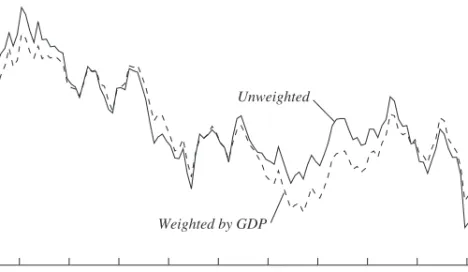
Inflation and long-term interest rates in all developed economies and the major developing economies had by 2006 converged to single digits, I believe for the first time ever. The path of the convergence is evident in the unweighted average variance of interest rates on 10-year sovereign debt of 15 countries: that average declined markedly from 2000 to 2005 (figure 2).5 Percent
Unweighted
Weighted by GDP
Source: Various country sources.
a. The countries are Austria, Belgium, Canada, Denmark, Finland, France, Germany, Italy, the Netherlands,
Norway, Spain, Sweden, Switzerland, the United Kingdom, and the United States.
3.0 1999 2000 2001 2002 2003 2004 2005 2006 2007 2008 2009 3.5 4.0 4.5 5.0 5.5 6.0
Figure 1. Nominal Yields on 10-Year Government Debt, Average for 15 Countries, 1999–2010a
4. That weakened global investment was a major determinant in the decline of global real long-term interest rates was also the conclusion of a March 2007 Bank of Canada study (Desroches and Francis 2007).
Equity and real estate capitalization rates were inevitably arbitraged lower by the fall in global long-term real interest rates. Asset prices, particularly home prices, accordingly moved dramatically higher.
The Economist’s surveys document the remarkable convergence of nearly 20 individual nations’ home price rises during the past decade.6 Japan, Germany, and Switzerland (for differing reasons) were the only important exceptions. U.S. home price gains, at their peak, were no more than the global peak average.7In short, geopolitical events ultimately led to a fall in long-term mortgage interest rates that in turn led, with a lag, to the boom in home prices globally.
II.B. Securitization of Subprimes: The Crisis Story Unfolds
The subprime mortgage market that developed in the 1990s was a small but generally successful market of largely fixed-rate mortgages. It serviced mainly those potential homeowners who could not meet the down payment requirement of a prime loan, but still had income adequate to handle a fixed-rate mortgage.8Only a modest amount had been securitized, but with
Source: Various country sources.
a. Unweighted average for the 15 countries in figure 1.
1999 2000 2001 2002 2003 2004 2005 2006 2007 2008 2009 0.05 0.10 0.15 0.20 0.25 0.30 0.35 0.40 0.45
Figure 2. Variance of Interest Rates: 10-Year Government Debt in 15 Countries, 1999–2010a
6. For example, The Economist,“Finance and Economics: Houses Built on Sand,” Sep-tember 15, 2007, p. 104.
7. IMF, World Economic Outlook,April 2008, chapter 3, p. 113.
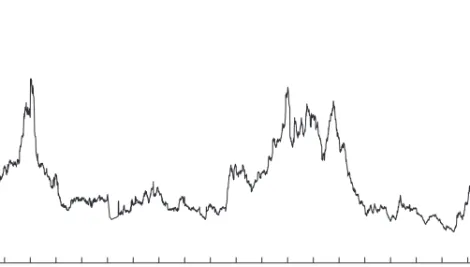
home prices having risen at a quickening pace since 1997 (figure 3), sub-prime lending was seen as increasingly profitable to investors.
Belatedly drawn to this market, financial firms, starting in late 2003, began to accelerate the pooling and packaging of subprime mortgages into securities (figure 4). The firms clearly had found receptive buyers. Heavy
demand from Europe,9in the form of subprime mortgage-backed
collater-alized debt obligations, was fostered by attractive yields and a foreclosure rate on the underlying mortgages that had been in decline for 2 years.
An even heavier demand was driven by the need of Fannie Mae and Freddie Mac, the major U.S. government-sponsored enterprises (GSEs), pressed by the Department of Housing and Urban Development and Figure 3. Monthly Changes in Home Prices, 1976–2010a
Source: Author’s calculations based on data from LoanPerformance and Standard & Poor’s. a. Both series are seasonally adjusted.
1978 1982 1986 1990 1994 1998 2002 2006 –2.0 –1.0 0.0 1.0 2.0 Percent
LoanPerformance Home Price Index, Single-Family Combined
S&P/Case-Shiller Composite 20-City Home Price Index
9. That many of the investors were European was confirmed by the recent heavy losses on U.S. mortgages reported by European investors. Euro-area banks, for example, exhibit a very high ratio of residential mortgage-backed securities write-downs to the residential mortgage loans they hold (IMF, Global Financial Stability Report,October 2009, p. 10). The size of the buildup of subprime securities holdings abroad during the bubble years is unclear. The U.S. Treasury’s annual Foreign Holdings Survey reports that by mid-2006, for-eign investors held $341 billion of privately issued U.S. mortgage-backed securities, some of which were commercial mortgage-backed securities. The less detailed mid-2002 survey reported a total for all asset-backed securities of $169 billion, compared with $594 billion in mid-2006.
Congress to meet expanded “affordable housing goals.”10Given the size of the GSEs’ expanded commitments to fund low- and moderate-income housing, they had few alternatives but to invest, wholesale, in subprime securities. The GSEs accounted for an estimated 42 and 49 percent of all newly purchased subprime mortgage securities (almost all at adjustable interest rates) retained on investors’ balance sheets during 2003 and 2004, respectively (table 1).11That was more than five times their estimated share in 2002.
Increasingly, the extraordinary demand pressed against the limited sup-ply of qualified potential subprime borrowers. To reach beyond this limited population, securitizers unwisely prodded subprime mortgage originators to offer adjustable-rate mortgages (ARMs) with initially lower monthly
pay-Figure 4. Issuance of Subprime Mortgage-Backed Securities, 1995–2010a
Source: Inside Mortgage Finance.
a. Quarterly data, seasonally adjusted.
Billions of dollars 20 1995 1996 1997 1998 1999 2000 2001 2002 2003 2004 2005 2006 2007 2008 2009 40 60 80 100 120
10. In October 2000 HUD finalized a rule “significantly increasing the GSEs’ affordable housing goals” for each year from 2001 to 2003. In November 2004 the annual housing goals for 2005 and beyond were raised still further (Office of Policy Development and Research 2001).
11. Federal Housing Finance Agency, 2008 Annual Report to Congress(revised), His-torical Data Tables 5b, Part 2, and 14b, Part 2 (originally published May 18, 2009, and updated to include a significant reclassification effective September 3, 2009). Before the revision, I estimated the share at less than 30 percent. Data newly reclassified by Fannie Mae account for almost all the revision.
Table 1.
Holdings and Market Shares of Subprime Mortgage-Backed Securities by Fannie Mae and Freddie Mac, 2000–08
F a nnie M a e a nd Freddie M a c sin g le-f a mil y priv a te-l a bel mort gag es ret a ined in t h eir portfolios a C ha n g
e from end of previous
y e a r C ha n g e in tot a l As percent of Tot a l subprime subprime MB S s As percent of c ha n g e in tot a l MB S s outst a ndin g outst a ndin g Billions of tot a l subprime Billions of subprime MB S s Ye a r (billions of doll a rs) (billions of doll a rs) doll a rs MB S s outst a ndin g doll a rs outst a ndin g 2000 88.7 2001 119.0 30.3 19.0 16.0 2002 186.2 67.2 24.7 13.3 5.7 8.5 2003 280.8 94.6 64.9 23.1 40.1 42.4 2004 456.5 175.7 150.6 33.0 85.8 48.8 2005 644.3 187.8 179.2 27.8 28.6 15.2 2006 800.9 156.6 169.0 21.1 − 10.2 − 6.5 2007 774.0 − 26.9 133.4 17.2 − 35.6 132.5 2008 605.4 − 168.6 99.4 16.4 − 34.0 20.1
Sources: Federal Housing Finance Agency,
2008 Report to Con
g
ress
(revised), LoanPerformance data, and author’s calculations.
a. Fannie Mae publishes its subprime securities holdings for each year from 2002 to 2008. For 2001 the sum of subprime and
alt-A holdings is approximately reported, with
the division between them guided by shares of total outstanding subprime and alt-A mortgage-backed securities (MBSs). Freddie M
ac publishes similar data for 2006–08.
With minor assumptions, estimates are made for the sum of subprime and alt-A holdings for earlier years. The separation is made
essentially to reflect the ratio of total
ments. As loan underwriting standards deteriorated rapidly, ARMs soared to nearly 62 percent of first-mortgage subprime originations by the second quarter of 2007.12By 2005 and 2006,13subprime mortgage originations had swelled to a bubbly 20 percent of all U.S. home mortgage originations, almost triple their share in 2002.
By the first quarter of 2007, virtually all subprime mortgage origina-tions were being securitized, compared with less than half in 2000,14 and subprime mortgage securities outstanding totaled more than $800 billion, almost seven times their level at the end of 2001. The securitizers, prof-itably packaging this new source of paper into mortgage pools and armed with what turned out, in retrospect, to be grossly inflated credit ratings, were able to sell seemingly unlimited amounts of these securities into what appeared to be a vast and receptive global market.
II.C. A Classic Euphoric Bubble Takes Hold
As a measure of how far the appetite for risk taking beyond the securi-tized mortgage market had gone, long-sacrosanct debt covenants were eased as a classic euphoric global bubble took hold.15 By 2007, yield spreads in debt markets overall had narrowed to a point where there was little room for further underpricing of risk. Our broadest measure of credit risk, the yield spread of bonds rated CCC or lower and 10-year Treasury notes, fell to a probable record low in the spring of 2007, although only marginally so (figure 5). Almost all market participants of my acquain-tance were aware of the growing risks, but also cognizant that risk had often remained underpriced for years. I had raised the specter of “irrational exuberance” over a decade before (Greenspan 1996), only to watch the dot-com boom, after a one-day stumble, continue to inflate for 4 more years, unrestrained by a cumulative increase of 350 basis points in the fed-eral funds rate from 1994 to 2000. Similarly in 2002, I expressed my con-cerns before the Federal Open Market Committee (FOMC) that “. . . our
12. Data are from the Mortgage Bankers Association (Haver Analytics).
13. We at the Federal Reserve were aware earlier in the decade of incidents of some highly irregular subprime mortgage underwriting practices. But regrettably, we viewed it as a localized problem subject to standard prudential oversight, not the precursor of the securi-tized subprime mortgage bubble that was to arise several years later.
14. Inside Mortgage Finance Publications, The 2009 Mortgage Market Statistical Annual,vol. I, p. 4, and vol. II, p. 13.
15. These covenants are restrictions put on a borrower by a lender that might, for exam-ple, restrict other borrowings, the level of working capital, or debt service cover.
extraordinary housing boom . . . financed by very large increases in mort-gage debt, cannot continue indefinitely.” It lasted until 2006.16
Clearly, with such experiences in mind, financial firms were fearful that should they retrench too soon, they would almost surely lose market share, perhaps irretrievably. Their fears were given expression in Citigroup chair-man and CEO Charles Prince’s now-famous remark in 2007, just before the onset of the crisis: “When the music stops, in terms of liquidity, things will be complicated. But as long as the music is playing, you’ve got to get up and dance. We’re still dancing.”17
The financial firms accepted the risk that they would be unable to antic-ipate the onset of crisis in time to retrench. They believed, however, that the seemingly insatiable demand for their array of exotic financial products would enable them to sell large parts of their portfolios without loss. They
Source: Bank of America Merrill Lynch, Federal Reserve.
a. Average yield on Bank of America Merrill Lynch high-yield cash pay bonds rated CCC and lower minus
yield on 10-year Treasury notes at constant maturity.
Percent 1989 1991 1993 1995 1997 1999 2001 2003 2005 2007 2009 5 10 15 20 25 30 35
Figure 5. Yield Spread of Bonds Rated CCC and Lower over 10-Year Treasury Notes, 1988–2010a
16. The failure to anticipate the length and depth of the emerging bubble should not have come as a surprise. Although we like to pretend otherwise, policymakers, and indeed forecasters in general, are doing exceptionally well if we can get market projections essen-tially right 70 percent of the time. But that means we get them wrong 30 percent of the time. In 181⁄2years at the Federal Reserve, I certainly had my share of the latter.
17. Michiyo Nakamoto and David Wighton, “Citigroup Chief Stays Bullish on Buy-Outs,” Financial Times,July 9, 2007.
were mistaken. They failed to recognize that the conversion of balance sheet liquidity to effective demand is largely a function of the degree of risk aversion.18 That process manifests itself in periods of euphoria (risk aversion falling below its long-term, trendless average) and fear (risk aver-sion rising above its average). A lessening in the intensity of risk averaver-sion creates increasingly narrow bid-asked spreads, in volume—the conven-tional definition of market,as distinct from balance sheet, liquidity.
In this context I define a bubble as a protracted period of falling risk aversion that translates into capitalization rates falling measurably below their long-term, trendless averages.19 Falling capitalization rates in turn propel one or more asset prices to unsustainable levels. All bubbles burst when risk aversion reaches its irreducible minimum, that is, when credit spreads approach zero, although success at timing the onset of the deflation has proved elusive.
Some bubbles burst without severe economic consequences—the dot-com boom and the rapid run-up of stock prices in the spring of 1987, for example. Others burst with severe deflationary consequences. That class of bubbles, as Carmen Reinhart and Kenneth Rogoff (2009) demonstrate, 18. I am defining risk aversion more broadly here than the standard economic definition, which states it in terms of utility over different outcomes. Risk aversion, as I use the term, encompasses all factors that govern individuals’ willingness to engage in risky actions. Most notably, it encompasses not only their preferences toward risk, but also their perceptions of risk.
Risk aversion is the primary human trait that governs the pricing of income-earning assets. When people become uncertain or fearful, they disengage from perceived risk. When their uncertainty declines, they take on new commitments. Risk aversion, by defini-tion, ranges from zero to full.
The extremes of zero and full risk aversion, of course, are outside all human experience. Zero risk aversion—that is, the absence of any aversion at all to engaging in risky actions— implies that an individual does not care about, or cannot discriminate among, objective states of risk to life and limb. Such individuals cannot (or do not choose to) recognize life-threatening events.
To acquire food, shelter, and the other necessary contributors to life requires action, that is, the taking of risks, either by an individual or by others on the individual’s behalf. Eschewing all objective risk is not consistent with life. Thus full risk aversion, like zero risk aversion, is a hypothetical state that is never observed in practice.
Day-by-day existence occurs well within these outer boundaries of risk aversion and can be very approximately measured by credit risk spreads. Credit spreads that very approximately track changing risk aversion exhibit little to no long-term trend. Prime rail-road bonds of the immediate post–Civil War years reflect spreads over U.S. Treasuries that are similar to the post–World War II experience.
19. Yields on long-term Treasuries, a proxy for riskless capitalization rates, are essen-tially trendless. Real yields in recent years are not far from the nominal Treasury bond yields of 1900, when long-term inflation expectations (under the gold standard) were effec-tively zero.
appears to be a function of the degree of leverage in the financial sector, particularly when the maturity of debt is less than the maturity of the assets it funds.
Had the share of financial assets funded by equity been significantly higher in September 2008, it seems unlikely that the deflation of asset prices would have fostered a default contagion much, if at all, beyond that of the dot-com boom. It is instructive in this regard that since the start of the crisis, no unaffiliated hedge fund has defaulted on its debt, despite very large losses that often forced fund liquidation.
II.D. Why Did the Boom Reach Such Heights?
Why did the 2007 bubble reach century-rare euphoria? The answer, I believe, lies with the dot-com bubble, which burst with very little footprint on global GDP and, in the United States, produced the mildest recession in the post–World War II period. The previous U.S. recession, in 1990–91, was the second most shallow. Coupled with the fact that the 1987 stock market crash left no visible impact on GDP, this experience led the Federal Reserve and many a sophisticated investor to believe that future contrac-tions would also prove no worse than a typical postwar recession.
The need for large bank capital buffers appeared increasingly less press-ing in this period of Great Moderation. As late as April 2007, the IMF noted that “global economic risks [have] declined since . . . September 2006. . . . The overall U.S. economy is holding up well . . . [and] the signs elsewhere are very encouraging” (emphasis in original).20 The banking regulations adopted internationally under the Basel Accords did induce a modest increase in capital requirements leading up to the crisis. But the debates in Basel over the pending global capital accord that emerged as Basel II were largely over whether to keep bank capital requirements unchanged or to reduce them. Leverage accordingly ballooned.
It is in such circumstances that we depend on our highly sophisticated global system of financial risk management to contain market breakdowns. How could it have failed on so broad a scale? The paradigm that spawned several Nobel Prize winners in economics—Harry Markowitz, Robert Merton, and Myron Scholes (and Fischer Black, had he lived)—was so thoroughly embraced by academia, central banks, and regulators that by 2006 it had become the core of the global regulatory standards embodied in Basel II. Many quantitative investment firms whose number crunching sought to expose profitable market trading principles were successful so
long as risk aversion moved incrementally (which it did much of the time). But crunching data that covered only the last 2 or 3 decades did not yield a model that could anticipate a crisis.
Mathematical models that calibrate risk, however, are surely better guides to risk management than the “rule of thumb” judgments of a half century ago. To this day it is hard to find fault with the conceptual frame-work of our models, as far as they go. Black and Scholes’ elegant option pricing proof is no less valid today than a decade ago. The risk manage-ment paradigm nonetheless harbored a fatal flaw.
In the growing state of high euphoria, risk managers, the Federal Reserve, and other regulators failed to fully comprehend the underlying size, length, and impact of the negative tail of the distribution of risk out-comes that was about to be revealed as the post-Lehman crisis played out. For decades, with little to no data, most analysts, in my experience, had conjectured a far more limited tail risk. This assumption, arguably, was the major source of the critical risk management system failures.
Only modestly less of a problem was the vast and, in some cases, virtu-ally indecipherable complexity of the broad spectrum of financial products and markets that developed with the advent of sophisticated mathematical techniques to evaluate risk.21 In despair, investment managers subcon-tracted an inordinately large part of their task to the “safe harbor” risk des-ignations of the credit rating agencies. No further judgment was required of investment officers who believed they were effectively held harmless by the judgments of these government-sanctioned rating organizations. But despite their decades of experience, the analysts at the credit rating agen-cies proved no more adept at anticipating the onset of crisis than the invest-ment community at large.
Even with the breakdown of our sophisticated risk management models and the failures of the credit rating agencies, the financial system would have held together had the third bulwark against crisis—our regulatory system—functioned effectively. But under crisis pressure, it too failed. Along with the vast majority of market participants, regulators failed to anticipate the onset of crisis.
The heavily praised U.K. Financial Services Authority was unable to anticipate, and thus to prevent, the bank run that threatened one of that country’s largest commercial banks, Northern Rock. The venerated credit
21. I often maintained that because of this complexity, policymakers had to rely on an international “invisible hand” to bring equilibrium to such undecipherable markets. The high level of market liquidity appeared, erroneously, to confirm that the system was working.
rating agencies bestowed ratings that implied triple-A future smooth sail-ing for many a highly toxic derivative product. The Basel Committee on Banking Supervision, representing regulatory authorities from the world’s major financial systems, promulgated a set of capital rules that failed to foresee the need that arose at the height of the crisis for much larger capi-tal and liquidity buffers. The Federal Deposit Insurance Corporation had noted as recently as the summer of 2006 that “more than 99 percent of all insured institutions met or exceeded the requirements of the highest regu-latory capital standards.”22U.S. commercial and savings banks are exten-sively regulated, and even though for years our 10 to 15 largest banking institutions have had permanently assigned on-site examiners to oversee daily operations, many of these banks still were able to take on toxic assets that brought them to their knees.
III. Financial Intermediation
III.A. The Purpose of FinanceThe ultimate goal of a financial system and its regulation in a market economy is to direct the nation’s saving, plus any saving borrowed from abroad (the current account deficit), toward investments in plant, equip-ment, and human capital that offer the greatest increases in the nation’s output per worker hour. Nonfinancial output per hour, on average, rises when obsolescent facilities (with low output per hour) are replaced with facilities that embody cutting-edge technologies (with high output per hour). This process improves average standards of living for a nation as a whole. In the United States, the evident success of finance in the decades before the crisis in directing scarce savings into real productive capital investments appears to explain the generous compensation that nonfinan-cial market participants had been willing to pay to the domestic producers of financial services.
The share of U.S. gross domestic product accruing as income to finance and insurance, according to the Bureau of Economic Analysis, rose fairly steadily from 2.3 percent in 1947 to 7.9 percent in 2006 (figure 6). Many other global financial centers exhibit similar trends.23Only a small part of the rise in the United States represented an increase in net foreign demand
22. FDIC Quarterly BankingProfile,2nd Quarter 2006, p. 3.
23. Increased, but less pronouncedly so, financial shares are evident in the United King-dom, the Netherlands, Japan, Korea, and Australia, among others. The world’s most rapidly expanding (and increasingly market-oriented) economy, China, reports a rise in financial intermediaries’ share of GDP from 1.6 percent in 1980 to 5.4 percent in 2008.
for U.S. financial and insurance services.24 The decline in the share to 7.4 percent in 2008 reflects write-offs of savings previously presumed to be productively employed.25
Given the historic breakdown of the last 2 years, did nonfinancial market participants over the decades misread the efficiency of finance and inappropriately compensate this small segment of our economy? The prevalence of so many financial product failures certainly suggests so, for the decade leading up to the crisis. Nonetheless, it is difficult to make the same judgment in the face of the fairly persistent rise of finance’s share for the previous half century. Moreover, finance’s share of growthin nominal GDP has been largely trendless since 1990, averaging about 10 percent (figure 6).
The proportion of nonfarm employment accounted for by finance and insurance since 1947 has risen far less than the share of gross income originating in that sector, implying a significant upgrading of the skills attracted to finance and their compensation. A recent study (Philippon and Reshef 2009) finds a markedly above-average rise in the salaries of those
Source: Bureau of Economic Analysis.
a. Three-year moving averages.
Percent Percent 2 4 6 8 10 12 14 Change in finance and insurance value added as share of change innominal GDP (right scale)a
Share of finance and insurance innominal GDP (left scale) 2 3 4 5 6 7 8 2006 2002 1998 1994 1990 1986 1982 1978 1974 1970 1966 1962
Figure 6. Share of the Financial Sector in GDP, 1960–2008
24. The net foreign demand for U.S. financial services has grown significantly but has been largely offset by net imports of insurance services.
25. The share of national income originating in a somewhat broadened measure of finance was little changed in 2009 from 2008.
employed in finance since 1980, presumably reflecting the greater skills drawn to finance in recent years. By 2007 a quarter of all graduates of the venerable California Institute of Technology were entering finance.26
What are we to make of these extraordinarily persistent and stable uptrends? Are they wholly accidental? (After all, there is no evidence of such a trend in the prewar years.) It is not that the value of assets to be managed has been persistently rising relative to GDP.27The answer to this question matters a great deal.
In the context of financial reform, the critical issue that must be addressed is whether the growing share of financial services was happen-stance, or evidence that a growing share of financial services was required to intermediate an ever more complex division of labor. I raise the issue because many recent policy recommendations would lower the share of financial services income in GDP. Would such policies affect the growth of U.S. nonfinancial productivity and our standards of living? More impor-tant, given the recent failures of risk management and regulation, would increased financial regulation at this time thwart or (through increased sta-bility) enhance economic growth? We need a far deeper understanding of the role of financial intermediation in promoting growth to answer that question. How finance evolves in the postcrisis years should bring clarity to many of today’s uncertainties.
III.B. Risky Financial Intermediation
As I noted earlier, the shape of the distribution of the extreme negative tail risk was unknown before the default of Lehman. Since tail risk, in prin-ciple at least, is open-ended,28there will always be somerisk that bank cap-ital cannot cover, and hence some, perhaps even many, banks will fail. But that need not become a systemic problem if equity capital and liquidity requirements are raised substantially and a significant part of an intermedi-ary’s debt takes the form of mandated contingent capital bonds (see section IV.F). Still, there will always be the possibility, however remote, of the private financial intermediary system faltering, requiring sovereign credit to keep vital intermediation functioning.
26. The Economist,“Number-Crunchers Crunched,” February 13, 2010, p. 568. 27. Household net worth can be taken as a proxy for the net worth of the economy to be managed at a fee. The ratio of that net worth to disposable personal income was largely unchanged between 1952 and 1996. Since then it has been volatile, with recent quarters returning to the long-term average.
28. Tail risk would converge to zero only if risk aversion were to become absolute, an impossibility if life is to be sustained (see note 18).
Central bankers have long been aware of the potential for a breakdown in private financial markets. Indeed, in the United States as recently as 1991, in contemplation of the unthinkable and at the urging of the Federal Reserve Board of Governors, Section 13-3 of the Federal Reserve Act was reconsidered and amended by Congress. The section as revised grants virtually unlimited authority to the Board to lend in “unusual and exigent circumstances.”
III.C. The Hundred-Year Flood
A decade ago, addressing that issue, I noted,
There is a . . . difficult problem of risk management that central bankers confront every day, whether we explicitly acknowledge it or not: How much of the underlying risk in a financial system should be shouldered [solely] by banks and other financial institu-tions? . . . [Central banks] have all chosen implicitly, if not in a more overt fashion, to set our capital and other reserve standards for banks to guard against outcomes that exclude those once or twice in a century crises that threaten the stability of our domes-tic and international financial systems.
I do not believe any central bank explicitly makes this calculation. But we have cho-sen capital standards that by any stretch of the imagination cannot protect against all potential adverse loss outcomes. There is implicit in this exercise the admission that, in certain episodes, problems at commercial banks and other financial institutions, when their risk-management systems prove inadequate, will be handled by central banks. At the same time, society on the whole should require that we set this bar very high. Hundred-year floods come only once every hundred Hundred-years. Financial institutions should expect to look to the central bank only in extremely rare situations. (Greenspan 2000a)
At issue is whether the crisis that arrived a few years later is that “hundred-year flood.” At best, once-in-a-century observations yield results that are scarcely robust. But recent evidence suggests that what happened in the wake of the Lehman collapse is likely the most severe global finan-cial crisis ever. In the Great Depression, of course, the collapse in eco-nomic output and the rise in unemployment and destitution far exceeded the current and, in the view of most, prospective future state of the global economy. And of course, the widespread bank failures markedly reduced short-term credit availability. But short-term financial markets continued to function.
Financial crises are characterized by a progressive inability to float first long-term debt and eventually short-term and overnight debt as well. Long-term uncertainty and therefore risk are always greater than near-term risk, and hence risk spreads almost always increase with the maturity of the financial instrument in question.29 The depth of a financial crisis is 29. Yields on riskless longer maturities can fall below short-term riskless rates if tight money persuades investors that future inflation will be less.
properly measured by the degree of collapse in the availability of short-term credit.
The evaporation of the global supply of short-term credits within hours or days of the Lehman failure is, I believe, without historical precedent. A run on money market mutual funds, heretofore perceived to be close to riskless, was under way within hours of the announcement of Lehman’s default.30 Within days, the withdrawal of trade credit set off a spiral of global economic contraction, and the Federal Reserve had to move quickly to support the failing commercial paper market. Even the almost sacro-sanct, fully collateralized repurchase agreement market encountered severe and unprecedented difficulties.
One has to dig very deep into peacetime financial history to uncover similar episodes. The market for call money, the key short-term financing vehicle of a century ago, shut down at the peak of the 1907 panic, “when no call money was offered at all for one day and the [bid] rate rose from 1 to 125%” (Homer and Sylla 1991, p. 340). Even at the height of the 1929 stock market crisis, the call money market functioned, although annual interest rates did soar to 20 percent. In lesser financial crises, availability of funds in the long-term market disappeared, but overnight and other short-term markets continued to function.
The withdrawal of overnight money represents financial stringency at its maximum. Investors will be willing to lend overnight before they feel sufficiently protected by adequate capital to reach out for more distant, and hence riskier, maturities.
The evaporation in September 2008 of short-term credits was global and all encompassing. But it was the same process we had previously observed at a more micro level.31
IV. Regulatory Reform
IV.A. Principles of ReformGiven this apparently unprecedented period of turmoil, by what stan-dard should proposals for reform of official supervision and regulation be judged? I know of no form of economic organization based on a division 30. Hugo Bänziger, “Money Market Funds Need New Global Standards,” Financial Times,November 5, 2009. Bänziger was chief risk officer at Deutsche Bank at the time.
31. As the credit of New York City, for example, became suspect in the mid-1970s, the first failure of issuance was evident in long-term municipal bonds, followed by failures in progressively shorter maturities, until even overnight markets started to crumble. A similar progression led up to the Mexican financial crisis of 1994–95.
of labor, from unfettered laissez-faire to oppressive central planning, that has succeeded in achieving both maximum sustainable economic growth and permanent stability. Central planning certainly failed, and I strongly doubt that stability is achievable in capitalist economies, given that always-turbulent competitive markets are continuously being drawn toward, but never quite achieving, equilibrium (and that it is precisely this process that leads to economic growth).
People acting without forethought cannot be productive except by chance. Identification of effective innovation is, of necessity, a rational act. Hence, regulation, by inhibiting irrational behavior when it can be identified, can be stabilizing, as recent history has demonstrated. But there is an inevitable cost of regulation in terms of economic growth and standards of living when it imposes restraints beyond containing unproduc-tive behavior.
Regulation by its nature imposes restraints on competitive markets. The elusive point of balance between growth and stability has always been a point of contention, especially when it comes to financial regulation.
Throughout the postwar years in the United States, with the exception of a limited number of bank bailouts (Continental Illinois in 1984, for example), private capital proved adequate to cover virtually all provi-sions for lending losses. As a consequence, there was never a definitive test of what then constituted conventional wisdom, namely, that an equity capital–to–assets ratio of 6 to 10 percent on average, the range that pre-vailed between 1946 and 2003, was adequate to support the U.S. banking system.
Risk managers’ assumption of the size of the negative tail of the distri-bution of credit and interest rate risk was, as I noted earlier, of necessity conjectural, and for generations we never had to test those conjectures. Most of the shape of the distribution of perceived risk was thoroughly doc-umented in the precrisis years, as “moderate” financial crises and eupho-rias traced out their relevant parts of the curve. But since modern financial data compilation began, we had never had a “hundred-year flood” that exposed the full intensity of negative tail risk.
Risk managers, of course, knew in earlier decades that an assumption of normality in the distribution of risk was unrealistic, but as a first approximation that greatly facilitated calculation, it prevailed. The mathematics implied by fat tails was also well understood, but our num-ber crunching capabilities fell far short of making the required calcu-lations to guide actions, except at prohibitive cost. That is no longer the case.
Clearly what we experienced in the weeks following the Lehman default is exactly the type of market seizure that tail risk conjecture was supposed to capture, and did not. Having experienced Lehman, risk managers will be far more cautious in evaluating future risk—at least for a while.
Many investment firms are constructing probability distributions of out-comes employing, as the negative tail, data based on the experience of the last 2 years. Using Monte Carlo simulations or other techniques, they have concluded, not unexpectedly, that a financial crisis as severe as the one that followed the Lehman default would have been predicted to occur far more often than indicated by models in which risk is distributed normally. Such evidence suggests the onset of a “hundred-year flood” somewhat more often than once in a century.
Indeed, the aftermath of the Lehman crisis traced out a startlingly larger negative tail than almost anybody had earlier imagined. At least partly responsible may have been the failure of risk managers to fully under-stand the impact of the emergence of shadow banking, a development that increased financial innovation but, as a result, also increased the level of risk. The added risk was not compensated by higher capital.
When risk premiums are low over a protracted period, as they were, for example, from 1993 to 1998 and from 2003 to 2007, investors’ willingness to bid for all types of financial assets, especially the high-risk tranches of collateralized debt obligations, creates an illusion of permanent market liquidity that in the latest episode turned out to be intoxicating. It led several major investment banks to attempt to weather the financial storm with only a thin veneer of tangible capital.
The most pressing reform, in my judgment, in the aftermath of the crisis is to fix the level of regulatory risk-adjusted capital, liquidity, and collat-eral standards required by counterparties. Private market participants are now requiring economic capital and balance sheet liquidity well in excess of the yet-to-be-amended Basel II requirements. The shadow banks that survived the crisis are now having to meet significantly tighter market standards, with respect to capital, liquidity, and collateral, than existed before the crisis. These are major changes that need to be reflected in the new set of regulatory requirements and standards currently undergoing global review.
One major fallout of the crisis is a marked rise in the degree of moral hazard (see note 41), which requires that all financial intermediaries be subject to maximum leverage ratios. These ratios, as with all risk-adjusted capital adequacy measures, need to be based on more realistic risk adjust-ment factors applied to their assets and on the proportion of their liabilities
funded with overnight or other short-term debt. Precrisis regulatory capital requirements, although based on decades of experience, were clearly too lax: for example, they erroneously designated pools of self-amortizing home mortgages as among the safest of private instruments. And a surpris-ingly and unfortunately large proportion of investment portfolio decisions were, by law, accorded “safe harbor” status if they adhered to the credit risk judgments (or rather, misjudgments) of the credit rating agencies.
To ensure that financial intermediaries have adequate cash to meet ongoing commitments in the event of a shutdown in external funding, international bank liquidity regulation should match the tightening already evident in private risk management paradigms (Basel Committee on Bank-ing Supervision 2009). Collateral has shown itself particularly subject to rapid recapture. Bear Stearns had nearly $20 billion in pledgeable liquid funds a week before it collapsed. Morgan Stanley lost more than a half tril-lion dollars of pledgeable collateral during the height of the crisis. In the United States, to lower the risk of a “run on the broker,” the amount of cus-tomer assets (collateral) held by broker-dealers that cannot be commingled with their own assets needs to be increased. That would decrease the amount of funds that can “run.” However, such action must be measured and coordinated with other global regulators to avoid regulatory arbitrage (see French and others forthcoming).
Unaffiliated hedge funds have weathered the crisis—as extreme a real-life stress test as one can construct—without taxpayer assistance or, as I noted earlier, default. Although hedge funds are only lightly regulated, much of their leveraged funding comes from more heavily regulated banks. Moreover, as Sebastian Mallaby (2010) writes, “Most hedge funds make money by driving prices awayfrom extremes and toward their ratio-nal level.” In so doing, they supply much-needed liquidity to financial markets when other competitors have withdrawn. Regulations that inhibit the ability of hedge funds to supply such services are counterproductive.
Capital, liquidity, and collateral, in my experience, address almost all of the financial regulatory structure shortcomings exposed by the onset of the crisis. In retrospect, there has to be a level of capital that would have pre-vented the failure of, for example, Bear Stearns and Lehman Brothers. (If not 10 percent, think 40 percent.) Moreover, generic capital has the regu-latory advantage of not having to forecast which particular financial prod-ucts are about to turn toxic. Certainly investors did not foresee the future of subprime securities or the myriad other broken products. Adequate capital eliminates the need for an unachievable specificity in regulatory fine tuning.
The jerry-built regulatory structure that has evolved over the decades in the United States has become much too complex. Policymakers failed to recognize, during the debates that led to legislation resulting in a badly needed opening up of financial competition (the Gramm-Leach-Bliley Act of 1999), that increased competition, especially through shadow banking, also increased negative tail risk. And increased negative tail risk necessi-tates higher capital requirements.
IV.B. Upward Revisions of Bank Economic Capital
How much capital is currently being required of financial institutions by their counterparties will strongly influence the upcoming revisions in reg -ulatorycapital requirements. It is too soon to have definitive answers. But very rough approximations for U.S. commercial banks can be inferred from the response of bank credit default swaps (CDSs), a measure of bank insolvency risk, to postcrisis events.32 Movements in the CDS market should also give us some direct insight into when the banking system is perceived to have overcome the market’s fear of widespread insolvency— and beyond that, to when markets perceive that banks will feel sufficiently secure to return to the free lending of the precrisis years.
Starting late in 2008 and accelerating into the first quarter of 2009, the U.S. Treasury, through its Troubled Asset Relief Program (TARP), added $250 billion to bank equity, the equivalent of adding approximately 2 per-centage points to the equity capital-to-assets ratio. Its impact was impor-tant and immediate.
As the financial crisis took hold and deepened, the unweighted average price of 5-year CDSs of six major U.S. banks—Bank of America, JP Morgan, Citigroup, Goldman Sachs, Wells Fargo, and Morgan Stanley— rose from 17 basis points in early 2007 (for 5-year contracts, the average annual price of insurance was 0.17 percent of the notional amount of the underlying swap instruments) to 170 basis points just before the Lehman default on September 15, 2008. In response to the Lehman default, the 5-year CDS average price rose to more than 400 basis points by October 8. On the day the TARP was announced (October 14), the price fell to approximately 200 basis points, or essentially by half (figure 7). That a 2-percentage-point addition to the banks’ book equity capital-to-assets
32. The seller of a CDS insures the holder of a particular debt instrument against loss in the event of default. Prices of CDSs are thus the most sensitive measure of the probability of bank default.
ratio reversed roughly half the crisis surge in the price of 5-year CDSs implies an overall additional 4-percentage-point rise (from 10 percent in mid-2007 to 14 percent) in the equity capital cushion required by market participants to fund the liabilities of banks. That, of course, assumes linear extrapolation, an admittedly herculean assumption, and, of course, pre-sumes that the probability of a TARP before the Lehman default was de minimis. The abruptness of the market reaction to the TARP announce-ment appears to confirm such a presumption, however.
Current book equity–to–assets ratios are still far from 14 percent. The average ratio for commercial banks (as reported by the Federal Deposit Insurance Corporation, FDIC) was 10.9 percent on March 31, 2010, com-pared with 10.1 percent in mid-2007. But unacknowledged loan losses were estimated by the IMF last October (they are now less) to be in the hundreds of billions of dollars. Trends in relevant liquidity are less readily measured but are assumed to parallel changes in capital.
That banks still have more equity capital to add is also indicated by the fact that the 5-year CDS price of March 31, 2010 (and since) remains over 100 basis points, still significantly elevated relative to the 17 basis points that prevailed in early 2007, when 10 percent capital was apparently
Source: Author’s calculations; Bloomberg.
a. Unweighted average prices of CDSs issued by Bank of America, Citigroup, Goldman Sachs, JPMorgan,
Wells Fargo, and Morgan Stanley.
b. Hundredths of a percent of the notional value of the underlying swap contract.
Basis pointsb 50 100 150 2007 2008 2009 2010 200 250 300 350 400
enough to virtually eliminate the threat of default and induce loan officers to lend freely.
There is little doubt that the TARP’s cash injection markedly reduced the fear of bank default through early 2009. More difficult to judge is the impact on bank CDSs of the dramatic increase in bank equity at market value relative to bank assets at market value. That ratio rose 4.5 percentage points from the end of March 2009 to the end of December, from 7.4 per-cent to 11.9 perper-cent (figure 8). There can be little doubt that this has mate-rially increased the solvency of banks, although apparently less effectively, dollar for dollar, than the more permanent change in book-value equity.33
Much of the repayment of TARP investments to the U.S. Treasury was doubtless financed by new equity issuance, made possible by a more than one-half-trillion dollar increase in U.S. commercial bank equity at market value, and by borrowings made much easier (and cheaper) by the increased equity buffer engendered by gains in market-valued bank equity. The parceling of relative contributions of the TARP and of capital gains to bank solvency and willingness to lend may not be fully clear even in retrospect.
Source: Federal Deposit Insurance Corporation.
a. Averages constructed from Bloomberg data on the book and market equity value of 24 leading banks.
Percent 8 10 12 14 16 18 20 2009 2008 2007 2006 2005 At market valuea At bookvalue
Figure 8. Equity-to-Assets Ratios at FDIC-Insured Commercial Banks, 2004–09
33. Between the end of March and the end of December 2009, the average CDS price fell from 369 to 104 basis points, while the ratio of the market value of equity to the market value of assets rose 450 basis points.
The TARP not only inserted capital but also induced market partici-pants to infer that the U.S. Treasury would, at least for a while, stand behind the liabilities of the banking system. This may explain the diver-gence since mid-September 2009 between short-term (1- and 3-month) LIBOR-OIS spreads (an alternative to CDS spreads as a short-term mea-sure of the likelihood of bank default) and 5- and 10-year CDS spreads. Short-term LIBOR-OIS spreads had returned to their precrisis level by the end of September 2009. Long-maturity CDS prices are only partway back (table 2). The 1-year LIBOR-OIS spread falls in between. Clearly, either markets are discounting some of the bank capital cushion at market value 5 and 10 years hence, owing to the volatility of stock prices, and/or they question the political willingness, or ability, of the U.S. government, after markets return to normal, to initiate another bank bailout.34
Given the foregoing set of fragile assumptions and conclusions (and they are all we have), I would judge that regulatory equity capital require-ments in the end will be seen to have risen from the 10 percent precrisis level (in terms of book value) to 13 or 14 percent by 2012, and liquidity and collateral requirements will toughen commensurately.
IV.C. What Regulation Can Do
What, in my experience, supervision and examination cando as a back-up to capital requirements and counterparty surveillance is promulgate
Table 2. CDS and LIBOR-OIS Spreads at Various Maturities, September 2009 and March 2010 Basis points Maturity September 15, 2009 March 31, 2010 CDS 10 years 129 111 5 years 125 107 3 years 129 88 1 year 123 61 LIBOR-OIS 3 months 12 11 1 month 7 8
Sources: British Bankers’ Association, Bloomberg, Reuters, and Haver Analytics.
34. As fear of contagion from the European sovereign debt crisis mounted in the spring of 2010, CDS and LIBOR-OIS spreads rose markedly.
rules that are preventative and do not require anticipatingan uncertain future.Supervision
—can audit and enforce capital and liquidity requirements35
—can require that financial institutions issue some debt that will become equity should equity capital become impaired (see section IV.F)
—can, and has, put limits or prohibitions on certain types of concen-trated bank lending
—can prohibit complex affiliate and subsidiary structures whose sole purpose is tax avoidance or regulatory arbitrage
—can inhibit the reconsolidation of affiliates previously sold to investors, especially structured investment vehicles (SIVs)36
—can require “living wills” in which financial intermediaries indicate, on an ongoing basis, how they can be liquidated expeditiously with mini-mum impact on counterparties and markets.
IV.D. Some Lessons of Regulatory Capital History
In the late 19th century, U.S. banks required equity capital of 30 per-cent of assets to attract the liabilities required to fund their assets. In the pre–Civil War period, that figure topped 50 percent (figure 9). Given the rudimentary nature of 19th-century payment systems and the poor geo-graphical distribution of reserves in what was then an agricultural econ-omy, competition for bank credit was largely local. It enabled national banks on average to obtain returns (net income) on their assets of well over 200 basis points in the late 1880s, and probably more than 300 basis points in the 1870s (compared with 70 basis points a century later).
Increasing efficiency of financial intermediation, owing to consolidation of reserves and improvements in payment systems, exerted competitive pressure on profit spreads to narrow and allowed capital-to-assets ratios to decline. In marked contrast, the annual average net income rate of return on equitywas amazingly stable, rarely falling outside a range of 5 to 10 per-cent, measured annually, during the century from 1869 to 1966 (figure 10). That meant that net income as a percentage of assets and the degree of leverage were approximately inversely proportional during that century.
35. Increased capital requirements can go a long way toward containing large compen-sation packages. The recent higher profits will be needed to fulfill the capital requirements, especially if global competitors have similar capital requirements.
36. When, during the crisis, such assets appeared about to fail, sponsoring companies, fearful of reputation risk (a new insight?), reabsorbed legally detached affiliates at subse-quent great loss.
Source: Federal Deposit Insurance Corporation and Office of the Comptroller of the Currency. Percent All commercial banks National banks –10 –5 0 5 10 15 2000 1990 1980 1970 1960 1950 1940 1930 1920 1910 1900 1890 1880 1870
Figure 10. Ratio of Net Income to Equity in the Banking Sector, 1869–2007
Source: Federal Deposit Insurance Corporation and Office of the Comptroller of the Currency.
Percent State banks All commercial banks National banks 10 20 30 40 50 2000 1980 1960 1940 1920 1900 1880 1860 1840
Rates of return on assets and equity (despite the decline in leverage that resulted from rising Basel capital requirements) moved modestly higher during 1966–82 owing to a rapid expansion in noninterest income, for example from fiduciary activities, service charges and fees, and securitiza-tions (and later from expansion into investment banking and brokerage). Noninterest income rose significantly between 1982 and 2006, increasing net income to nearly 15 percent of equity, as a consequence of a marked increase in the scope of bank powers. That increase in part reflected the emergence in April 1987 of court-sanctioned and Federal Reserve– regulated “Section 20” investment banking affiliates of bank holding com-panies.37The transfer of such business is clearly visible in the acceleration of gross income originating in commercial banking relative to that in investment banking starting in 2000 (Bureau of Economic Analysis).38
I tentatively conclude that the historical relative stability of average net income–to–equity ratios dating back to the post–Civil War years reflects an underlying ex ante market-determined rate of return on intermediation.
In summary, the crisis will leave in its wake a significantly higher capital-to-assets ratio requirement, both economic and regulatory, that must be reached if intermediation is to be restored to the point where banks and other financial institutions are confident they have a sufficiently secure capital cushion to lend freely.
IV.E. Limits to Regulatory Capital Requirements
If we accept as a benchmark the remarkable stability of the ratio of bank net income to equity capital (ranging between 5 and 15 percent) that has prevailed, with rare exceptions, since the end of the Civil War (figure 10), we can infer the highest average ratio of capital to assets that a banking system can tolerate before a significant number of banks are required to raise their margin, or shrink their size, or both. I assume a 5 percent annual
37. This development meant that the repeal, under the Gramm-Leach-Bliley Act, of the 1933 Glass-Steagall Act, which had separated commercial and investment banking, changed very little. From the enactment of Gramm-Leach-Bliley in 1999 to the Federal Reserve’s acceptance of Goldman Sachs and Morgan Stanley as financial services holding companies at the height of the crisis, no applications to employ the greater powers were forthcoming. That forbearance apparently reflected a desire to stay clear of the Federal Reserve’s regula-tory embrace.
38. Rates of return crashed during the first half of 2009, with declines matched (on an annual basis) only by those in the depression years 1932–34. Both cases reflected a rare sharp breakout from the historical range, resulting mostly from large write-offs on previ-ously extended loans.
average rate of return (the lower limit of the range) as a proxy for the full distribution of the thousands of banks that would make up the average. Accordingly, for this exercise it is employed as the ex ante competitively required average minimum return on intermediation. I assume as a first approximation that all variables are independent. If so, the highestratio of capital to assets that the U.S. banking system can tolerate and still supply the nonfinancial sector with adequate financial service capacity can be inferred from the following identity:
where πis net income, Cis equity capital, and Ais total assets. If π/C= 0.05, then
It can be shown that π/A=(rr−rp−k)w+n−e− α, where rris the rate of interest received from earning assets, rpis the interest rate paid on earn-ing assets, kis the ratio of losses to earning assets, wis the ratio of earning assets to total assets, nis the ratio of noninterest income to assets, eis the ratio of noninterest expense to total assets, and αis the ratio of taxes and minor other adjustments to total assets. As can be seen from table 3, virtu-ally all of the rise in π/Aand π/Cfor U.S. banks as a group since 1982 is due to the marked rise in noninterest income.
In the years immediately before the onset of the crisis, π/A averaged 0.012, and therefore the inferred maximum average regulatory capital, C/A,as a first approximation, was 0.24. A rate higher than 0.24, all else equal,39would put the average rate of return on equity below the critical 5 percent level. If π/A were to revert back to its average for 1950–75 (0.0074), then C/A=0.15, marginally above the 12 to 14 percent presumed market-determined capital requirement that would induce banks to lend freely.
These calculations, as I noted, assume a static model in which all vari-ables are independent. But clearly the required rate of return on equity cannot be independent of the capital-to-assets ratio. Increased capital
C A =20× A π . π π C A A C = × ,
39. I do not deny that all else is not equal, and hence such conclusions are more illus-trative than explanatory. A dynamic model is beyond the scope of this paper. Net interest income has enough of a history to effectively model, but noninterest income arguably does not.
Table 3.
Accounting for Net Income in the U.S. Banking System
Lo a n-loss provisions Interest r a te a nd a lloc a ted tr a nsfer spre a d × s ha re risk divided b y e a rnin g T a xes plus Net income of e a rnin g a ssets × s ha re of Noninterest Noninterest minor items, divided b y a ssets in e a rnin g a ssets in income divided expense divided net, divided b y Level or c ha n g e from tot a l a ssets tot a l a ssets tot a l a ssets b y tot a l a ssets b y tot a l a ssets tot a l a ssets previous period π /A (rr − rp ) × w k × w ne α P eriod a ver ag e 1962–66 0.766 2.580 0.079 0.566 1.965 0.335 1978–82 0.728 3.035 0.265 0.774 2.546 0.269 1992–96 1.092 3.673 0.426 1.949 3.617 0.488 2002–06 1.276 3.048 0.399 2.296 3.106 0.563 C ha n g e From 1962–66 to 1978–82 − 0.038 0.455 0.186 0.207 0.581 − 0.067 From 1978–82 to 1992–96 0.363 0.638 0.161 1.176 1.071 0.219 From 1992–96 to 2002–06 0.184 − 0.624 − 0.027 0.347 − 0.511 0.075
reduces the risk of the balance sheet and hence will attract equity investors despite a lower rate of return. This implies that owing to the recent rise in
π/A,the actual regulatory capital ceiling can thus readily exceed the sta-tic ceiling of C/A =0.24. In any event, increased capital requirements will surely reduce the marginal lending that occurred in recent decades owing to the failure to fully fund tail risk. Much of that marginal lending was in effect being subsidized by taxpayers. That subsidy became fully funded in 2008 by sovereign credit. Removing the subsidy through higher capital requirements will, of course, shrink financial intermediary bal-ance sheets. Much of this lending was evidently nonproductive, and its loss is not apt to be a problem for our complex economy’s required level of intermediation.
IV.F. Too Big to Fail
Beyond significantly increased capital requirements is the necessity of addressing the problem of some financial firms being “too big to fail” or, more appropriately, “too interconnected to be liquidated quickly.” The productive employment of the nation’s scarce saving is threatened when financial firms at the edge of failure are supported with taxpayer funds and designated as systemically important institutions. I agree with Gary Stern, the former president of the Federal Reserve Bank of Min-neapolis, who has long held that “creditors will continue to underprice the risk-taking of these financial institutions, overfund them, and fail to provide effective market discipline. Facing prices that are too low, sys-temically important firms will take on too much risk” (Stern 2009, p. 56). These firms absorb scarce savings that need to be invested in cutting-edge technologies, if output per hour and standards of living are to con-tinue to rise.
After wallowing in the backwaters of economics for years, “too big to fail” has arisen as a major, visible threat to economic growth. It finally became an urgent problem when Fannie Mae and Freddie Mac were placed into conservatorship on September 7, 2008. Before then, U.S. pol-icymakers (with fingers crossed) could point to the fact that Fannie and Freddie, by statute, were not backed by the “full faith and credit of the U.S. government.” Market participants however, did not believe the denial, and they consistently afforded Fannie and Freddie a special credit subsidy (Passmore, Sherlund, and Burgess 2005). On September 7, 2008, market participants were finally vindicated.
Fannie Mae and Freddie Mac need to be split up into smaller compa-nies, none of them “too big to fail,” and then reconstructed into
stand-alone securitizers. Their future solvency (and the threat of contagion) requires that these GSEs be prohibited from accumulating large portfolios of assets that add no useful backing to the process of securitization or the mortgage markets more generally. Those portfolios’ sole purpose is to profit from the subsidy that market participants grant to these GSEs (Greenspan 2004b).
One highly disturbing consequence of the too-big-to-fail problem that has emerged since the September 2008 federal takeover of Fannie Mae and Freddie Mac is that market players will now believe that everysignificant financial institution, should the occasion arise, is subject to being bailed out with taxpayer funds. It is going to be very difficult for legislators to persuade future investors otherwise.
Businesses that are subject to being bailed out have competitive market and cost-of-capital advantages, but not necessarily efficiency advantages, over firms not thought to be systemically important. For years the Federal Reserve was concerned about the ever-growing size of our largest financial institutions. Federal Reserve research had been unable to find economies of scale in banking beyond a modest size (Berger and Humphrey 1994, p. 7; see also Berger 1994). A decade ago, citing such evidence, I noted that “megabanks being formed by growth and consolidation are increas-ingly complex entities that create the potential for unusually large sys-temic risks in the national and international economy should they fail” (Greenspan 1999). Regrettably, we did little to address the problem.
How to deal with systemically threatening institutions is among the major regulatory problems for which there are no good solutions. Early resolution of bank problems under the Federal Deposit Insurance Corpo-ration Improvement Act of 1991 (FDICIA) appeared to have worked with smaller banks during periods of general prosperity. But the notion that risks can be identified in a sufficiently timely manner to enable the liquidation of a large failing bank with minimum loss proved untenable during this crisis, and I suspect will prove untenable in future crises as well.40
The solution that, in my judgment, has at least a reasonable chance of reversing the extraordinarily large “moral hazard” that has arisen over the
40. The FDIC has experienced large losses in the value of assets taken over in resolution during the last 2 years.