A probabilistic approach to semantic representation
Thomas L. Griffiths & Mark Steyvers
{gruffydd,msteyver}@psych.stanford.edu Department of Psychology
Stanford University Stanford, CA 94305-2130 USA
Abstract
Semantic networks produced from human data have statistical properties that cannot be easily captured by spatial representations. We explore a probabilis-tic approach to semanprobabilis-tic representation that explic-itly models the probability with which words occur in different contexts, and hence captures the proba-bilistic relationships between words. We show that this representation has statistical properties consis-tent with the large-scale structure of semantic net-works constructed by humans, and trace the origins of these properties.
Contemporary accounts of semantic representa-tion suggest that we should consider words to be either points in a high-dimensional space (eg. Lan-dauer & Dumais, 1997), or interconnected nodes in a semantic network (eg. Collins & Loftus, 1975). Both of these ways of representing semantic information provide important insights, but also have shortcom-ings. Spatial approaches illustrate the importance of dimensionality reduction and employ simple al-gorithms, but are limited by Euclidean geometry. Semantic networks are less constrained, but their graphical structure lacks a clear interpretation.
In this paper, we view the function of associa-tive semantic memory to be efficient prediction of the concepts likely to occur in a given context. We take a probabilistic approach to this problem, mod-eling documents as expressing information related to a small number of topics (cf. Blei, Ng, & Jordan, 2002). The topics of a language can then be learned from the words that occur in different documents. We illustrate that the large-scale structure of this representation has statistical properties that corre-spond well with those of semantic networks produced by humans, and trace this to the fidelity with which it reproduces the natural statistics of language.
Approaches to semantic representation
Spatial approaches Latent Semantic Analysis
(LSA; Landauer & Dumais, 1997) is a procedure for finding a high-dimensional spatial representation for words. LSA uses singular value decomposition to factorize a word-document co-occurrence matrix. An approximation to the original matrix can be ob-tained by choosing to use less singular values than
its rank. One component of this approximation is a matrix that gives each word a location in a high di-mensional space. Distances in this space are predic-tive in many tasks that require the use of semantic information. Performance is best for approximations that used less singular values than the rank of the matrix, illustrating that reducing the dimensional-ity of the representation can reduce the effects of statistical noise and increase efficiency.
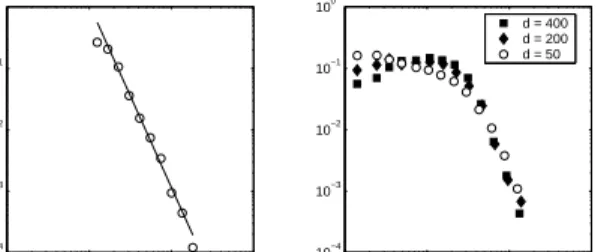
While the methods behind LSA were novel in scale and subject, the suggestion that similarity relates to distance in psychological space has a long history (Shepard, 1957). Critics have argued that human similarity judgments do not satisfy the properties of Euclidean distances, such as symmetry or the tri-angle inequality. Tversky and Hutchinson (1986) pointed out that Euclidean geometry places strong constraints on the number of points to which a par-ticular point can be the nearest neighbor, and that many sets of stimuli violate these constraints. The number of nearest neighbors in similarity judgments has an analogue in semantic representation. Nelson, McEvoy and Schreiber (1999) had people perform a word association task in which they named an as-sociated word in response to a set of target words. Steyvers and Tenenbaum (submitted) noted that the number of unique words produced for each target fol-lows a power law distribution: ifk is the number of words, P(k) ∝kγ. For reasons similar to those of
Tversky and Hutchinson, it is difficult to produce a power law distribution by thresholding cosine or dis-tance in Euclidean space. This is shown in Figure 1. Power law distributions appear linear in log-log co-ordinates. LSA produces curved log-log plots, more consistent with an exponential distribution.
Semantic networks Semantic networks were
pro-posed by Collins and Quillian (1969) as a means of storing semantic knowledge. The original net-works were inheritance hierarchies, but Collins and Loftus (1975) generalized the notion to cover arbi-trary graphical structures. The interpretation of this graphical structure is vague, being based on connect-ing nodes that “activate” one another. Steyvers and Tenenbaum (submitted) constructed a semantic net-work from the word association norms of Nelson et
100 101 102 103 10−4 10−3 10−2 10−1 100
Word association data
k P(k) 100 101 102 103 10−4 10−3 10−2 10−1 100
Latent semantic analysis d = 400 d = 200 d = 50
Figure 1: The left panel shows the distribution of the number of associates named for each target in a word association task. The right shows the distribution of the number of words above a cosine threshold for each target in LSA spaces of dimensiond, where the threshold was chosen to match the empirical mean. al. (1999), connecting words that were produced as responses to one another. In such a semantic net-work, the number of associates of a word becomes the number of edges of a node, termed its “degree”. Steyvers and Tenenbaum found that the resulting graph had the statistical properties of “small world” graphs, of which a power law degree distribution is a feature (Barabasi & Albert, 1999).
The fact that semantic networks can display these properties reflects their flexibility, but there is no in-dication that the same properties would emerge if such a representation were learned rather than con-structed by hand. In the remainder of the paper, we present a probabilistic method for learning a rep-resentation from word-document co-occurences that reproduces some of the large-scale statistical prop-erties of semantic networks constructed by humans.
A probabilistic approach
Anderson’s (1990) rational analysis of memory and categorization takes prediction as the goal of the learner. Analogously, we can view the function of associative semantic memory to be the prediction of which words are likely to arise in a given con-text, ensuring that relevant semantic information is available when needed. Simply tracking how often words occur in different contexts is insufficient for this task, as it gives no grounds for generalization. If we assume that the words that occur in different contexts are drawn from T topics, and each topic can be characterized by a probability distribution over words, then we can model the distribution over words in any one context as a mixture of those top-ics P(wi) = T X j=1 P(wi|zi=j)P(zi=j)
where zi is a latent variable indicating the topic
from which theith word was drawn andP(wi|zi=j)
is the probability of theith word under thejth topic. The words likely to be used in a new context can be determined by estimating the distribution over topics for that context, corresponding toP(zi).
Intuitively, P(w|z=j) indicates which words are important to a topic, whileP(z) is the prevalence of those topics within a document. For example, imagine a world where the only topics of conversa-tion are love and research. In such a world we could capture the probability distribution over words with two topics, one relating to love and the other to re-search. The difference between the topics would be reflected in P(w|z =j): the love topic would give high probability to words like joy, pleasure, or heart, while the research topic would give high probability to words like science, mathematics, or experiment. Whether a particular conversation concerns love, re-search, or the love of research would depend upon the distribution over topics,P(z), for that particu-lar context.
Formally, our data consist of words w =
{w1, . . . , wn}, where each wi belongs to some
doc-umentdi, as in a word-document co-occurrence
ma-trix. For each document we have a multinomial dis-tribution over the T topics, with parameters θ(di),
so for a word in document di, P(zi = j) = θ
(di)
j .
Thejth topic is represented by a multinomial dis-tribution over theW words in the vocabulary, with parameters φ(j), soP(w
i|zi =j) = φ( j)
wi. To make
predictions about new documents, we need to as-sume a prior distribution on the parameters θ(di).
The Dirichlet distribution is conjugate to the multi-nomial, so we take a Dirichlet prior onθ(di).
This probability model is a generative model: it gives a procedure by which documents can be gen-erated. First we pick a distribution over topics from the prior on θ, which determines P(zi) for words
in that document. Each time we want to add a word to the document, we pick a topic according to this distribution, and then pick a word from that topic according toP(wi|zi=j), which is determined
by φ(j). This generative model was introduced by Blei et al. (2002), improving upon Hofmann’s (1999) probabilistic Latent Semantic Indexing (pLSI). Us-ing few topics to represent the probability distribu-tions over words in many documents is a form of dimensionality reduction, and has an elegant geo-metric interpretation (see Hofmann, 1999).
This approach models the frequencies in a word-document co-occurrence matrix as arising from a simple statistical process, and explores the parame-ters of this process. The result is not an explicit rep-resentation of words, but a reprep-resentation that cap-tures the probabilistic relationships among words. This representation is exactly what is required for predicting when words are likely to be used. Be-cause we treat the entries in a word-document co-occurrence matrix as frequencies, the representation developed from this information is sensitive to the natural statistics of language. Using a generative model, in which we articulate the assumptions about how the data were generated, ensures that we are
able to form predictions about which words might be seen in a new document.
Blei et al. (2002) gave an algorithm for finding estimates of φ(j) and the hyperparameters of the
prior on θ(di) that correspond to local maxima of
the likelihood, terming this procedure Latent Dirich-let Allocation (LDA). Here, we use a symmetric Dirichlet(α) prior onθ(di)for all documents, a
sym-metric Dirichlet(β) prior onφ(j) for all topics, and
Markov chain Monte Carlo for inference. An advan-tage of this approach is that we do not need to ex-plicitly represent the model parameters: we can in-tegrate outθandφ, defining model simply in terms of the assignments of words to topics indicated by thezi. 1
Markov chain Monte Carlo is a procedure for ob-taining samples from complicated probability distri-butions, allowing a Markov chain to converge to the target distribution and then drawing samples from the Markov chain (see Gilks, Richardson & Spiegel-halter, 1996). Each state of the chain is an assign-ment of values to the variables being sampled, and transitions between states follow a simple rule. We use Gibbs sampling, where the next state is reached by sequentially sampling all variables from their dis-tribution when conditioned on the current values of all other variables and the data. We will sample only the assignments of words to topics, zi. The
condi-tional posterior distribution forziis given by P(zi=j|z−i,w)∝ n(wi) −i,j+β n(·) −i,j+W β n(di) −i,j+α n(di) −i,·+T α (1)
wherez−iis the assignment of allzksuch thatk6=i,
and n(wi)
−i,j is the number of words assigned to topic
j that are the same aswi,n
(·)
−i,j is the total number
of words assigned to topic j, n(di)
−i,j is the number
of words from documentdi assigned to topicj, and
n(di)
−i,·is the total number of words in documentdi, all
not counting the assignment of the current wordwi.
α, βare free parameters that determine how heavily these empirical distributions are smoothed.
The Monte Carlo algorithm is then straightfor-ward. Theziare initialized to values between 1 and
T, determining the initial state of the Markov chain. The chain is then run for a number of iterations, each time finding a new state by sampling each zi
from the distribution specified by Equation 1. Af-ter enough iAf-terations for the chain to approach the target distribution, the current values of the zi are
recorded. Subsequent samples are taken after an ap-propriate lag, to ensure that their autocorrelation is low. Gibbs sampling is used in each of the following simulations in order to explore the consequences of this probabilistic approach.
1A detailed derivation of the conditional probabilities
used here is given in a technical report available at
http://www-psych.stanford.edu/∼gruffydd/cogsci02/lda.ps
Simulation 1:
Learning topics with Gibbs sampling
The aim of this simulation was to establish the sta-tistical properties of the sampling procedure and to qualitatively assess its results, as well as to demon-strate that complexities of language like polysemy and behavioral asymmetries are naturally captured by our approach. We took a subset of the TASA corpus (Landauer, Foltz, & Laham, 1998), using the 4544 words that occurred both in the word associa-tion norm data and at least 10 times in the complete corpus, together with a random set of 5000 docu-ments. The total number of words occurring in this subset of the corpus, and hence the number ofzi to
be sampled, wasn = 395853. We set the parame-ters of the model so that 150 topics would be found (T = 150), withα= 0.1,β = 0.01.
The initial state of the Markov chain was estab-lished with an online learning procedure. Initially, none of thewi were assigned to topics. Thezi were
then sequentially drawn according to Equation 1 where each of the frequencies involved, as well asW, reflected only the words that had already been as-signed to topics.2 This initialization procedure was
used because it was hoped that it would start the chain at a point close to the true posterior distribu-tion, speeding convergence.
Ten runs of the Markov chain were conducted, each lasting for 2000 iterations. On each iteration we computed the average number of topics to which a word was assigned,hki, which was used to evaluate the sampling procedure for large scale properties of the representation. Specifically, we were concerned about convergence and the autocorrelation between samples. The rate of convergence was assessed using the Gelman-Rubin statistic ˆR, which remained be-low 1.2 after 25 iterations. The autocorrelation was less than 0.1 after a lag of 50 iterations.
A single sample was drawn from the first run of the Markov chain after 2000 iterations. A subset of the 150 topics found by the model are displayed in Table 1, with words in each column corresponding to one topic, and ordered by the frequency with which they were assigned to that topic. The topics displayed are not necessarily the most interpretable found by the model, having been selected only to highlight the way in which polysemy is naturally dealt with by this representation. More than 90 of the 150 topics appeared to have coherent interpretations.3
The word association data of Nelson et al. (1999) contain a number of asymmetries – cases where peo-ple were more likely to produce one word in response to the other. Such asymmetries are hard to
ac-2Random numbers used in all simulations were
gener-ated with the Mersenne Twister, which has an extremely deep period (Matsumoto & Nishimura, 1998).
3The 20 most frequent words in these topics are listed
COLD TREES COLOR FIELD GAME ART BODY KING LAW
WINTER TREE BLUE CURRENT PLAY MUSIC BLOOD GREAT RIGHTS
WEATHER FOREST RED ELECTRIC BALL PLAY HEART SON COURT
WARM LEAVES GREEN ELECTRICITY TEAM PART MUSCLE LORDS LAWS
SUMMER GROUND LIKE TWO PLAYING SING FOOD QUEEN ACT
SUN PINE WHITE FLOW GAMES LIKE OTHER EMPEROR LEGAL
WIND GRASS BROWN WIRE FOOTBALL POETRY BONE OWN STATE
SNOW LONG BLACK SWITCH BASEBALL BAND MADE PALACE PERSON
HOT LEAF YELLOW TURN FIELD WORLD SKIN DAY CASE
CLIMATE CUT LIGHT BULB SPORTS RHYTHM TISSUE PRINCE DECISION
YEAR WALK BRIGHT BATTERY PLAYER POEM MOVE LADY CRIME
RAIN SHORT DARK PATH COACH SONG STOMACH CASTLE IMPORTANT
DAY OAK GRAY CAN LIKE LITERATURE PART ROYAL JUSTICE
SPRING FALL MADE LOAD HIT SAY OXYGEN MAN FREEDOM
LONG GREEN LITTLE LIGHT TENNIS CHARACTER THIN MAGIC ACTION
FALL FEET TURN RADIO SPORT AUDIENCE SYSTEM COURT OWN
HEAT TALL WIDE MOVE BASKETBALL THEATER CHEST HEART SET
ICE GROW SUN LOOP LEAGUE OWN TINY GOLDEN LAWYER
FEW WOODS PURPLE DEVICE FUN KNOWN FORM KNIGHT YEARS
GREAT WOOD PINK DIAGRAM BAT TRAGEDY BEAT GRACE FREE
Table 1: Nine topics from the single sample in Simulation 1. Each column shows 20 words from one topic, ordered by the number of times that word was assigned to the topic. Adjacent columns share at least one word. Shared words are shown in boldface, providing some clear examples of polysemy
count for in spatial representations because distance is symmetric. The generative structure of our model allows us to calculateP(w2|w1), the probability that
the next word seen in a novel context will be w2,
given that the first word was w1. Since this is a
conditional probability, it is inherently asymmetric. The asymmetries inP(w2|w1) predict 77.47% of the
asymmetries in the word association norms of Nel-son et al. (1999), restricted to the 4544 words used in the simulation. These results are driven by word frequency: P(w2) should be close toP(w2|w1), and
77.32% of the asymmetries could be predicted by the frequency of words in this subset of the TASA cor-pus. The slight improvement in performance came from cases where word frequencies were very similar or polysemy made overall frequency a poor indicator of the frequency of a particular sense of a word.
Bipartite semantic networks
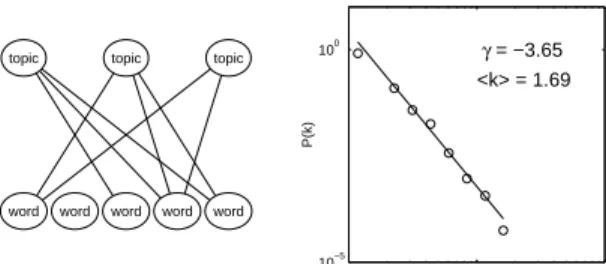
The standard conception of a semantic network is a graph with edges between word nodes. Such a graph is unipartite: there is only one type of node, and those nodes can be interconnected freely. In contrast, bipartite graphs consist of nodes of two types, and only nodes of different types can be con-nected. We can form a bipartite semantic network by introducing a second class of nodes that medi-ate the connections between words. One example of such a network is a thesaurus: words are organized topically, and a bipartite graph can be formed by connecting words to the topics in which they occur, as illustrated in the left panel of Figure 2.
Steyvers and Tenenbaum (submitted) discovered that bipartite semantic networks constructed by hu-mans, such as that corresponding to Roget’s (1911) Thesaurus, share the statistical properties of unipar-tite semantic networks. In particular, the number of topics in which a word occurs, or the degree of that word in the graph, follows a power law distribution as shown in the right panel of Figure 2. This result is reminiscent of Zipf’s (1965) “law of meaning”: the
number of meanings of a word follows a power law distribution. Zipf’s law was established by analyz-ing dictionary entries, but appears to describe the same property of language.
word word word word word topic topic topic
100 101 102 10−5 100 k P(k) γ = −3.65 <k> = 1.69
Figure 2: The left panel shows a bipartite semantic network. The right shows the degree distribution a network constructed from Roget’s Thesaurus.
Our probabilistic approach specifies a probability distribution over the allocation of words to topics. If we form a bipartite graph by connecting words to the topics in which they occur, we obtain a probability distribution over such graphs. The existence of an edge between a word and a topic indicates that the word has some significant probability of occurring in that topic. In the following simulations, we explore whether the distribution over bipartite graphs re-sulting from our approach is consistent with the sta-tistical properties of Roget’s Thesaurus and Zipf’s law of meaning. In particular, we examine whether we obtain structures that have a power law degree distribution.
Simulation 2:
Power law degree distributions
We used Gibbs sampling to obtain samples from the posterior distribution of the zi for two
word-document co-occurrence matrices: the matrix with the 4544 words from the word association norms used in Simulation 1, and a second matrix using
γ = −2.93 <k> = 2.11 Random words, 50 topics
γ = −2.95
<k> = 2.59 Random words, 150 topics
γ = −2.78
<k> = 2.97 Random words, 250 topics
100 101 102 10−5 100 k P(k) γ = −2.47 <k> = 3.33 Norm words, 50 topics
γ = −2.65
<k> = 4.24 Norm words, 150 topics
γ = −2.94
<k> = 4.80 Norm words, 250 topics
γ = −1.88 <k> = 3.43 Initialization γ = −2.55 <k> = 3.68 Random documents γ = −1.90 <k> = 2.19 Constant frequencies γ = −0.70 <k> = 2.22 Constant documents
Figure 3: Degree distributions for networks constructed in Simulations 2 and 3. All are on the same axes. 4544 words drawn at random from those occurring
at least 10 times in the TASA corpus (n= 164401). Both matrices used the same 5000 random docu-ments. For each matrix, 100 samples were taken with T = 50,100,150,200 and 250. Since the re-sults seemed unaffected by the number of topics, we will focus on T = 50,150,250. Ten samples were obtained in each of 10 separate runs with a burn-in of 1000 iterations in which no samples were drawn, and a between-sample lag of 100 iterations.
For each sample, a bipartite semantic network was constructed by connecting words to the topics to which they were assigned. For each network, the degree of each word node was averaged over the 100 samples.4 The resulting distributions were clearly
power-law, as shown in Figure 3. Theγ coefficients remained within a small range and were all close to γ = −3.65 for Roget’s Thesaurus. As is to be expected, the average degree increased as more top-ics were made available, and was generally higher than Roget’s. Semantic networks in which edges are added for each assignment tend to be quite densely connected. Sparser networks can be produced by setting a more conservative threshold for the inclu-sion of an edge, such as multiple assignments of a word to a topic, or exceeding some baseline proba-bility in the distribution represented by that topic.
Our probabilistic approach produces power law degree distributions, in this case indicating that the number of topics to which a word is assigned follows a power law. This result is very similar to the prop-erties of Roget’s Thesaurus and Zipf’s observations about dictionary definitions. This provides an
op-4Since power law distributions can be produced by
av-eraging exponentials, we also inspected individual sam-ples to confirm that they had the same characteristics.
portunity to establish the origin of this distribution, to see whether it is a consequence of the modeling approach or a basic property of language.
Simulation 3:
Origins of the power law
To investigate the origins of the power law, we first established that our initialization procedure was not responsible for our results. Using T = 150 and the matrix with random words, we obtained 100 samples of the degree distribution immediately following ini-tialization. As can be seen in Figure 3, this produced a curved log-log plot and higher values ofγ andhki
than in Simulation 2.
The remaining analyses employed variants of this co-occurrence matrix, and their results are also pre-sented in Figure 3. The first variant kept word fre-quency constant, but assigned instances of words to documents at random, disrupting the co-occurrence structure. Interestingly, this appeared to have only a weak effect on the results, although the curva-ture of the resulting plot did increase. The second variant forced the frequencies of all words to be as close as possible to the median frequency. This was done by dividing all entries in the matrix by the frequency of that word, multiplying by the median frequency, and rounding to the nearest integer. The total number of instances in the resulting matrix was n = 156891. This manipulation reduced the aver-age density in the resulting graph considerably, but the distribution still appeared to follow a power law. The third variant held the number of documents in which a word participated constant. Word frequen-cies were only weakly affected by this manipulation, which spread the instances of each word uniformly over the top five documents in which it occurred
and then rounded up to the nearest integer, giving n= 174615. Five was the median number of docu-ments in which words occurred, and docudocu-ments were chosen at random for words below the median. This manipulation had a strong effect on the degree dis-tribution, which was no longer power law, or even monotonically decreasing.
The distribution of the number of topics in which a word participates was strongly affected by the dis-tribution of the number of documents in which a word occurs. Examination of the latter distribution in the TASA corpus revealed that it follows a power law. Our approach produces a power law degree dis-tribution because it accurately captures the natural statistics of these data, even as it constructs a lower-dimensional representation.
General Discussion
We have taken a probabilistic approach to the prob-lem of semantic representation, motivated by con-sidering the function of associative semantic mem-ory. We assume a generative model where the words that occur in each context are chosen from a small number of topics. This approach produces a lower-dimensional representation of a word-document co-occurrence matrix, and explicitly models the fre-quencies in that matrix as probability distributions. Simulation 1 showed that our approach could ex-tract coherent topics, and naturally deal with issues like polysemy and asymmetries that are hard to ac-count for in spatial representations. In Simulation 2, we showed that this probabilistic approach was also capable of producing representations with a large-scale structure consistent with semantic networks constructed from human data. In particular, the number of topics to which a word was assigned fol-lowed a power law distribution, as in Roget’s (1911) Thesaurus and Zipf’s (1965) law of meaning. In Sim-ulation 3, we discovered that the only manipSim-ulation that would remove the power law was altering the number of documents in which words participate, which follows a power law distribution itself.
Steyvers and Tenenbaum (submitted) suggested that power law distributions in language might be traced to some kind of growth process. Our results indicate that this growth process need not be a part of the learning algorithm, if the algorithm is faith-ful to the statistics of the data. While we were able to establish the origins of the power law distribu-tion in our model, the growth processes described by Steyvers and Tenenbaum might contribute to under-standing the origins of the power law distribution in dictionary meanings, thesaurus topics, and the num-ber of documents in which words participate.
The representation learned by our probabilistic approach is not explicitly a representation of words, in which each word might be described by some set of features. Instead, it is a representation of the prob-abilistic relationships between words, as expressed
by their probabilities of arising in different contexts. We can easily compute important statistical quan-tities from this representation, such as P(w2|w1),
the probability ofw2arising in a particular context
given thatw1 was observed, and more complicated
conditional probabilities. One advantage of an ex-plicitly probabilistic representation is that we gain the opportunity to incorporate this representation into other probabilistic models. In particular, we see great potential for using this kind of represen-tation in understanding the broader phenomena of human memory.
AcknowledgmentsThe authors were supported by a Hackett Studentship and a grant from NTT Communi-cations Sciences laboratory. We thank Tania Lombrozo, Penny Smith and Josh Tenenbaum for comments, and Tom Landauer and Darrell Laham for the TASA corpus. Shawn Cokus wrote the Mersenne Twister code.
References
Anderson, J. R. (1990). The Adaptive Character of Thought. Erlbaum, Hillsdale, NJ.
Barabasi, A. L. & Albert, R. (1999). Emergence of scaling in random networks. Science, 286, 509-512.
Blei, D. M., Ng, A. Y., & Jordan, M. I. (2002). Latent Dirichlet allocation. InAdvances in Neural Information Processing Systems 14.
Collins, A. M. & Loftus, E. F. (1975). A spreading activation theory of semantic processing. Psychological Review, 82, 407-428.
Collins, A. M. & Quillian, M. R. (1969). Retrieval time from semantic memory.Journal of Verbal Learning & Verbal Behavior, 8, 240-248.
Gilks, W., Richardson, S., & Spiegelhalter, D. J. (1996). Markov Chain Monte Carlo in Practice. Chap-man & Hall, Suffolk.
Hofmann, T. (1999). Probablistic latent semantic in-dexing. InProceedings of the Twenty-Second Annual In-ternational SIGIR Conference.
Landauer, T. K. & Dumais, S. T. (1997). A solu-tion to Plato’s problem: The Latent Semantic Analysis theory of acquisition, induction, and representation of knowledge. Psychological Review, 104, 211-240.
Landauer, T. K., Foltz, P. W., & Laham, D. (1998). Introduction to latent semantic analysis. Discourse Pro-cesses, 25, 259-284.
Matsumoto, M. & Nishimura, T. (1998). Mersenne twister: A 623-dimensionally equidistributed uniform pseudorandom number generator. ACM Transactions on Modeling & Computer Simulation, 8, 3-30.
Nelson, D. L., McEvoy, C. L., & Schreiber, T. A. (1999). The University of South Florida word associ-ation norms. http://www.usf.edu/FreeAssociation.
Roget, P. (1911). Roget’s Thesaurus of English Words
and Phrases. Available from Project Gutenberg.
Shepard, R. N. (1957). Stimulus and response gen-eralization: a stochastic model, relating generalization to distance in psychological space. Psychometrika, 22, 325-345.
Steyvers, M. & Tenenbaum, J. B. (submitted). The large-scale structure of semantic networks: Statistical analyses and a model of semantic growth.
Tversky, A. & Hutchinson, J. W. (1986). Nearest neighbor analysis of psychological spaces. Psychological Review, 93, 3-22.
Zipf, G. K. (1965). Human behavior and the principle of least effort. Hafner, New York.