© ICMI/IASE 2008. In C. Batanero, G. Burrill, C. Reading & A. Rossman (Eds.), Joint ICMI/IASE Study: Teaching Statistics in School Mathematics. Challenges for Teaching and Teacher Education. Proceedings of the ICMI Study 18 and 2008 IASE Round Table Conference.
MODELING SCATTERPLOT DATA AND THE SIGNAL-NOISE METAPHOR: TOWARDS STATISTICAL LITERACY FOR PRE-SERVICE TEACHERS
Joachim Engel1, Peter Sedlmeier2 and Claudia Wörn1
1
University of Education, Ludwigsburg, Germany,
2
Chemnitz University of Technology, Germany [email protected]
The idea of data being a mixture of signal and noise is perhaps one of the most fruitful and fundamental ideas of statistics. To enable future mathematics teachers to educate students to become statistically literate, we propose an integrative approach connecting central topics of school mathematics with the signal-noise idea. A course on modeling functional relationships–a core topic in any mathematics curriculum–confronts students with the signal-noise idea when looking at the deviation between model and data. We provide empirical evidence that students of such a course acquire implicitly important statistical thinking skills.
INTRODUCTION
While in primary and secondary schools probability and statistics are part of the mathematics curriculum, it is often pointed out that mathematics teachers frequently lack specific preparation in stochastic education. It is argued that general principles that are valid in areas like arithmetic, geometry or algebra may not apply to probability and statistics anymore (e.g. Gattuso & Pannone, 2002; Batanero, Godino & Roa, 2004). Despite the acknowledged fact that statistics is distinct and different from other areas of mathematics and the implied need to provide mathematics teachers with a special preparation to teach statistics, mathematics and statistics also have very much in common and there are many synergy effects between mathematics and statistics education. The quality of instruction in either field can greatly benefit from each other. Statistics instruction following activity based methods (see, e.g., Scheaffer et al., 1996 or Rossman et al., 2001) may be considered as a paradigm for learning how to apply mathematics. The field of statistics provides ample opportunities to teach important concepts of applied mathematics and modeling (Engel, 2002). In fact, an activity-based statistics course may meet all the major demands that apply to modern mathematics instruction (NCTM, 2000), such as preparing students to:
• represent and analyze real situations;
• solve problems;
• make decisions using mathematical reasoning;
• communicate their thinking;
• make connections.
Vice versa, some core concepts of statistics can well be integrated in a data-based applied mathematics context. A fundamental idea of mathematics is the notion of function. Modeling functional relationships confronts students with finding structure – the underlying function – in data corrupted by noise. A data-based course on modeling scatterplot data contains implicitly important statistical aspects when focusing on the deviation between model and data. Plotting bivariate data, selecting appropriate functional models, fitting curves, drawing and analyzing residual plots: for the training of future teachers these activities help to connect and integrate mathematical and statistical knowledge. As modern technology allows the focus to be on conceptual understanding instead of formal derivations–in many examples curve fitting with drawing free hand curves or by adjusting sliders suffices–this applies to the training of future teachers for the middle grades onwards, not just for upper grade teachers who may actually have to teach formal regression techniques. Do these activities also enable future teachers to transfer acquired data analytic thinking skills to new statistics problems that were never part of the course? Does it help to improve statistical thinking skills? We report about an empirical study on statistical thinking of 2nd year university students preparing to be teachers who attended an applied mathematics class that focused on modeling functional relationships.
STATISTICAL THINKING AND THE SIGNAL-NOISE METAPHOR
While there is an intense discussion on the nature of statistical thinking and how it differs from statistical reasoning and statistical literacy (see, e.g., Ben Zvi and Garfield, 2004), for the purpose of our paper we rely on the definition by Wild and Pfannkuch (1999):
Statistical thinking is concerned with learning and decision making under uncertainty. Much of that uncertainty stems from omnipresent variation. Statistical thinking emphasizes the importance of variation for the purpose of explanation, prediction and control.
Variation is the reason why complex statistical methods were devised in order to filter out signals from noisy data. Konold & Pollatsek (2002) characterize data analysis as the search for signals in noisy processes. A core concept of modeling statistical data is what Borovcnik (2005) calls the structural equation that represents data as decomposed into a signal to be recovered and noise. This split is our human response to deal with an overwhelming magnitude of relevant and irrelevant information contained in the observed data. Probability hereby acquires more the character of a heuristic tool to analyze reality. Figure 1 shows different versions of Borovcnik’s equation that expresses the signal-noise idea from different perspectives.
Signal Noise Pattern Deviation Structure Randomness
Model Fit Residual
Data =
Explained
+
Unexplained variation Figure 1. Different versions of Borovcnik’s structural equation
It may be surprising and is – from an epistemological point of view – far from obvious that the patterns of variation in careful measurements or in data of many individuals can be described by the same type of mathematics that is used to characterize the results of random experiments. Indeed, it is Borovcnik’s structural equation where data meet chance, i.e., where statistics as the science of analyzing data and probability as the study of random phenomena come together to build the powerful foundation of statistical inference. Interviews with students reveal a prevailing inclination to attribute even small variation in observed phenomena to deterministic causes as the following quote from a school student, age 17, expresses: “I accept the idea of randomness when I ask for the sum of two dice, but what is random about the weight loss of a person following a particular diet plan?”
A perspective on loosing weight as a noisy process may resolve the problem for the student: sticking to a particular diet plan may have an influence on body weight over time, described by a (deterministic) function, which, however, is perturbated by individual, unforeseen and unpredictable influences. Wild and Pfannkuch (1999) state that the tendency to search for specific causes is very deep-seated and leads people to search for causes also if an individual’s data are quite within the bounds of the expected when acknowledging random variation. This is in particular true for secondary school students whose adherence to a mechanistic-deterministic view of the world is well documented and doesn’t seem to fade with increasing years of schooling (Engel & Sedlmeier, 2005 and the literature therein).
The importance of the signal-noise concept for statistical thinking has been described by Konold & Pollatsek (2002) and Groth (2005). Does emphasizing these ideas enable students to allow for random variation in their thinking? As illustrated in the next section, the signal-noise idea can be introduced in the mathematics curriculum in the context of modeling functional relationships, hence connecting fundamental statistical ideas with other core mathematical topics. MODELING SCATTERPLOT DATA
A key concept in mathematics is the notion of function, which occupies a prominent place in the curriculum. Recent emphasis on modeling in the context of functions connects
algebra, calculus and statistics. A model is a theoretical construct to summarize data, but also to help us to understand the dynamics of the observed processes, to predict new values or to intervene and control efficiently. Many excellent instructive examples for modeling functional dependencies can be found in Erickson (2008). An important message here is that students learn that the model is not the reality. When modeling real data discrepancies between data and model will always occur. They are a genuine characteristic of the model, not (necessarily) a sign of the model being wrong or inappropriate. Therefore, calling the deviation of the model from the data “an error” is vocabulary that may well lead students astray and have them insisting on searching for the right, i.e., error-free, model. Residual analysis addresses directly the problem of balancing signal and noise. While regression is an important part of statistics, it is usually studied in connection with correlation. This is possibly one of the differences between statistical modeling of bivariate data and mathematical modeling with functions. Estepa and Sanchez-Cobo (2001) report about empirical research on students’ difficulties with correlation and regression.
The discovery and specification of trends in scatterplot data – discerned first through visual inspection, then through algebraic and numerical considerations and the use of modern technology – forms an important part of the data analysis curriculum. When teaching about modeling scatterplot data students can first draw free-hand graphs before gradually introducing techniques like curve fitting, difference and differential equations or scatterplot smoothers. Novices in probability and statistics tend to stick to a deterministic-mechanistic view of the world, which either doesn’t allow room for chance or knows only trend free randomness. When considering noisy observations in empirical data, students are challenged with separating the random part from the deterministic trend.
ROLE OF SIMULATION
Investigating variation involves usually a split of the data into explained und unexplained parts, or into causative and random parts (see Figure 1). As this separation is neither unique nor clear-cut, simulations are a very helpful tool to test our intuition and enhance understanding. In simulations we replace a real situation through an experiment, which is a model of the original, that can easily be manipulated and analyzed. Because the experiment is usually run involving a random number generator, we can raise the number of replicates for barely any effort. Observing the variation of the obtained results in repeated runs of the same experiment provides a direct experience with random and non-random influences. Simulations support valid intuitions about randomness and chance and confront us with our fallacies. They encourage an exploratory and experimental working style by allowing us to study the effects of different model assumptions and parameter specifications. Besides all enthusiasm about the didactical advantages of simulation based teaching methods we do not, however, claim that simulation alone will solve all problems of instruction. Simulation may initiate and provoke, but never replace, thinking about a problem.
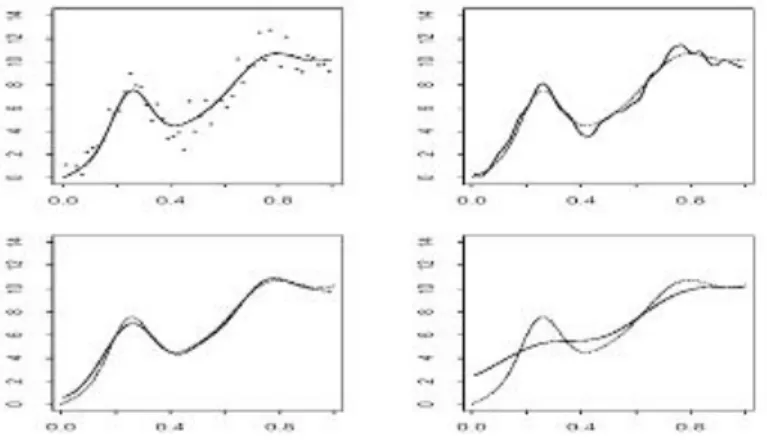
Figure 2. Simulated data (linear trend plus two peaks) with true regression function (left above), an undersmoothed fit to the data (right above), an oversmoothed fit (right below) and an
adequately smoothed fit (left below).
the context of smoothing bivariate data. With simulations it is very natural to create data that are composed of a signal and noise. Based on the equation:
yi = f(xi) + ei, i=1,…, n ,
where the xi are chosen over an equidistant input grid, say of size n = 50, the function f represents the signal and the ei are realizations of random variables with 0 expectation and (for simplicity) constant variance (the noise). Here computer simulations offer the opportunity to develop and deepen a sense for random fluctuation in real data in order to focus on the relationship between systematic structure and random noise in data. Figure 2 illustrates the effect of mediating between structure and noise for different “smooths” for a simulated data set, using a smoothly weighted moving average. In the oversmoothed fit (large averaging window) on the lower right of Figure 2 the structure of the main peak is distorted while the small peak is almost lost. The undersmoothed fit (small averaging window) on the upper right shows too much variability and a number of random peaks. A medium sized smoothing window (lower left display) results in an adequate recovery of the original function. Here we found an appropriate balance between signal and noise. STUDY DESIGN AND RESULTS
To evaluate the validity of the claim that a data-based course on functional modeling teaches universal statistical thinking skills, we conducted an empirical study following a pretest-posttest design with treatment and control group. Participants were second-year students (preparing to be teachers for elementary and secondary schools) attending two different courses in applied mathematics. While one course had a more traditional syllabus (the control group), in particular no analysis of real data and only moderate amount of explicit modeling, the other course (treatment group) followed strictly a concept of technology supported modeling of functional relationships of real data as outlined in the diagram shown in Figure 3.
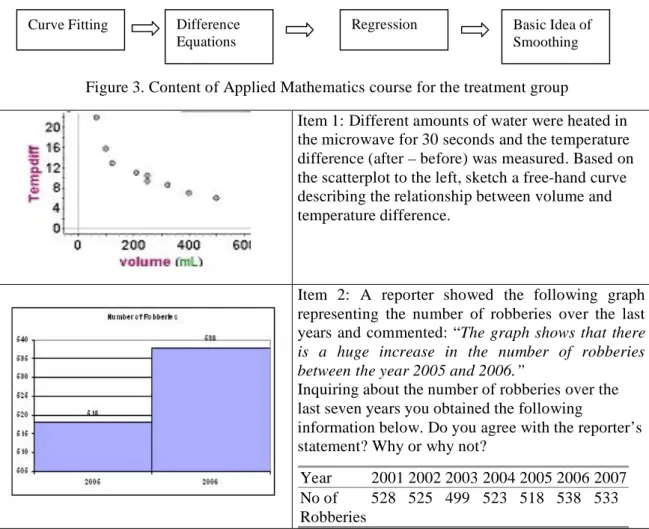
Figure 3. Content of Applied Mathematics course for the treatment group
Item 1: Different amounts of water were heated in the microwave for 30 seconds and the temperature difference (after – before) was measured. Based on the scatterplot to the left, sketch a free-hand curve describing the relationship between volume and temperature difference.
Item 2: A reporter showed the following graph representing the number of robberies over the last years and commented: “The graph shows that there is a huge increase in the number of robberies between the year 2005 and 2006.”
Inquiring about the number of robberies over the last seven years you obtained the following
information below. Do you agree with the reporter’s statement? Why or why not?
Year 2001 2002 2003 2004 2005 2006 2007 No of
Robberies
528 525 499 523 518 538 533
Figure 4. Examples of the items used in the study Curve Fitting Difference
Equations
Regression Basic Idea of
As they progressed along the various subtopics, the concept “Data = Signal + Noise” received increasing importance for the treatment group. To measure statistical thinking skills a short questionnaire was given to 179 participants of the study (78 in treatment group, 101 in control group) at two points in time: the pretest in the first meeting of class in October 2007, the posttest during the last meeting of class in February 2008. To obtain more in-depth information we conducted in addition seven video-taped interviews in the first and after the last week of class on two similar problems similar to those on the written tests. A questionnaire and interviews consisted of two items (see Figure 4). Item 1 is close to the content of the class for the treatment group and requires them to sketch a free hand curve in a scatterplot. Item 2 is a problem of change point detection based on informal inference, i.e. no formal inferential techniques are needed. It requires a judgment about a change over time in a system taking into account some context knowledge and variation in the data. Both items were administered in four different versions and were completely counterbalanced across pretest and posttest, to control for item difficulty. RESULTS
To evaluate the responses we proceeded as follows: Item 1 asked for modeling with functions. We classified each response into one of the following three categories: I for a curve that interpolates all observations, P for fitting a curve from a chosen parametric class of functions and S for data smoothing. While both P and S may be considered as appropriate for recognizing random variation in data with S reflecting the spirit of exploratory data analysis even more strongly, we interpret interpolation as reflecting a rather deterministic mindset ignoring random variation in real data. Results for Item 1 are presented in Figure 5. While we observe in the control group only a very modest shift of 8% from the group classified as interpolators (I) to parametric curve fitting (P) and an almost unchanged small percentage of data smoothing, in the treatment group curve fitting increases between pre- and posttest by more than 27 % and the data smoothing gains 5%, both at the loss of interpolations.
Figure 5. Percentage of students classified as Interpolator (I), Parametric Curve Fitter (P) or Smoother (S) in pre- and posttest
While a substantial improvement on Item 1 problems for the treatment group is not surprising at all – after all, these types of problems are very close to the course content – our main interest is in the comparison of Item 2 type problems. Prior to this, statistical inference had never been taught to either group of students. Item 2 was evaluated by assigning a score between 0 and 100 to the response based on the participants’ reasoning. All Item 2 questions were constructed so that at a first sight there seemed to be a jump or change point in the data. This impression was aggravated by starting the vertical scale high above the origin. However, when taking into account the variation of measurements over the last several years, which was provided in tabular format, evidence for a change point became very weak. Scoring was done according to a scheme that honored recognition of variation in the past data, enhanced by contextual consideration while attempts to search for specific reasons led to low scores. While in the pretest the two groups
0 1 0 2 0 3 0 4 0 5 0 6 0 7 0 8 0
I_Control P_Control S_Control
I_Treatment P_Treatment S_Treatment
P r e te s t P o s tt e s t
barely differed at all, the difference between treatment and control group in the posttest was highly significant. The t-test with unpooled variance for posttest difference in mean scores resulted in a p-value of p= 0.0031. Table 1 gives a detailed account of our test statistics.
Table 1. Scores on item 2
Control Treatment Mean 29.55 28.87 Prettest Standard error 2.84 3.31 Mean 29.86 43.75 Posttest Standard error 2.85 3.60 CONCLUSION
We found a sizeable and highly significant improvement of the treatment group on Item 2 problems with no noticeable changes in the performance of the control group. These results are a strong indicator that students are capable of transferring the signal-noise concept from the context of modeling functional relationships to broader statistical problems. It shows that the real-data modeling approach in an applied mathematics course improves statistical thinking skills without explicitly focusing on statistics.
REFERENCES
Batanero, C., Godino, J. D., & Roa, R. (2004). Training teachers to teach probability. Journal of
Statistics Education, 12. Online: www.amstat.org/publications/jse/.
Ben-Zvi, D., & Garfield, J. B. (Eds.) (2004). The challenge of developing statistical literacy,
reasoning and thinking. Dordrecht, Netherlands: Kluwer.
Borovcnik, M. (2005). Probabilistic and statistical thinking, In M. Bosch (Ed.), CERME IV.
European Research in Mathematics Education. [CD-ROM]. Sant Feliu de Guissols: ERME.
Engel, J. (2002). Activity-based statistics, computer simulation and formal mathematics. In B. Phillips (Ed.), Proceedings of the Sixth International Conference on Teaching Statistics. [CD-ROM]. Cape Town: International Association for Statistical Education.
Engel, J., & Sedlmeier, P. (2005). On middle-school students’ comprehension of randomness and chance variability in data. Zentralblatt für Didaktik der Mathematik, 37 (3), 168-177.
Erickson, T. (2008). The model shop. Using data to learn about elementary functions. Oakland, CA: Eeps Media.
Estepa, A., & Sanchez Cobo, F. (2001). Empirical research on the understanding of association and implications for the training of researchers. In C. Batanero (Ed.), Training Researchers in
the Use of Statistics (pp. 37-51). Granada, Spain: International Association for Statistical
Education and International Statistical Institute,
Gattuso, L., & Pannone, M. (2002). Teacher’s training in a statistic teaching experimentation. In B. Phillips (Ed.), Proceedings of the Sixth International Conference on Teaching Statistics, [CD-ROM]. Cape Town: International Association for Statistical Education and International Statistical Institute.
Groth, R (2005). An investigation of statistical thinking in two different contexts: Detecting a signal in a noisy process and determining a typical value. The Journal of Mathematical
Behavior, 24(2), 109-124.
Konold, C., & Pollatsek, A. (2002). Data analysis as the search for signals in noisy processes.
Journal for Research in Mathematics Education,33(4), 259-289.
National Council of Teachers of Mathematics (2000). Principles and standards for school
mathematics. Reston: VA: NCTM.
Rossman, A., Chance, B., & Lock, R. (2001). Workshop statistics. Discovery with data and
FathomTM.Emeryville: Key College Publishing.
Scheaffer, R., Gnanadesikan, M., Watkins, A & Witmer, J. (1997). Activity-Based Statistics.
Springer: New York.
Wild, C., & Pfannkuch, M. (1999). Statistical thinking in empirical enquiry. International