2002 UGANDA POPULATION AND
HOUSING CENSUS
Analytical Report
POPULATION SIZE AND DISTRIBUTION
UGANDA BUREAU OF STATISTICS Plot 9, Colville Street
P. O. Box 7186 Kampala Tel: 256 41 706 000 Fax: 256 41 237 553 Email: [email protected] Website: www.ubos.org October 2006
FOREWORD
The Uganda Bureau of Statistics supports the Government’s results-based agenda by providing statistics needed for planning, monitoring development performance and progress in the implementation of major national development policies and initiatives. The Population and Housing Census is the major source of demographic and social-economic statistics in Uganda. The country has conducted scientific population and housing censuses at intervals of about ten years since 1948. The latest such census was conducted in 2002 and was the most comprehensive census ever undertaken in Uganda. This census collected household-based data on population, housing, agriculture, micro and small enterprises as well as community information.
The Uganda Bureau of Statistics has published the 2002 Census results in different reports at different times and with varying degrees of detail. The Monograph Series provide more detailed and subject-oriented analyses of the census data which relate the findings to the national development policies and targets as outlined in the PEAP. This Monograph on Population Size and Distribution contains information on Population size and distribution, Migration and Urbanisation.
The Bureau is grateful to the many institutions and individuals who participated in the planning and/or implementation of the Census. They include members of the Inter-Institutional Steering and Technical Advisory Committees; District Census Committees; field Staff including Mapping Assistants, Enumerators and Supervisors; the millions of individual respondents who provided the required information; Data Processing staff and the authors of the various chapters of this and other Census reports.
The Government of Uganda funded the bigger part of the Census. The Bureau is grateful for this collaboration and also the support from the development partners who funded the other cost of the census operations.
Finally, the Bureau appeals to the people of Uganda to make maximum use of the census data as a basis for evidence-based policy debate and design; decision-making at every level of society; investment and business transactions; and for many other purposes.
John B. Male - Mukasa EXECUTIVE DIRECTOR
PREFACE
The 2002 Census was conducted with reference to 12th/13th September 2002 as the Census Night. During the census, trained enumerators visited every household and collected information on all persons who spent the Census night in the household. Special arrangements were made to enumerate the mobile population as well as those living in institutions. Persons living in IDP camps were enumerated as households and the information was recorded against the areas where they came from. Specifically, persons who spent the Census Night in hotels and lodges were enumerated using a special questionnaire. In addition, the characteristics of Household Heads who were not at home on the Census Night were also recorded. The enumeration was completed within seven days for most areas.
UBOS has produced several reports from the census data. In order to increase the utility of the census data, subject specific monographs giving detailed analytical findings of the 2002 Census have been written. These were written by a team of local experts in the different disciplines. In carrying out the data analysis, differentials by sex and rural-urban residence have been studied. Further differentials have been studied with respect to socio-economic characteristics as well as spatial distribution of the population. Also produced is an Abridged Version which contains the summary of findings from all the monographs.
This monograph presents the Population Size and Distribution. The other monographs in series include the following;
Volume II: Population Composition Volume III: Population Dynamics Volume IV: Economic Characteristics Volume V: Educational Characteristics
Volume VI: Household and Housing Conditions Volume VII: Gender and Special Interest Groups
Where possible, the 2002 Census results are compared with those from previous data sources, mainly the Censuses of 1969, 1980 and 1991, the Uganda Demographic and Health Survey (UDHS) 2000-01 and the Uganda National Household Survey (UNHS) 2002/03. However, these comparisons are limited to national level data only, since disaggregation of data by district or other characteristics for earlier dates could not be obtained.
For purposes of presentation of spatial differentials, data are shown for the country’s districts as at the time of enumeration. These have been grouped into four regions namely Central, Eastern, Northern and Western. These are statistical groupings of districts without administrative or political
better than the other regions. In order to make a fair comparison of the regions, the indicators for Central region are presented in two ways viz including and excluding Kampala City.
Prior to this monograph series, six other products were published. These are:
i. Preliminary Results – giving total population by district and sex, released in October 2002. ii. Provisional Results – giving total population of administrative areas by sex, released in
November 2002.
iii. Report on the Agricultural Module – giving information on household based agricultural activities, released in September 2004.
iv. Final Results: Main Report – giving population and household characteristics based on the final results, released in March 2005.
v. Post Enumeration Survey Report – giving the procedure and findings from the Post Enumeration activity, released in October 2005.
vi. District Census Report– giving district specific population and household characteristics based on the final results, released in November 2005.
In addition, the Bureau will be producing several other reports as outlined below: i. Administrative Report
ii. District-level Analytical Reports iii. Census Atlas
TABLE OF CONTENTS
FOREWORD ... i
TABLE OF CONTENTS ... v
LIST OF TABLES ... vi
LIST OF TABLES ... vi
EXECUTIVE SUMMARY ... vii
CHAPTER 1: BACKGROUND ... 1
1.1 General Information about Uganda ...1
1.2 Sources of Data...3
1.3 The 2002 Uganda Population and Housing Census...4
1.3.3 Exclusion of data from Kotido District...5
1.4 Organisation of the Report ...6
CHAPTER 2: POPULATION SIZE AND DISTRIBUTION ... 7
2.0 Background ...7
2.1 Total Population ...8
2.2 Spatial Distribution of the Population...8
2.2 Spatial Distribution of the Population...8
2.3 Population Density ...11 2.4 Population growth...14 2.5 Summary ...19 CHAPTER 3: MIGRATION ... 21 3.0 Background ...21 3.1 Sources of data ...22
3.2 Migration Characteristics of the Census Population ...23
3.3 International Migration...23 3.4 Internal Migration...29 3.5 Summary ...34 CHAPTER 4: URBANISATION ... 35 4.0 Background ...35 4.1 Sources of data ...36
4.2 Levels and Trends in Urbanisation ...36
4.3 Characteristics of the urban population ...43
4.4 Summary ...44
CHAPTER 5: POLICY IMPLICATIONS AND RECOMMENDATIONS---45
LIST OF TABLES
Table 1.1: Number of Administrative Units by Census 1969 – 2002 ... 1
Table 2.1: Distribution of Districts Population by Size, 2002 ... 10
Table 2.2: Distribution of Sub-counties /Divisions by Population Size ... 10
Table 2.3: Distribution of Parishes / Wards by Population Size... 11
Table 2.4: Population Density of Uganda, 1948 – 2002 ... 12
Table 2.5: Population size, Inter-censal Population increases and average annual growth rates, 1911-2002 ... 14
Table 2.6: Age and sex specific Average annual Population growth rates (1969-2002) ... 16
Table 2.7: Distribution of Districts by Growth Rates, 1980 - 2002 ... 17
Table 3.1: Distribution of the Population (000’s) by Migration Characteristics ... 23
Table 3.2: Immigrants by Race and Sex, Uganda, 1948 – 2002 ... 24
Table 3.3: Percent Sex Distribution of Immigrant Population by Country of birth... 25
Table 3.4: Immigrants by Selected characteristics ... 27
Table 3.5: Distribution of Recent Immigrants by Country of Previous Residence ... 28
Table 3.6: Selected Characteristics of Recent Immigrants... 29
Table 3.7: Distribution of Recent Migrants by Residence and Sex ... 30
Table 3.8: Sex Distribution of Recent Migrants by Selected Characteristics... 31
Table 3.9: Proportion of Recent migrants who moved within the same region ... 32
Table 3.10: Distribution of Recent Internal Migrants by Size of Migration Stream ... 32
Table 3.11: In and Out Migration Rates for the Top 10 Districts... 33
Table 3.12: Net Migration Rates for the top 10 and bottom 10 Districts. ... 34
Table 4.1: Trends in Urban Population, 1980 – 2002 ... 36
Table 4.2: Urban Population Distribution by Region, 1969 – 2002... 38
Table 4.3: Distribution of Districts by Size of Urban Population ... 41
Table 4.3: Population size and growth rates of urban areas with at least 30,000 people in 2002 ... 42
Table 4.4: Selected characteristics of the urban population ... 44
LIST OF APPENDIX TABLES
Table A1.1: Population distribution by Districts, and Regions (1980-2002) and Urbanization level and share of the Population in 1980-2002 ... 46Table A1.1:Population distribution by Districts, and Regions and urbanization level and share of the Population, 1980-2002 ... 47
Table A1.2: District and Regional distribution of Sub counties by Population Size ... 48
Table A1.2:District and Regional distribution of Sub counties by Population Size ... 49
Table A1.3:District and Regional Distribution of Parishes by Population Size ... 50
Table A1.3:District and Regional Distribution of Parishes by Population Size ... 51
Table A1.4:Population growth rates and densities by District, 1980-2002 ... 52
Table A1.4:Population growth rates and densities by District, 1980-2002 ... 53
Table A1.5: Distribution of Recent Internal Migrants by District ... 54
Table A1.5: Distribution of Recent Internal Migrants by District-Continued... 55
LIST OF FIGURES
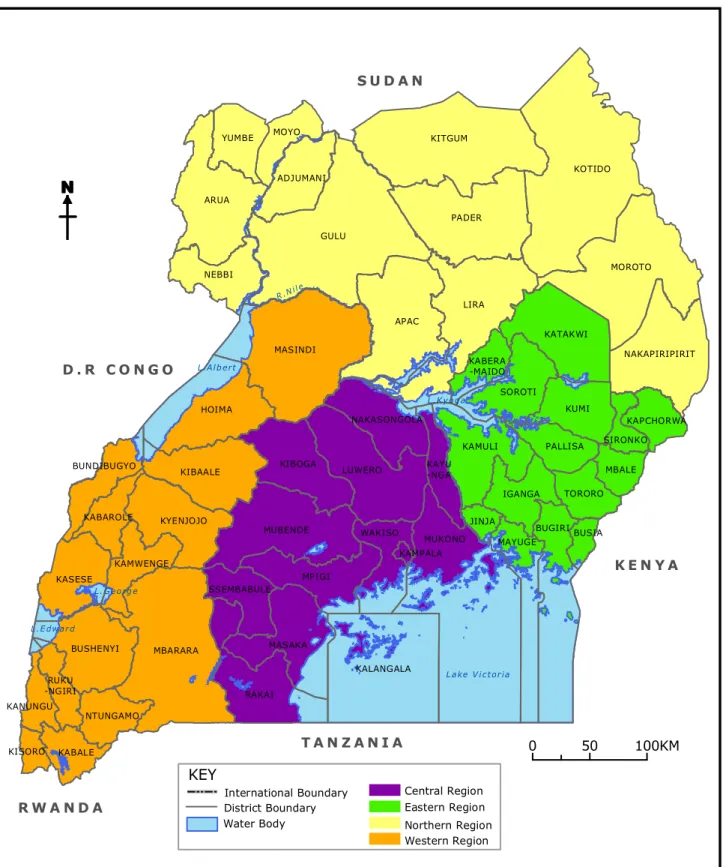
Figure 1.1: Map of Uganda showing the Districts as of September 2002 ... 2Figure 2.1: Population of Uganda, 1948-2002 ... 8
Figure 2.2: Percentage Share of Population by Region, 1991-2002 ... 9
EXECUTIVE SUMMARY
The 2002 Census was conducted with reference to the night of 12th/13th September (Census Night). The enumeration covered all persons resident in Uganda on the Census Night. Special arrangements were made to enumerate institutional, homeless, hotel and mobile populations. The census collected data on the demographic and socio-economic characteristics of the population; household and housing conditions, agriculture; activities of micro and small enterprises; and the community characteristics. There was evidence of deliberate falsification of data from Kotido District. Therefore the analysis in this report excludes data for Kotido district.
Population Size and distribution
The population of Uganda was 24.2 million persons, of which 51 percent were females. The Central region had the largest share of the national population of 27 percent and the Northern the lowest one of 21 percent. The two districts of Kampala and Mbarara had a population of above one million people. About half of the population lived in districts with less than 500,000 people. The average national Sub-county and parish population sizes were 25,289 and 4,625 persons respectively. The population density of Uganda was 123 persons per square kilometre in 2002 with the Eastern region having the highest population density of 226 persons per square kilometre compared to Northern region which had the lowest of 62 persons per square kilometre. The population density of the districts ranged from 22 persons per square kilometre for Moroto district to 7,259 persons per square kilometre for Kampala district.
The average annual population growth rate of 3.2 percent for the period 1991-2002 was higher than the growth rate of 2.5 for the earlier inter-censal period 1980-1991. The high growth rate was due to high fertility levels and declining mortality. Out of the 56 districts 12 had high growth rates, above 5.0 percent during the intercensal period 1991-2002.
Migration
International migration does not have a significant impact on the size of the population. There were only 333 thousand immigrants (persons born outside Uganda), and of these, 100,000 were recent immigrants, constituting less than one percent of the total population in 2002. More than 90 percent of the recent immigrants were from the 6 neighbouring countries. The Democratic Republic of Congo (DRC) was origin to more than one-third of the recent immigrants in 2002 followed by Sudan with 20 percent.
About 3.1 million persons born in Uganda were enumerated outside their district of birth and hence classified as internal migrants. About 43 percent of the internal migrants were recent migrants (moved within 5 years prior to the census).
Urbanisation
The level of urbanization remained low, with only 12.3 percent of the population residing in the urban areas. The Central region had the highest level of urbanization of 25 percent. The high level of urbanization in Central region is due to Kampala City being the prime urban area nationally, and this level reduces to 9 percent when Kampala district is excluded from the regional data.
CHAPTER 1: BACKGROUND
1.1
General Information about Uganda
1.1.1 Location and SizeUganda is located in East Africa and lies across the equator, about 800 kilometres inland from the Indian Ocean. It lies between 10 29’ South and 40 12’ North latitude, 290 34 East and 350 0’ East longitude. The country is landlocked, bordered by Kenya in the East; Sudan in the North; Democratic Republic of Congo in the West; Tanzania in the South; and Rwanda in South West. It has an area of 241,038 square kilometres, of which the land area covers 197,323 square kilometres.
1.1.2 Administration
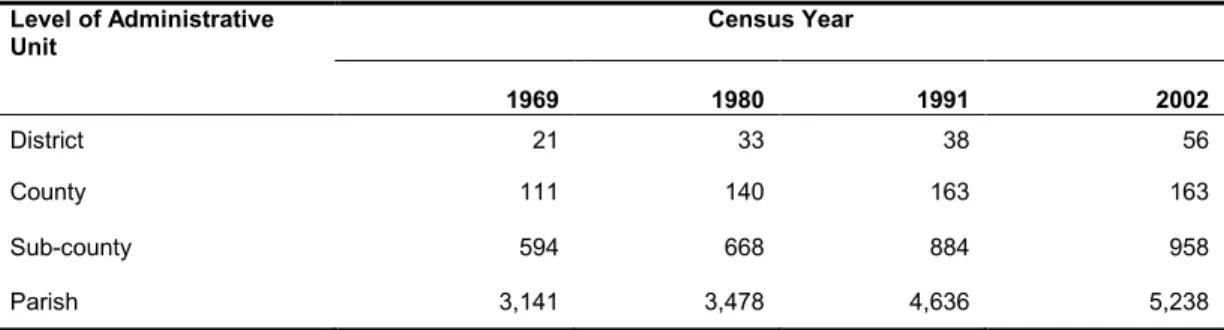
The country was divided into 56 districts at the time of the 2002 Population Census. The districts are sub divided into lower administrative units. These are counties, sub-counties, parishes and villages or Local Council 1 (LC 1). Overtime, the numbers of districts and lower level administrative units have continuously increased with the aim of making administration and delivery of services easier. This however, had a negative element in that most of the districts do not have time series data and hence it is not possible to do a trend analysis. The numbers of administrative units at the various census nights since 1969 are given in Table 1.1.
Table 1.1: Number of Administrative Units by Census 1969 – 2002
Census Year Level of Administrative Unit 1969 1980 1991 2002 District 21 33 38 56 County 111 140 163 163 Sub-county 594 668 884 958 Parish 3,141 3,478 4,636 5,238
In addition, Uganda has a Local Governments System at different levels. These are LC V (District); LC IV (County / Municipality); LC III (Sub – County); LC II (Parish); and LC I (Village). The role of the local governments is to implement and monitor government programmes at the respective levels.
GULU KOTIDO LIRA MUKONO APAC KITGUM MASINDI MBARARA PADER ARUA MOROTO HOIMA RAKAI BUGIRI KALANGALA LUWERO MUBENDE MPIGI MASAKA KAMULI KUMI KATAKWI KIBAALE KIBOGA NEBBI KASESE SOROTI BUSHENYI MAYUGE KYENJOJO NAKAPIRIPIRIT YUMBE WAKISO MOYO IGANGA ADJUMANI PALLISA NAKASONGOLA KABALE TORORO MBALE KAMWENGE KAYU -NGA NTUNGAMO SSEMBABULE KABAROLE BUNDIBUGYO KANUNGU KAPCHORWA JINJA RUKU -NGIRI BUSIA SIRONKO KABERA -MAIDO KISORO KAMPALA L a ke V i c t o r i a L . K y o g a L . A l b e r t L . G e o rg e L . E dw a r d R .N i l e S U D A N T A N Z A N I A D . R C O N G O R W A N D A K E N Y A KM 0 50 100
N
N
N
N
KEY Central Region Eastern Region Northern Region Western Region Water Body District Boundary International Boundary1.1.3 Geography
The country enjoys equatorial climate with plenty of rain and sunshine moderated by the relatively high altitude. In most parts of the country, the mean annual temperatures range from 160 C to 300 C. Nevertheless, the Northern and Eastern regions sometimes experience relatively high temperatures exceeding 300 C and the South Western region sometimes has temperatures below 160 C.
The Central, Western and Eastern regions have two rainy seasons, from March to May for the first rains, and the second rains from September to November. The Northern region receives one rainy season from April to October, and the period from November to March has minimal rain. Most of the country receives between 750 mm and 2100 mm annually. The country has loamy soils with varying proportions of sandy and clay. In addition, it has varying vegetation with tropical rain forest vegetation in the South and savannah woodlands and semi arid vegetation in the North.
1.1.4 Culture and Religion
Uganda’s population is made up of different ethnic groups with varying customs and norms. These play a major role in shaping the behaviours and ways of life of the people in the country. Some of the traditional values have changed due to the integration of the people as a result of migration and/or intermarriages. The cultural groupings, such as, Baganda, Basoga, Batoro, Banyoro, and Itesoit are headed by traditional kings or chiefs who are not politically elected but have an indirect role in community governance and moral build up.
There are a number of languages spoken because of the many tribes in Uganda; however English is the official language. The Swahili language is being promoted in the spirit of Regional Socio-Economic Corporation, and integration of the East African Community.
The 1995 Constitution of the Republic of Uganda recognizes the freedom to practice any religion.
1.1.5 Education
Uganda’s education system is both formal and informal. Under the formal system, the four – tier educational model is followed i.e. seven years of primary education, four years of ordinary level secondary education, two years of advanced level secondary education and the tertiary level of education. Each level is nationally examined and certificates are
The Universal Primary Education (UPE) was introduced in 1997 to offer free education at the primary level. However, access to secondary and tertiary education is limited to only those who can meet the costs. There are plans by the Government to introduce Universal Secondary Education (USE) in 2007. The government also sponsors about 4,000 students every year through the public universities. In addition, the private sponsorship scheme is operational in the public universities. University education can also be obtained from any of the seven private universities in the country. In addition, a large number of institutions both private and public also offer tertiary education.
In addition to formal education there exists informal education to serve all those persons who did not receive formal education. Under the informal system, a range of practical/hands-on skills are imparted to those who have not gone through or only partially gone through the formal system of education. The majority in the informal system are the young adults and/or drop out and disadvantaged children. The Functional Adult Literacy (FAL) programme in the Ministry of Gender, Labour and Social Development also targets older people who did not get chance to go through formal training.
1.1.6 Macro economy
Uganda’s economic performance was performing well in the early years of independence; with rapid economic growth and development. In the early post independence period (1962-1966), the economy grew at an average of 6.7 percent per year. By the end of the 1960’s, commercial agriculture accounted for more than one-third of GDP and industrial output had increased to nearly nine percent of GDP, given the new food processing industries. In the early 1970’s, the government targeted an annual GDP growth rate of about 5.6 percent. However, the political instability and associated economic mismanagement resulted in a persistent economic decline that left Uganda among the world’s poorest and least developed countries.
In early 1980s, Structural Adjustment programs were introduced which led to strong economic growth of GDP. Hence, the period that followed showed a remarkable increase in productivity and output. This was given impetus by macroeconomic stability resulting from the macroeconomic reforms. The led to the economy reverting to its high GDP growth rates and low and stable inflation and interest rates from the 1990’s to present. The PEAP target was for a GDP growth rate of 5.2 percent in 2003, and an average of 7
The economy of Uganda is primarily based on the agricultural sector, with over 70 percent of the working population being employed by the sector. Agricultural exports account for over 45 percent of the total export earnings with coffee, tobacco and fish continuing to be the main export commodities that bring in foreign exchange.
In the last 5 years, the telecommunication sector has been the fastest growing sector of the economy, and this is due to the expansion programs and increase in coverage by the major telecommunication companies in the country which have led to increased numbers of subscribers and providers of the services.
1.2
Sources of Data
The main data sources for establishing benchmarks for economic and social indicators for Uganda are censuses and surveys. Information is also obtained from administrative records.
1.2.1 The Earlier Population Estimates
Prior to 1900, there was limited information on Uganda’s population. The first official population estimates of the Uganda Protectorate were made in 1900 and 1901, and gave a population at 2 million and 2.5 million respectively which were more or less accepted until the first census was carried out in the year 1911.
1.2.2 The Population Censuses 1911 - 1991
The population censuses in Uganda have been conducted in the years 1911, 1921, 1931, 1948, 1959, 1969, 1980, 1991 and 2002. The 1911, 1921 and 1931 population censuses were mainly administrative in nature, and for all the three censuses, separate enumeration procedures were made for the African and non-African population in the country. For the non-African population and for the Africans living on non-African premises, census forms were collected from their local administrative centres. The population census results of 1911, 1921 and 1931 were 2.5 million, 2.9 million and 3.5 million respectively.
The 1948 Population Census was the first scientific census to be carried out in Uganda. This was followed by the 1959 Censuses. During the two censuses, the African Population and the non African population were enumerated separately. The two censuses were followed by sample censuses of 10 percent and 5 percent respectively. The sample censuses were intended to provide detailed data to help in the planning processes.
The first post independence census was conducted in 1969 followed by 1980 and 1991. The methodology used during these censuses was similar; people were enumerated where they spent the census night (De facto Census) and conducted simultaneously for Africans and Non-Africans. Two different types of schedules were used to collect the data. The first schedule contained limited questions and was administered at 100 percent coverage while the built in sample covered 10 percent of the rural areas and 100 percent of the urban areas and was intended to provide detailed data to aid in planning.
1.3
The 2002 Uganda Population and Housing Census
The 2002 Population and Housing Census was the most comprehensive census ever conducted in Uganda. The census collected data on the demographic and socio-economic characteristics of the population; household and housing conditions, agriculture; activities of micro and small enterprises; and the community characteristics. A structured questionnaire was administered to all households and the institutional population.
1.3.1 Census Implementation
The reference night (Census Night) was 12th/13th September 2002, and the actual enumeration was carried out between 13th and 19th September 2002. The enumeration was done by trained enumerators who canvassed the entire country and administered the questionnaires to the household head, or in his/her absence any other knowledgeable household member. Special arrangements were made to enumerate institutional, homeless and mobile populations. The census administered a standard questionnaire to all persons countrywide.
For purposes of presentation of the results, the country’s 56 districts have been grouped into four regions namely Central, Eastern, Northern and Western. These are statistical groupings of districts without administrative or political status. In order to show a clearer trend, the 1980 and 1991 censuses data was redistributed according to the 2002 district boundaries and other lower administrative units.
1.3.2 Quality of the Census Data
Quality is an important aspect of data as it enhances their credibility, increases their potential use and the benefits to be derived from them. Census data quality can be compromised by poor measurement of characteristics as well as poor quality control in implementation of methodologies. In particular, quality can be compromised through
The 2002 census process paid attention to quality management and enhancement. In particular, special measures were taken to ensure quality census data. These included, among others:
• dividing up the whole country into compact and manageable enumeration areas which can be covered by one enumerator.
• producing enumeration area maps to avoid omission or double counting during enumeration
• ensuring that each enumerator exhaustively canvassed the assigned area. • using simple and pre-tested questionnaires.
• preparation of an Enumerators’ Instructions Manual to act as a full-time guide to the census enumeration.
• adequate publicity of the census exercise throughout the country. • adequate training of all field staff lasting for a period of 6-7 days
• intensive supervision at all levels – parish, sub-county, district and national • checking and editing the census questionnaires.
• 100 percent verification of all data entered into the computer.
• carefully checking all data for internal consistency as well as consistency with data from other sources.
• conducting a Post Enumeration Survey (PES) with the aim of measuring the magnitude, direction and sources of errors for the 2002 Census.
1.3.3 Exclusion of data from Kotido District
The final results showed that Kotido District had a very high population growth rate of 9.5 percent per annum and an average household size of 6.8 persons. These were much higher than what was observed for the same district in 1991 and for the neighbouring districts in 2002. UBOS carried out an investigation of the Census data and found that a number of indicators for Kotido district deviated from other reliable results obtained from other studies. A deeper review of a representative sample of the census data for the district revealed that there was a deliberate duplication of households and individuals to inflate the population figures.
Statistical methods were applied on the population of Kotido to come up with more reliable estimates of the population of the district as of 2002. UBOS subsequently adjusted the
obtained detailed characteristics of the population and households. Since most of the indicators from the district were not reliable, a decision was taken to carry out the census analysis without Kotido data. Thus, the indicators shown in this report exclude the figures for Kotido district apart from indicators on population size, growth and distribution.
Because of this, the analysis of population size and Distribution is based on the total population of 24.2 million, while the rest of the report is based on the population excluding persons enumerated in Hotels and Kotido district, which was 23.8 million.
1.4 Organisation of the Report
This monograph is organized into five Chapters. Chapter 1 gives an introduction which includes the background to the census, the 2002 census processes, data quality and the organization of this report. Chapter 2 presents Population size and distribution; Chapter 3 covers Migration while Chapter 4 covers Urbanisation. Chapter 5 presents the policy implications
CHAPTER 2: POPULATION SIZE AND DISTRIBUTION
2.0
Background
To formulate present and future development programmes, a nation needs to know the size, quality and growth of its population. Population growth should be in tandem with economic growth and development if a country is to develop fast enough. It is determined by levels of fertility, mortality and migration of an area or negative.
Population censuses are the main sources of demographic data in general and information on population size, distribution and growth in particular. Other sources include sample surveys, the Birth and Death Registration System (BDR) and Administrative records. Although the BDR system is in operation in some of the districts, it is not yet able to generate reliable estimates. This chapter analyses the size of the population of Uganda, its distribution and trends/patterns in its growth over time.
Uganda has a National Population Policy (NPP) based on the Poverty Eradication Action Plan (PEAP) as its driving force. It spells out the pertinent issues for action to ensure that the Population of the Country is healthy and supportive of the Country’s Population goals and objectives. It emphasizes the importance of reflecting population issues in development planning at all levels and stresses that the decision of individuals and couples to utilize the limited resources of the country should take into consideration the needs of future generations. The policy document recognizes that the current level of population growth cannot be sustainable with the current economy and the high poverty and low levels of living. It therefore spells out concrete actions for the management of the population as a pre-condition for acceleration of social transformation of the society and improvement of the quality of life. Issues on population size, distribution, growth and urbanization are highlighted in the policy document1.
When comparing the population sizes, distribution and growth rates at low levels of administration like districts, boundaries were constituted as they existed on 13 September 2002, the census reference date. The figures published in the reports of the earlier censuses may therefore differ from the 2002 information for districts where there were changes in the boundaries between the time of earlier censuses and 2002.
2.1
Total Population
The Population of Uganda was 24.2 million in 2002 having increased from 2.5 million in 1911 reflecting nearly a 10-fold increase over a 90-year period. Between 1948 and 2002 the population increased from 5.0 million to 24.2 million an increase of about 5 times.
Figure 2.1: Population of Uganda, 1948-2002
2.2
Spatial Distribution of the Population
2.2.1 Regional PopulationThe distribution of the population by districts and regions during the three previous census years is shown in Appendix Table A1.1 while Figure 2.2 shows the regional share of the population in 1991 and 2002. The central region had the largest share of the population at 27 percent in 2002 Despite having decreased from 29 percent in 1991. The Western region also experienced a decrease in its share of the national population between 1991 and 2002. On the other hand the Northern region still had the lowest share of the population despite the considerable percentage gain between 1991 and 2002 censuses. Eastern region also gained in its share of the national population between 1991 and 2002. The gain in the northern region can be partly attributed to the relative security it experienced prior to the 2002 population and housing census thus encouraging many of the northerners who had migrated to other regions and neighbouring countries to come back home to their respective districts.
5.0 6.5 9.5 12.6 16.7 24.2 0 5 10 15 20 25 30 1948 1959 1969 1980 1991 2002 Census Year P o p u la ti o n ( M il li o n s ) The population increased 5 times in about half a century (1948-2002)
Figure 2.2: Percentage Share of Population by Region, 1991-2002
In addition there were marked fertility differences among the regions. According to UDHS results from the 2000-01 survey, the two regions of central and western whose share declined between the years 1991-2002 had Total Fertility Rate (TFR) lower than Eastern and Northern Regions.
2.2.2 District Population
Table 2.1 shows that 36 out of the 56 districts in 2002 had populations between 250,000 and 750,000 persons, and these constituted about two thirds of the total population. In 1980 no districts had population of more than 750,000 people. In 1991, 9 percent of the population lived in Districts with 750,000 or more people increasing further to 23 percent in 2002. The number of districts with less than 250,000 persons decreased from 35 in 1980, to 30 in 1991 and further to14 in 2002. Similarly the population share in those districts decreased from 40 percent in 1980 to 10 percent in 2002. On the converse population share of districts with more than 500,000 people increased from 9 percent in 1980 to 50 percent in 2002 29 25 19 27 27 26 21 26 0 5 10 15 20 25 30 35 40
Central Western Eastern Northern
Regions S h a re o f th e P o p u la ti o n ( % ) 1991 2002 50 percent of the population lived in districts with less than 500,000 people
Table 2.1: Distribution of Districts Population by Size, 2002
Number of Districts Population (Millions) Share of Population (%) Population Range 1980 1991 2002 1980 1991 2002 1980 1991 2002 Less than 250,000 35 30 14 5 4.8 2.5 39.5 28.9 10.3 250,000 – 499,999 19 17 26 6.5 6.3 9.6 51.7 38 39.6 500,000 – 749,999 2 7 10 1.1 4 6.5 8.8 23.8 27.1 750,000 or More 0 2 6 0 1.6 5.6 0 9.3 23.1 All Sizes 56 56 56 12.6 16.7 24.2 100 100 100
Appendix Table A1.1 gives the distribution of the population by districts during the previous three recent censuses (1980-2002). The table shows that in 2002, two districts (Mbarara and Kampala) had populations of more than one million people while Kalangala was the only district with a population of less than 100,000 people. Due to uneven population growth rates among districts, Kampala district which had the third largest size of the population in 1980 became the most populated in 2002.
2.2.3 Sub county Population
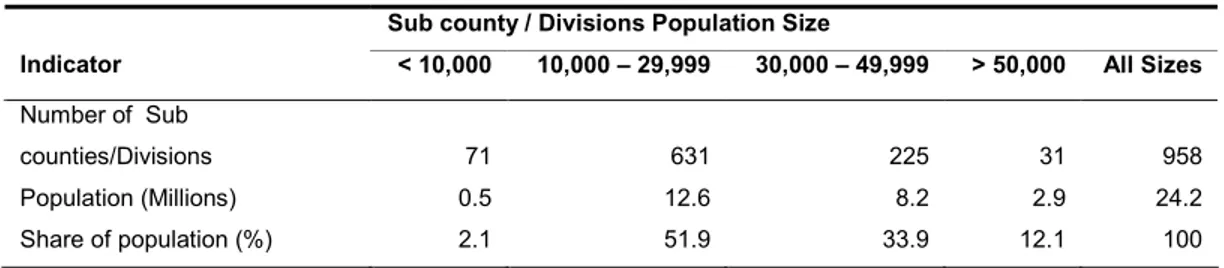
The distribution of the population by sub-county is given in Appendix A1.2. The population size of the sub-counties varied quite widely. Table 2.2 shows that slightly more than half of the population lived in sub-counties with a size of 10,000 – 29,999 persons. Table 2.2: Distribution of Sub-counties /Divisions by Population Size
Sub county / Divisions Population Size
Indicator < 10,000 10,000 – 29,999 30,000 – 49,999 > 50,000 All Sizes
Number of Sub
counties/Divisions 71 631 225 31 958 Population (Millions) 0.5 12.6 8.2 2.9 24.2 Share of population (%) 2.1 51.9 33.9 12.1 100
One-third of the population lived in sub-counties with populations between 30,000 and 49,999 persons. There were 31 large sub-counties, (with populations of 50,000 persons or more), and they collectively constituted 12 percent of the population while the remaining 2 percent of the population lived in the smallest sub-counties, with populations less than 10,000 persons.
District which had an average population size more than 9 times the national average (237,828 persons).
2.2.4 Parish Population
Table 2.3 shows that about 42 percent of the people lived in parishes with a population between 2,000-4,999 or 5,000-9,999 people. Only 4 percent of the people lived in the very small parishes with less than 2,000 persons, while 13 percent lived in parishes with more than 10,000 people.
Table 2.3: Distribution of Parishes / Wards by Population Size
Population Size < 2,000 2000-4,999 5000-9,999 10,000 > Total
Number of Parishes 617 2,895 1,524 202 5,238
Population Size 899,232 10,127,379 10,074,462 3,126,224 24,227,297
Share of the Population (%) 3.7 41.8 41.6 12.9 100
The distribution of the parish population by districts and regions is indicated in Appendix A1.3. The national average parish size was 4,625 persons. The central region had the highest average parish size of 5,244 persons followed by western (4,856). The average parish size of eastern region (4,156) and northern region (4,312) were below the national average. Among districts Kampala had the highest average parish size of 12,387 persons followed by Masindi at 10,211 persons. Kumi district was the only district with its average parish size below 2,000 persons.
2.3
Population Density
The concept of population density is useful in a discussion of the carrying capacity of an area. The population density in this report is given with reference to persons per square kilometre of land area. Uganda has a total area of 241,038 square kilometres of which 197,323 is covered by land.
Table 2.4 shows that the population density of Uganda increased from 25 persons per square kilometre in 1948 to 123 persons per square kilometre in 2002. Uganda’s population density in 2002 was much higher than some of her neighbours (Tanzania – 39, Kenya – 54 and Sudan - 66) for the same year. However it was lower than that of Rwanda (281) and Burundi (243) for the same period2.
Population density was 123 persons per square km in 2002
Table 2.4: Population Density of Uganda, 1948 – 2002
Index 1948 1959 1969 1980 1991 2002
Population (Millions) 5.0 6.5 9.5 12.6 16.7 24.2
Population Density
(Persons per Sq Km) 25 33 48 64 85 123
Appendix Table A1.4 shows that the Eastern region had the highest population density of 226 persons per square kilometre in 2002 compared to Northern region which had the lowest of 62 persons per square kilometre. The population densities for Central and Western region were 176 and 126 persons per square kilometre respectively. The population density of the districts ranged from 22 persons per square kilometre for Moroto district to 7,259 persons per square kilometre for Kampala district.
The Eastern region had the highest population density (226 persons per square km)
Figure 2.4: Population density by District GULU KOTIDO LIRA MUKONO KITGUM APAC MASINDI MBARARA ARUA PADER MOROTO HOIMA BUGIRI RAKAI KALANGALA LUWERO MPIGI MUBENDE KAMULI MASAKA KUMI KATAKWI KIBOGA KIBAALE NEBBI SOROTI KASESE BUSHENYI MAYUGE KYENJOJO WAKISO YUMBE IGANGA ADJUMANI PALLISA NAKASONGOLA KABALE TORORO KAMWENGE BUNDI -BUGYO NTUNGAMO JINJA BUSIA KAMPALA NAKAPIRIPIRIT 28 41 29 54 256 74 22 112 47 95 27 88 65 121 116 98 117 59 96 284 156 120 245 69 191 217 139 180 79 317 151 155 160 545 305 115 106 328 192 330 200 211 281 111 109 534 164 266 325 324 587 7259 106 SIRONKO KAPCHORWA MBALE KAYUNGA KABERAMAIDO MOYO 115 KABAROLE KANUNGU KISORO 41 SEMBABULE RUKUNGIRI 192 22 - 74 75 - 139 140 - 217 218 - 330 331 - 587 588 - 7259 Persons per Sq.Km
National Population Density=123 Persons per sq.Km N
2.4
Population growth
Population growth is the change in the population over time. It is brought about by additions (due to births), deductions due to deaths or the net effect of migration. However, natural increase, the excess of births over deaths is the major source of population change.
2.4.1 Growth of the Total Population
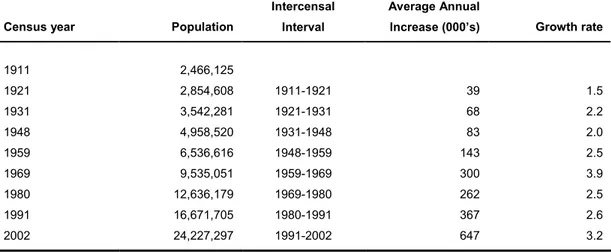
Between 1911 and 1921 the population of Uganda increased from 2.5 to 2.9 million an increase of 0.4 million persons in ten years portraying an average annual population growth rate of 1.5 percent (Table 2.5). The national average population growth rate increased by 0.7 percentage points to 2.2 percent points during the period 1921-1931 decreasing to 2.0 percent during 1931-1948 and rising again to 2.5 percent for 1948-1959. The highest average annual growth rate of 3.9 percent is observed during the intercensal period 1959-1969.
Table 2.5: Population size, Inter-censal Population increases and average annual growth rates, 1911-2002
Census year Population
Intercensal Interval
Average Annual
Increase (000’s) Growth rate
1911 2,466,125 1921 2,854,608 1911-1921 39 1.5 1931 3,542,281 1921-1931 68 2.2 1948 4,958,520 1931-1948 83 2.0 1959 6,536,616 1948-1959 143 2.5 1969 9,535,051 1959-1969 300 3.9 1980 12,636,179 1969-1980 262 2.5 1991 16,671,705 1980-1991 367 2.6 2002 24,227,297 1991-2002 647 3.2
Uganda’s population grew at an average annual rate of 3.2 percent during the period 1991 to 2002. This was the second highest inter-censal growth rate in Uganda. If the average annual growth rate is maintained at 3.2 percent, Uganda’s population will double by the year 2024.
The average annual population growth rate of the Ugandan population of 3.2 percent
The average annual Population growth rate between 1991-2002 was 3.2 %
population growth rate of the Africa’s population was 2.1 percent and that of the World was 1.3 percent3.
2.4.2 Age and sex specific Average annual Population growth rates
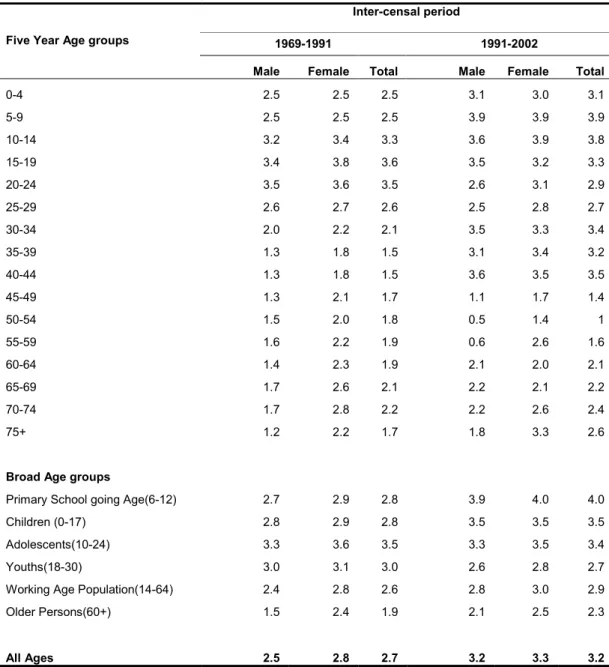
Table 2.7 presents Age-Sex specific growth rates for the inter-censal periods 1969-1991 and 1991-2002. During the period 1991-2002 many five year age groups experienced a population growth rate of more than 3 percent while for the period 1969-1991 only three (10-14, 15-19 and 20-24) age groups recorded that rate. The average annual growth rate for the period 1991-2002 was 0.5 percent points more than that for the period 1969-1991. The table also indicates that while for the period 1969-1991 the average annual population growth rate was highest for the age group 15-19 at 3.6 percent, for the inter-censal period 1991-2002 the peak was in the age group 5-9 at 3.9 percent. The results also show that the specific growth rates for the period 1969-1991 were consistently higher than for 1991-2002 for either sex. In addition the growth rates at young broad Ages were higher than at old Ages.
Table 2.6: Age and sex specific Average annual Population growth rates (1969-2002)
Inter-censal period
1969-1991 1991-2002
Five Year Age groups
Male Female Total Male Female Total
0-4 2.5 2.5 2.5 3.1 3.0 3.1 5-9 2.5 2.5 2.5 3.9 3.9 3.9 10-14 3.2 3.4 3.3 3.6 3.9 3.8 15-19 3.4 3.8 3.6 3.5 3.2 3.3 20-24 3.5 3.6 3.5 2.6 3.1 2.9 25-29 2.6 2.7 2.6 2.5 2.8 2.7 30-34 2.0 2.2 2.1 3.5 3.3 3.4 35-39 1.3 1.8 1.5 3.1 3.4 3.2 40-44 1.3 1.8 1.5 3.6 3.5 3.5 45-49 1.3 2.1 1.7 1.1 1.7 1.4 50-54 1.5 2.0 1.8 0.5 1.4 1 55-59 1.6 2.2 1.9 0.6 2.6 1.6 60-64 1.4 2.3 1.9 2.1 2.0 2.1 65-69 1.7 2.6 2.1 2.2 2.1 2.2 70-74 1.7 2.8 2.2 2.2 2.6 2.4 75+ 1.2 2.2 1.7 1.8 3.3 2.6
Broad Age groups
Primary School going Age(6-12) 2.7 2.9 2.8 3.9 4.0 4.0 Children (0-17) 2.8 2.9 2.8 3.5 3.5 3.5 Adolescents(10-24) 3.3 3.6 3.5 3.3 3.5 3.4 Youths(18-30) 3.0 3.1 3.0 2.6 2.8 2.7 Working Age Population(14-64) 2.4 2.8 2.6 2.8 3.0 2.9 Older Persons(60+) 1.5 2.4 1.9 2.1 2.5 2.3
All Ages 2.5 2.8 2.7 3.2 3.3 3.2
The high growth rates in young ages are typical of young populations partly due to high levels of fertility (the TFR for Uganda is 7.0 children per woman). Low levels of growth rates for the age groups for the years 45-49 up to 55-59 are observed for the total population during the inter-censal period 1991-2002.
2.4.3 Regional and District growth rates
The growth in the population of districts is brought about by natural increase as well as the net effect of migration (internal and international). Appendix Table A1.4 shows that the Central region had the highest average annual growth rate of the population during the period 1980-1991 and the lowest for 1991-2002. Only four of the 13 districts of central region had a population growth rate above the national average in 1991-2002, contributing to the growth rate of the region to be below the national average by 0.6 percent points. Western Region also had `an average population growth rate which was below the national average. The high population growth rate for northern region of 4.2 percent for 1991-2002 can be partly explained by the returning of residents of the region especially to districts of West Nile sub-region.
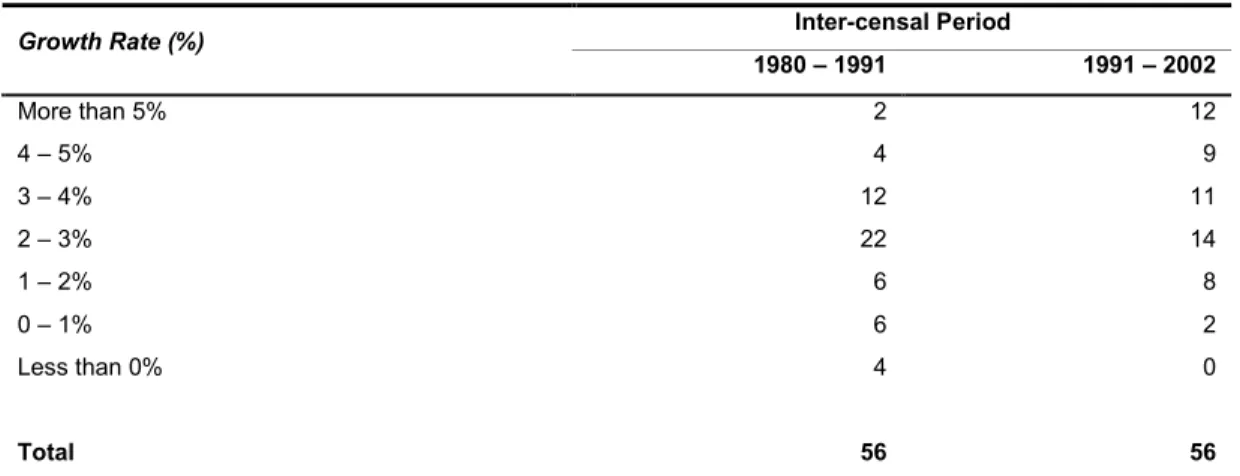
During the intercensal interval 1980-1991, Kalangala and Adjumani districts experienced a high population growth rate of above 5.0 percent. However for 1991-2002, 12 districts experienced growth rates of above 5.0 percent consisting of one from Central region, 2 from Eastern and Northern regions and 7 from Northern region .
Four districts had negative annual growth rates of their population during the period 1980-1991, while no district experienced a similar trend in 1991-2002. All the four districts which experienced a negative average annual population growth rate for 1980-1991, had more than the average national population growth rate during 1991-2002.
Table 2.7: Distribution of Districts by Growth Rates, 1980 - 2002
Inter-censal Period Growth Rate (%) 1980 – 1991 1991 – 2002 More than 5% 2 12 4 – 5% 4 9 3 – 4% 12 11 2 – 3% 22 14 1 – 2% 6 8 0 – 1% 6 2 Less than 0% 4 0 Total 56 56
The results also indicate that during the period 1991-2002 the population of the districts of Kalangala, Adjumani, Moyo and Yumbe more than doubled.
12 districts had high growth rates of above 5.0 percent
Figure 2.3: Average annual Population growth rates by District, 2002
Overall 36 districts experienced a higher growth rate during 1991-2002 compared to 1980-1991 resulting in the increase in the national population growth rate over the period.
2.4.4 Population growth rates by Citizenship
The Ugandan and non-Ugandan population grew annually at an average of 2.7 and 0.6 percent respectively between 1969-1991. This is indicated in Figure 2.4
Figure 2.4: Population Growth Rates by Citizenship and Intercensal interval
On the other hand, while the Ugandan population grew at an average of 3.3 percent between 1991 and 2002, there was a negative growth of the non-Ugandan population (-0.7 percent) within this period. The growth of the two segments of the population therefore has been following different patterns during the period of interest. The population growth rate of Ugandans has always been higher than that of the non-Ugandans and because of the big size of this population in the country; it has had a big impact on the population growth rate of Uganda.
2.5
Summary
The Population of Uganda increased from 5 million in 1948 to 24 million in 2002 an increment of about 5 times in about half a century. The Central region had the largest share of the population in 2002 although its share decreased by 2 percentage points from 29 percent in 1991 to 27 percent in 2002. However the Northern region which was the least populated region gained by 2 percent points from 19 percent in 1991 to 21 percent in 2002. Two districts of Kampala and Mbarara had populations above one million in 2002.
The 1991-2002 average annual growth rate of 3.2 percent was the second highest
2.7 3.3 0.6 -0.7 2.5 3.9 7.1 0.6 -2 -1 0 1 2 3 4 5 6 7 8 1948-1959* 1959-1969* 1969-1991 1991-2002
percent having been realized during 1959-1969. The Central region had the highest average annual growth rate of its population during 1980-1991 and the lowest for 1991-2002. Both the Central and Western Regions had average annual growth rates below the National average during 1991-2002. The Northern region had the highest growth of the population at 4.2 percent during the period 1991-2002. The results also indicate that the inter-census growth rate increased during the period 1980 to 2002. Between 1980 and 1991, the average annual growth rate was 2.5 percent per year which increased to 3.2 percent for 1991-2002. If the average annual growth rate is maintained at 3.2 percent, Uganda’s population will double by the year 2024.
The population density of Uganda increased from 25 persons per square kilometre in 1948 to 123 persons per square kilometre in 2002. The Eastern region had the highest population density of 226 persons per square Kilometre and Northern the lowest of 62 persons per square kilometre.
CHAPTER 3: MIGRATION
3.0
Background
Migration is the geographic movement of people across a specified boundary for the purpose of establishing a residence. Migration is therefore the movement of persons that leads to a change in their place of ‘usual residence’. Migration may be internal (within the country’s boundaries) or international (across country boundaries). The 2002 Census did not collect information on ‘Usual Residence’. Therefore, the information on ‘Place of Enumeration’ is taken as a proxy for ‘Usual Residence’.
The causes of migration are various but the most important cause of migration is economic such as searching for employment opportunities. Other causes of migration include search for agriculture land, marriage, education and disaster. The traditional cause of massive internal migration in Uganda was resettlement due to population pressure and the opening up of new areas through the eradication of vectors such as the tsetse fly. Out-migration from Kigezi region started as early as the late 1940s when a resettlement programme was initiated by the colonial Government. The Bugisu region has been the second most important source of internal migrants. Toro and Bukedi regions have respectively been the recipient areas. The decade preceding the 1991 Census was characterized by civil wars and insurgency, in Central, Eastern and Northern regions. These events led to out-migration from war affected areas and the subsequent return-migration when peace returned. The magnitude and destination of this type of return-migration is unknown4.
Another known cause of internal migration in the country was related to labour migration especially from West Nile area to the plantations and industries in Jinja. The labour migrants were mainly men, although at times they were accompanied by their families. Another labour migration stream came from the Kigezi region to Buganda region and Kabarole area. In the latter area, people were mainly going to work in tea plantations and Kilembe mines.
Movement in search of educational facilities such as colleges and universities is another cause of migration. This, together with labour migration is mainly directed towards urban areas where the required facilities are found. These movements are from different parts of the country either to the nearby town or to the major regional towns hence taking the form of rural to urban migration. Marriage also plays an important role in the migration of
females. The combination of these factors is responsible for the observed migration patterns.
3.1
Sources of data
The major sources of data for the study of internal and international migration in Uganda are the censuses. The main questions asked in a census for measuring migration are place of birth, district of enumeration, previous residence and duration of residence in the district. However the censuses conducted before 1969 had no direct question on migration and it was inferred from the race or ethnic groups of the population within a specific district. The unit of reference in this case is the district, which is the biggest administrative unit within the country. Within the district migration is therefore not discussed since the data does not provide information on such movements.
3.1.1 The 2002 Census Data
The questions which provide information on migration in the 2002 Population and Housing Census were:
Where was name born?
Where was name living before coming to this district? How long has name lived in this district continuously?
The place of birth was recorded as district if it was within Uganda and as country if it was outside Uganda. From the above questions one can study migration levels and patterns. The analysis of internal migration focuses on the district as the reference area. The information collected does not show intermediate movements, wherever they exist. The available data also cannot identify the pull and push factors responsible for the movement. Consequently, the causal factors cannot be discussed, instead, only the relationships between migration and other factors are presented.
3.1.2 Other sources of Data
Information on international migration is always collected at gazetted points of entry and exit. It is possible that in situations where border areas are porous, there may be a number of departures and arrivals that occur undetected and therefore unregistered that lend international migration figures inaccurate. Other sources of data on migration would include surveys and vital registration
3.2
Migration Characteristics of the Census Population
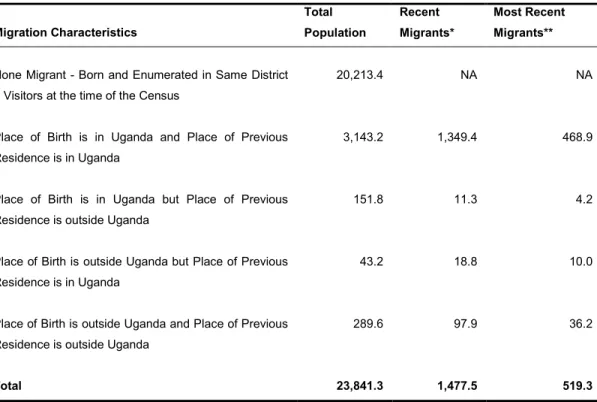
Table 3.1 gives the distribution of the total population by selected migration characteristics. The results in the table show that 84 percent of the population were enumerated in their district of birth and hence were non-migrants. The remaining 16 percent had migrated to the districts where they were enumerated.
Table 3.1: Distribution of the Population (000’s) by Migration Characteristics
Migration Characteristics Total Population Recent Migrants* Most Recent Migrants**
None Migrant - Born and Enumerated in Same District + Visitors at the time of the Census
20,213.4 NA NA
Place of Birth is in Uganda and Place of Previous Residence is in Uganda
3,143.2 1,349.4 468.9
Place of Birth is in Uganda but Place of Previous Residence is outside Uganda
151.8 11.3 4.2
Place of Birth is outside Uganda but Place of Previous Residence is in Uganda
43.2 18.8 10.0
Place of Birth is outside Uganda and Place of Previous Residence is outside Uganda
289.6 97.9 36.2
Total 23,841.3 1,477.5 519.3
* Persons whose Duration of Residence in the District is less than 5 Years; The information excludes persons whose Place of Previous Residence” was Kotido district.
** Duration of Residence in the District is less than one year
3.3
International Migration
International Migration is one of the factors that lead to a change in the size and composition of the country’s population. It has two components, namely, emigration and immigration. Emigration is the movement of people out of the country, whereas immigration is the movement of people into the country. For purposes of this Report, international migrations have been considered to involve people whose place of birth was outside Uganda.
3.3.1 Immigration
International migration plays an important role in the national and economic affairs of a country. Immigrants have often been amongst the most dynamic and entrepreneurial members of society, people who are prepared to venture beyond the confines of their community in order to create new opportunities for themselves and their dependants.
In other instances however, immigrants are viewed with cynicism. This is especially so in situations where people move to look for a future beyond their borders of abode if their countries of origin fail to provide for them adequately in terms of social services, economic and political protection. As such people have moved across international borders as having irregular status, as unskilled workers, temporary immigrants, asylum seekers or refugees and are viewed by the locals in the recipient countries as another lot that is competing for the already inadequate resources.
3.3.2 Volume of Immigrants
Table 3.2 gives the number of immigrants for the various census years categorized by sex and race. The results in the table show that there were 333,000 immigrants in 2002, and these constituted about 1.4 percent of the total population of Uganda.
The 1969 census recorded the highest number of immigrants which stood at 786,000 persons. The absolute numbers for immigrants fell from 406,000 in 1991 to 333,000 in 2002 representing a decrease of about 18 percent. The downward trend of immigrations since 1969 could be partly explained by the relative stability in Southern Sudan in the early 1990’s thus reducing on the number of refugees received compared to the late 1980’s. Other events leading to the decrease of immigrants include the return of Rwandese refugees in 1994 and expulsion of Asians in 1972
Table 3.2: Immigrants by Race and Sex, Uganda, 1948 – 2002
Year Africans Non Africans All Races
Male Female Total Male Female Total Male Female Total
1948 249.1 164.5 413.6 Na Na 41.0 Na Na 454.5 1959 402.3 280.0 682.4 46.1 40.5 86.6 448.4 320.6 769.0 1969 460.3 286.9 747.2 20.3 18.0 38.3 480.6 304.9 785.5 1991 Na Na Na Na Na Na 213.3 192.5 405.7 International Migrants constituted 1.4 % of total Population
International immigration figures have since the 1948 census been higher for the Africans compared to non-Africans. Up to the 1991 census, immigrants were dominated by males. However, in 2002, the females outnumbered the males.
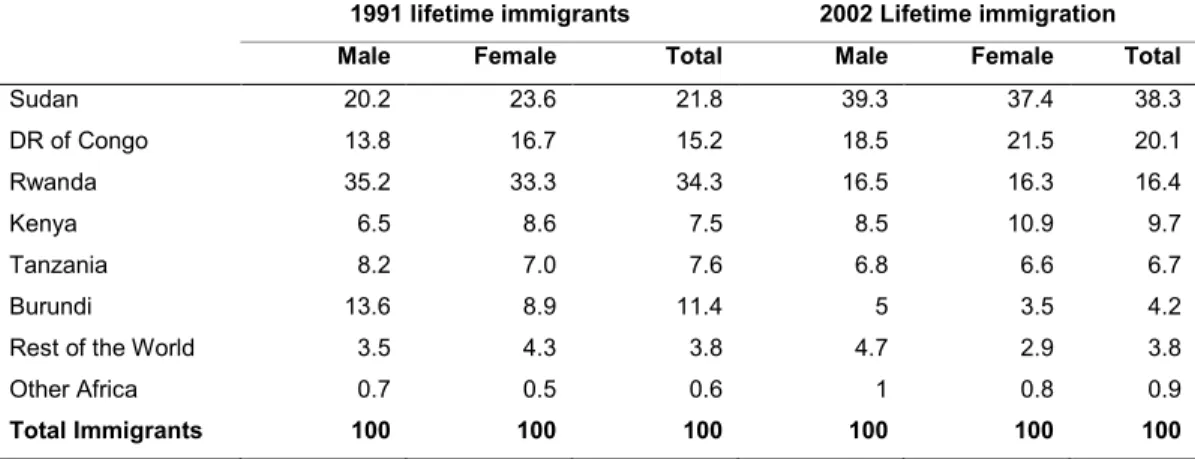
In the 1991 census, lifetime immigrants from neighbouring countries constituted 98 percent of all immigrants reducing to 95 percent in 2002. The share of other African countries increased slightly from 0.6 percent to 0.9 percent while that of non-African countries did not have any change. The pattern has remained similar to previous censuses with neighbouring countries being the dominant places of origin of lifetime immigrants in Uganda.
Table 3.3: Percent Sex Distribution of Immigrant Population by Country of birth
Rwanda was the leading provider of immigrants for both sexes in 1991, providing 34 percent of the total immigrants followed by Sudan at 22 percent. In the 2002 census, lifetime immigrants from Sudan (38 %) had overtaken those from Rwanda (16 %). Many Rwandese nationals previously residing in Uganda went back to Rwanda in 1991 and this mainly explains the decrease in lifetime immigrants from Rwanda for the intercensal period 1991 to 2002. There were no significant variations in the sex composition of immigrants especially from the neighbouring countries. Neighbouring countries tend to move largely as families hence having sex differences that are minimal. In contrast the seemingly bigger difference in sex composition for immigrants from far off countries is explained by the fact that they usually move as individuals.
3.3.3 Characteristics of Immigrants
Immigrants tend to have demographic and socio-economic characteristics that vary widely
1991 lifetime immigrants 2002 Lifetime immigration
Male Female Total Male Female Total
Sudan 20.2 23.6 21.8 39.3 37.4 38.3 DR of Congo 13.8 16.7 15.2 18.5 21.5 20.1 Rwanda 35.2 33.3 34.3 16.5 16.3 16.4 Kenya 6.5 8.6 7.5 8.5 10.9 9.7 Tanzania 8.2 7.0 7.6 6.8 6.6 6.7 Burundi 13.6 8.9 11.4 5 3.5 4.2 Rest of the World 3.5 4.3 3.8 4.7 2.9 3.8 Other Africa 0.7 0.5 0.6 1 0.8 0.9
characteristics of Lifetime immigrants including Age, Educational attainment and Economic activity by sex, Region and Residence.
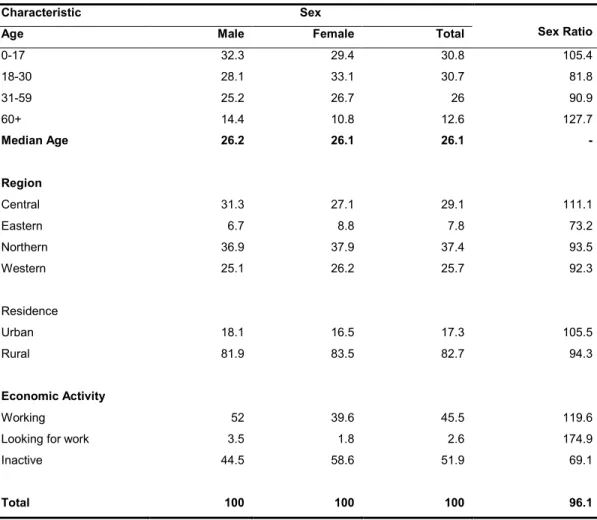
The median age of the immigrant population was 26.1 compared to the national of 15.3 years implying that the immigrant population was older than the national population. Northern region had the highest share of the immigrants with 37 percent of the immigrants staying in the region, although nationally its share of the population was the smallest. Eastern region had the smallest share of the immigrants of 8 percent. The very high number of the immigrants staying in Northern region can be partly explained by the proximity of Sudan and DRC to the Northern region since they were the top two Countries where Uganda was receiving the immigrants from partly due to insecurity in these countries. These constituted more than half of all Lifetime Immigrants. The proportion of the immigrant population staying in urban areas of 17 percent was higher than the national of 12 percent partly due to the tendency of some immigrants (especially the business oriented) preferring urban areas to rural ones.
The sex ratios for various economic activity categories above imply that more male immigrants were economically active compared to their female counterparts, while the inactive population was composed of more females than males.
Table 3.4: Immigrants by Selected characteristics
Characteristic Sex
Age Male Female Total Sex Ratio
0-17 32.3 29.4 30.8 105.4 18-30 28.1 33.1 30.7 81.8 31-59 25.2 26.7 26 90.9 60+ 14.4 10.8 12.6 127.7 Median Age 26.2 26.1 26.1 - Region Central 31.3 27.1 29.1 111.1 Eastern 6.7 8.8 7.8 73.2 Northern 36.9 37.9 37.4 93.5 Western 25.1 26.2 25.7 92.3 Residence Urban 18.1 16.5 17.3 105.5 Rural 81.9 83.5 82.7 94.3 Economic Activity Working 52 39.6 45.5 119.6
Looking for work 3.5 1.8 2.6 174.9
Inactive 44.5 58.6 51.9 69.1
Total 100 100 100 96.1
3.3.4 Recent International Migration
Recent international migrants are defined as persons whose “Place of Birth” was outside Uganda and “Place of Previous Residence” was outside Uganda and had lived in the district for less than five 5 years. The 2002 Census did not collect data on emigration (movement of people to outside countries). Therefore, it is not possible to estimate the magnitude and direction of net international migration.
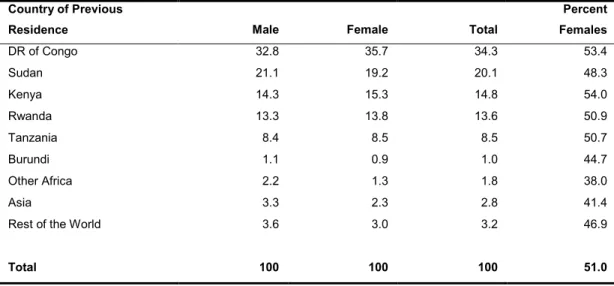
Table 3.5 gives the distribution of recent immigrants by country of origin and their sex composition. Out of the 333,000 immigrants, about one third (98,000) were recent immigrants. The majority of immigrants in 2002 came from six neighbouring countries and these constituted 92 percent of all recent immigrants. The pattern has remained similar to previous censuses with neighbouring countries being the dominant places of origin of immigrants into Uganda. More than one third of the recent immigrants were from Democratic Republic of Congo (DRC) while 20 percent were from Sudan. There were no
More than 1/3 of the recent immigrants were from DRC
with the share of females close to 50 percent while there were variations in sex ratios of immigrants from countries not neighbouring Uganda.
Table 3.5: Distribution of Recent Immigrants by Country of Previous Residence
Country of Previous
Residence Male Female Total
Percent Females DR of Congo 32.8 35.7 34.3 53.4 Sudan 21.1 19.2 20.1 48.3 Kenya 14.3 15.3 14.8 54.0 Rwanda 13.3 13.8 13.6 50.9 Tanzania 8.4 8.5 8.5 50.7 Burundi 1.1 0.9 1.0 44.7 Other Africa 2.2 1.3 1.8 38.0 Asia 3.3 2.3 2.8 41.4
Rest of the World 3.6 3.0 3.2 46.9
Total 100 100 100 51.0
Table 3.6 below presents selected characteristics of recent immigrants. The recent immigrant population was older than the national population as revealed by a median Age of 19.1 years against 15.3 years. The Western region had the highest proportion of recent immigrants. Similarly the proportion of the recent immigrants staying in urban areas of 26 percent was more than two times the national average of 12 percent. The results also reveal that 56 percent of the recent immigrant population was involved in subsistence farming against the national average of 71 percent.
Table 3.6: Selected Characteristics of Recent Immigrants
3.4
Internal Migration
The 2002 Census revealed a total of 23 million persons who were born in Uganda. Of these 3.1 million (equivalent to 13 percent) were enumerated outside their district of birth and hence classified as internal migrants. These were almost equally distributed between sexes. Because of changes in the boundaries of districts (which are the migration defining areas) between any two censuses, no comparison with the findings from the previous censuses is made.
A Recent Internal Migrant is defined as a person who was born in Uganda; the previous residence was within Uganda and at the time of the Census had stayed in the district for a
Selected Characteristic Male Female Both Sexes Sex Ratio
Age 0-17 46.6 45.2 45.9 101.4 18-30 29.8 36.2 33 80.8 31-59 21.1 16.1 18.6 128.4 60+ 2.5 2.4 2.5 103.9 Median Age 19.1 19 19.1 - Region Central 29.3 26.6 27.9 108.4 Eastern 10.4 12.7 11.6 80.1 Northern 23.2 22.6 22.9 100.8 Western 37.2 38.1 37.6 96.1 Residence Urban 27.1 24.6 25.8 108.8 Rural 72.9 75.4 74.2 95.0 Activity Status Working 57.9 38.2 47.9 146.6
Looking for work 5.0 2.8 3.9 169.3
Inactive 37.1 59.0 48.3 60.9
Occupation
Engaged in Subsistence Farming 47.6 67.3 55.7 103
Uganda 100 100 100 98.4
13 % of Uganda born population was internal migrants
Out of all the lifetime internal migrants, 41 percent (1.3 million persons) were recent internal migrants. These constituted about six percent of the total population.
3.4.1 Volume and Distribution of Recent Internal Migrants
This sub-section deals with the volume, migration streams and the spatial distribution of recent internal migrants in Uganda. The spatial distribution of internal migrants is determined by the different pull and push factors in the destination and source district respectively. As already observed, these are mainly socio-economic, whereby mainly the rural to rural migrants are attracted by availability of land for agriculture and favourable climate, while the rural to urban migrants are attracted by several factors ranging from employment to education. Of recent, social strife especially in the Northern region has forced people from villages to internally displaced peoples camps, others have migrated to neighbouring districts and urban centres.
Table 3.7 shows that recent female migrants outnumbered the male migrants with a sex ratio of 95 males per 100 females. More of the recent migrants (66 percent) were enumerated in urban areas than in rural areas (34 percent).
Table 3.7: Distribution of Recent Migrants by Residence and Sex
Male Female Both Sexes Sex
Place of
Residence No. (‘000s) Percent No. (‘000s) Percent No. (‘000s) Percent Ratio
Urban 218.5 33.3 241.0 34.8 459.5 34.1 90.7 Rural 438.6 66.7 451.2 65.2 889.9 65.9 97.2 All Areas 657.2 100 692.2 100 1,349.4 100 95.0
Table A1.2 shows that the Central region had the biggest share (57 percent) of the recent internal migrants in the country followed by the Western region (20 percent) while the Northern region had the least share of only eight percent of the recent internal migrants. The table further shows that Kampala City had the biggest percentage of internal migrants (18 percent) while Hoima District the least of 1.5 percent. This high share of Kampala is attributed to the urban nature of Kampala City, which attracts in-migrants with the hope of improving their livelihood and getting employment opportunities. Although the volume of migrants in 2002 increased in absolute numbers compared to 1991, the percentage fell from 17.7 in 1991 to 14.3 in 2002.