1. ABSTRACT
It is well-known that TCP performance may
degrade over paths that include wireless links,
where packet losses are often not related to
congestion. We examine this problem in the
context of the GSM digital cellular network,
where the wireless link is protected by a
reliable link layer protocol. We propose the use
of multi-layer tracing as a powerful
methodology to analyze the complex protocol
interactions between the layers. Our
measurements show that TCP throughput over
GSM is mostly ideal and that spurious
timeouts are extremely rare. The multi-layer
tracing tool we developed allowed us to identify
the primary causes of degraded performance:
(1) inefficient interactions with TCP/IP header
compression, and (2) excessive queuing caused
by overbuffered links. We conclude that link
layer solutions alone can solve the problem of
“TCP over wireless links”. We further argue
that it is imperative to deploy active queue
management and explicit congestion
notification mechanisms in wide-area wireless
networks; which we expect will be the
bottleneck in a future Internet.
1.1 Keywords
Wireless, GSM, TCP, measurement tools.
2. INTRODUCTION
New communications technology coupled with increasingly sophisticated applications is yielding communications systems that are more complex than previous generations. These systems often comprise multiple protocols running at the physical, link, transport, and application layers. By itself, each protocol is mostly well understood and supported by a range of verification, conformance testing, and performance measurement tools. Interactions between different protocols, however, often remain undiscovered usually due to the lack of appropriate analysis tools. Examples of such protocol interactions include competing error recovery between multiple layers of Automatic Repeat reQuest (ARQ) protocols, delays caused by packet routing dynamics and their impact on transport layer protocols [18], and the use of the HyperText Transport Protocol (HTTP) on top of a single versus multiple TCP [20] connections. In this paper, we present the design of a multi-layer measurement platform and an analysis tool, called
MultiTracer, for studying the interactions between three
different protocols. The first protocol is RLP [7], a reliable link layer protocol deployed in the GSM digital cellular telephone network [15]. The second protocol is a TCP/IP header compression protocol [9] commonly used with IP [19] framing protocols like PPP [22]. The third protocol is the reliable transport protocol TCP [20].
We used existing TCP monitoring tools [10], [17] and developed a new monitoring tool for RLP. These tools were used to log detailed information about the connection state of TCP and RLP both at the sender and receiver on both protocol layers. In addition we developed MultiTracer which provides the ability to visualize the information correlated in time and at multiple levels of detail. We have collected detailed traces representing a variety of mobile data uses (e.g., stationary indoors, walking, driving, etc.). In this paper, we provide several examples of how we have used MultiTracer to analyze protocol interactions.
Our analysis is focused on studying potentially inefficient interactions between TCP and RLP during bulk data transfers. While we show that competing error recovery is not a problem, our multi-layer tracing approach allowed us to detect some unexpected results. Firstly, we observe the negative impact that overbuffered links has on end-to-end performance. Secondly, RLP link resets lead to large
Multi-Layer Tracing of TCP over a Reliable Wireless Link
Reiner Ludwig
Ericsson Research Herzogenrath, GermanyBela Rathonyi
Ericsson Mobile Communications AB Lund, Sweden
Almudena Konrad, Kimberly Oden, Anthony Joseph
Computer Science DivisionUniversity of California at Berkeley
amounts of data being lost due to an interaction with the TCP/IP header compression algorithm; a problem that is aggravated by overbuffered links. These results emphasize the need for experimental measurements as an important analysis methodology because measurements often expose effects that may not be visible using simulations alone (e.g., errors or differences between the implementations used for experiments and simulations). While we demonstrate that MultiTracer considerably reduces the time to post-process and analyze measurement data, the process of gathering the measurements is still a time intensive task. Moreover, measurement-based analysis is not possible for networks that are still in the design phase. We therefore plan to combine MultiTracer with simulation tools to leverage of our base of collected measurement data for trace replay in simulators of future wireless networks.
The rest of this paper is organized as follows: Section 3 provides background information about TCP and data transmission in the GSM network; Section 4 describes the multi-layer measurement platform, the MultiTracer tool, and the trace collection methodology; Section 5 presents our measurement results and their analysis; and Section 6 discusses our conclusions and plans for future research.
3. BACKGROUND: TCP OVER GSM
In this paper, we examine the interactions between the Transmission Control Protocol (TCP) and the Radio Link Protocol (RLP), as implemented in GSM (Global System for Mobile communications). In this section, we present a brief background on all involved technologies. More detail on GSM and some additional information on RLP can be found in [15]. A comprehensive description of TCP is given in [23].
3.1 Data Transmission in GSM
Unlike earlier analogue cellular systems, data services are an integral part of a GSM network and are equally supported together with ordinary voice services.
Figure 1 (taken from [14]) shows the basic components used for circuit-switched data transmission in GSM. A mobile host, a laptop or palmtop, is connected to the GSM network
using a GSM mobile phone (Mobile Station or MS) and a device (e.g. a PCMCIA card) running the Terminal Adaptation Function (TAF). Note that unlike in first generation analogue cellular systems, the TAF is not a modem. The modem resides in the network, in the Interworking Function (IWF) of the Mobile Switching Centre (MSC). Optionally, a fully reliable link layer protocol called the Radio Link Protocol (RLP) can be run between the TAF and the IWF, which is also referred to as using the non-transparent data service. RLP remains terminated in the same IWF for the duration of a data call, which insures reliability in the event of cell handovers. The maximum data rate over the air-interface is 9.6 kbit/s synchronous (i.e., 1200 bytes/s). An additional protocol called the L2R (Layer 2 Relay) protocol is used by the non-transparent data service for flow control, framing and communicating status control signals between the TAF and the IWF. The design of the radio interface and other aspects of the transmission chain are not relevant to this paper. Additional details about how this architecture is being enhanced to support higher bandwidth and direct Internet access is provided in [14].
3.2 The Radio Link Protocol
The Radio Link Protocol (RLP) [7] is a full duplex HDLC-derived logical link layer protocol. It uses selective reject (SREJ) and a checkpoint recovery mechanism for error recovery. The frame size is constant (30 bytes) and strictly aligned to the GSM radio block size that is used as basis for channel coding. The user data length of each RLP frame is 24 bytes and a frame is transmitted/received each 20 ms, yielding a user data rate of 1200 bytes/s. RLP transports user data as a transparent byte stream (i.e., RLP has no notion of what a PPP frame or an IP packet is).
It is important to point out that although RLP is said to be fully reliable, data loss can occur when the link is reset. This can have a severe impact on higher layer protocols as outlined in Section 5.3. The link is reset if a RLP frame could not be successfully transmitted after a certain number of retransmissions1 or in cases of protocol violations. When a link reset occurs, the RLP sender and receiver reset their sequence numbers and flush (!) their transmit and receive buffers. More detail on RLP and proposed modifications to make RLP flow-adaptive can be found in [14].
3.3 The Transmission Control Protocol
The Transmission Control Protocol (TCP) [20] is a byte-stream oriented reliable transport layer protocol. TCP transmits the application layer data stream in terms of
segments, which at IP layer are called packets. The receiver
generates an acknowledgment (ACK) for every segment - or every other segment if the delayed-ACK mechanism is used - but only if it was received correctly (i.e., the receiver does not provide feedback on segments received in error). ACKs
GSM MSC/IWF B T S PSTN Internet R e m o t e Host Mobile Host ISP T A F B S C 64 kb/s 64 kb/s 16 kb/s L 2 R R L P IP T C P IP P P P T C P L 2 R R L P V.42 V.32 IP P P P V.42 V.32 F E C Inter-leave F E C 9.6 kb/s Inter-leave Air Interface M o d e m Pools 0 1 2 3 4 5 6 7 0 1 2 7 1 RX 5 6 7 0 1 2 3 4 5 6 7 4 1 TX Relay M S
Figure 1. TCP/IP over GSM Circuit-Switched Data (CSD).
1.The maximum number of retransmissions is determined by the protocol parameter N2, which is negotiated at call setup. The de-fault value of 6 can be configured through an AT command.
are cumulative. They tell the sender up to which sequence (byte) number data has been correctly received in-order;
duplicate ACKs (DUPACK) are generated for every
segment received out-of-order.
Two mechanisms have been specified for error recovery: a timeout mechanism and the fast retransmit algorithm [11]. In the latter case, the sender does not wait for a timeout, but rather retransmits an outstanding segment upon receipt of three DUPACKs for the same sequence number. The retransmission timer maintained at the sender is adaptive to the end-to-end round-trip time (RTT) and the variation thereof.
Senders on a shared best-effort network, like the Internet, must implement congestion control [11] to ensure network stability. A TCP sender uses “packet loss” as an implicit signal for congestion with the assumption that packet loss caused by damage is rare. TCP distinguishes between packet loss indicated by a timeout or indicated by the receipt of three DUPACKs. As long as neither of these two signals is received, a TCP sender probes for bandwidth, i.e., it continuously increases the load onto the network. During the slow-start phase at the beginning of each connection and after each timeout, the load is doubled every RTT. During the congestion avoidance phase, the load increases linearly at one Maximum Segment Size (MSS) per RTT. A sender is never allowed to have more packets outstanding than the minimum of the window advertised by the receiver and the sender-side congestion window (denoted
W
in the diagram shown in Figure 2). This minimum corresponds to the load a sender is allowed to put onto the network per RTT. Thegraph in Figure 2 exemplifies how the offered load increases and decreases over the duration of a connection, assuming that the connection is network-limited (i.e., the congestion window alone limits the offered load). Note that in the diagram in Figure 2, “Threshold Reached” is an internal event at the sender and the unlabeled arrows indicate that a load decrease phase is immediately followed by a load increase phase. A comprehensive discussion and explanation of TCP can be found in [23].
The minimum amount of data a TCP sender needs to have in transit to fully utilize its share of bandwidth at the bottleneck link is called the pipe capacity. The amount of data the sender queues at the bottleneck link is called the
pipe queue. The sum of pipe capacity and pipe queue is
referred to as the connection’s bandwidth/delay product. Note that a network-limited sender can only estimate the bandwidth/delay product of the connection. In general, the sender has no way to separately estimate either the pipe capacity or the pipe queue. Also note that the pipe capacity is usually not fixed, but may vary considerably over the duration of a connection, e.g., depending on cross traffic from other connections sharing the bottleneck link.
4. MULTI-LAYER TRACING
In this section, we first explain the trace-based methodology that was used to collect measurements. We then describe the measurement platform and tools that were used. Subsequently, we argue why utilization is the performance metric that allows to identify inefficient protocol interactions. We conclude the section by explaining how we correlate and interpret various trace events on different layers.
4.1 Methodology
Performance measurements involving radio links add a complex dimension to the characteristics with which links are usually described. In addition to the simpler parameters of link bit rate and link latency, the error characteristics play a crucial role. The analysis of such measurements raises three main problems:
• How to define the target radio environment? • How to setup or find the target radio environment? • How to reproduce the target radio environment? When defining a target radio environment, one is often interested in looking at the typical case, but what is a “typical radio environment”? Many factors contribute to the error characteristics of the link: terrain (buildings, hills, vegetation), speed of the user of the mobile host (stationary, walking, driving), interference-level from cross-traffic, etc. Defining the “typical case” is itself a challenge, although certain profiles have been defined for this purpose [6]. However, setting up or finding a specific target radio environment for measurement purposes is close to impossible. Even repeated stationary measurements in an identical location will often yield completely different results. 0 8 16 24 1 6 11 16 21 26 31 Time (k x RTT) Offered Load (n x MSS) Pipe Queue 3rd DUPACK
3rd DUPACK 3rd DUPACK Timeout
Threshold Reached Pipe Capacity Fast Recovery W ← 1/2 W Slow-Start W ← 2 × W per R T T Congestion Avoidance W ← W + 1 per R T T T i m e o u t Reset W ← 1 Threshold Reached 3 r d D U P A C K (Fast Retransmit) 3 r d D U P A C K (Fast Retransmit) Connect T i m e o u t
We are not interested in identifying those radio related factors that determine a particular observed error pattern. Instead, we are interested in their aggregate effect on protocol operations; in particular, those that lead to interactions between link layer and transport layer protocols. Therefore, we followed the more pragmatic approach of trace-based mobile network emulation as proposed in [16]. Traces were collected at both the link and transport layers. Link layer traces deliver information down to the level of whether an FEC (Forward Error Correction) encoded radio block, which in the case of GSM is equivalent to an RLP frame, could be decoded successfully or had to be retransmitted. The data we collected is used to analyze multi-layer protocol interactions. We chose two categories of radio environments:
• Environments with good signal strength (4 hours). • Environments with poor signal strength (2 hours). Overall, we captured six hours of traces that we used for our analysis in Section 5. Four hours were measured with good and two hours with bad signal strength. Although in most of our measurements the mobile host was stationary, we also measured while walking (indoor and outdoor) or driving in a car. The method we used to determine the signal strength is rather primitive. The receiver’s signal strength is determined using the mobile phone’s visual signal level indicator. In addition, we had a second mobile phone that we used for voice calls and the perceived voice quality2 was also used as an indicator for the quality of the radio link. In the future, we plan to use internal signal strength measurements from the mobile phone. Most of the measurements were carried out in the San Francisco Bay Area. In addition, we have collected traces at other places in the U.S. and also in Sweden and Germany. Nevertheless, apart from the effects mentioned in Section 5.5, we did not find any differences between the various countries, or more precisely, between the manufacturers of the GSM network components and the frequencies used for operation. It is important to point out that, as reported in [13], we also had situations where the GSM call, i.e., the physical connection, was dropped during a measurement. In almost all cases, this happened when the receiver signal was very low. Apparently, radio coverage was insufficient in those environments. As this data would have introduced an unrealistic bias into our analysis, we excluded those traces.
4.2 Measurement Platform and Tools
The architecture of the system that we have developed for measurement collection is depicted in Figure 3. The gray shaded areas indicate components that have already been implemented. A single hop network (e.g., a PPP link) connects the mobile to the fixed host. Since we wanted to isolate the TCP/RLP interactions, no additional hops were
included. Thus, the fixed host terminates the circuit-switched GSM connection. In the future, we will use a stand-alone GSM basestation in conjunction with a dedicated gateway that is being developed in the context of the ICEBERG project [24]. The gateway “translates” between circuit-switched and IP-based packet-switched voice and data traffic. For that purpose, we are currently implementing the network-side of RLP which will be terminated in the gateway. However, for the measurements presented in Section 5, we instead used publicly available GSM networks for which the network-side of RLP was not accessible. Hence, a setup like the one shown in Figure 1 was installed with a standard modem in the fixed host terminating the circuit-switched connection. While any traffic generation tool could have been used for our measurements, we were only interested in the performance of bulk data transmission. Thus, we used the sock tool described in [23].
To trace TCP at the sender and receiver, we used tcpdump [10] and tcpstats [17]. tcpdump monitors a host’s interface I/O buffers and generates a single log file containing a timestamp specifying when a packet3 was placed into the buffer and the packet header itself. As shown in Section 5, the data generated by tcpdump can be used to generate time/sequence plots from which it is possible to derive a lot of useful information about the connection’s progress at any point in time. Although it might in some cases be reverse engineered, tcpdump does not provide information about the TCP sender state variables, such as the congestion window, the slow start threshold, and the retransmission timeout value. We therefore used tcpstats, a UNIX kernel instrumentation tool that traces these TCP sender state variables.
2.GSM uses a different FEC and interleaving scheme for voice than for data. Still perceived voice quality is a valid indicator of the quality of the radio link.
3.More precisely, a frame as tcpdump is implemented at the link
layer and also logs link layer headers. F i x e d H o s t U N I X ( B S D i 3 . 0 ) T C P M u l t i T r a c e r T r a c e R e p l a y i n S i m u l a t o r (e.g. ns, BONeS) R L P R L P D U M P T C P D U M P R L P D U M P G S M B a s e s t a t i o n B T S I P B a c k e n d M o b i l e H o s t U N I X ( B S D i 3 . 0 ) T C P D U M P T C P S T A T S T C P S T A T S Plotting T o o l (e.g. xgraph) Traffic S o u r c e / S i n k (e.g. sock) Traffic S o u r c e / S i n k (e.g. sock)
To collect and correlate TCP and RLP measurements, we ported the RLP protocol implementation of a commercially available GSM data PC-Card (Ericsson DC23) to BSDi3.0 UNIX. In addition, we instrumented the RLP code to log connection related information in the fashion of tcpdump/
tcpstats. Thus, rlpdump logs time/sequence
information and also exceptional events, like SREJs, retransmissions, flow control signals (XON/XOFF) and RLP link resets in both the send and the receive direction. Altogether tcpdump, tcpstats and rlpdump generate a total of up to 300 bytes/s of trace data for a connection that is running at about 10 kb/s. It was therefore essential to develop a post-processing tool that enabled the rapid correlation and representation of collected trace data in a comprehensive graphical manner for trace analysis. We call this tool MultiTracer. MultiTracer is a set of script files that converts the trace data into the input format required by a plotting tool [25]. At a later stage, we plan to use MultiTracer to also generate input for trace replay in a simulation environment. Using MultiTracer in this manner, we will be able to reproduce various effects that were measured in reality. The MultiTracer script files and some example dump files, including the ones used throughout this paper are available for download from [24].
4.3 Target Metrics
The main focus of our analysis was to study potential protocol interactions between TCP and RLP during bulk data transfers. We were only interested in “stable” connections that lasted long enough to allow for all TCP sender state variables (e.g. retransmission timer, slow-start treshold, etc.) to converge from their initialization values to a stable range of operation. We therefore performed a series of large bulk data transfers ranging in size from 230 KBytes to 1.5 MBytes. In Section 5.1 we report on the throughput that TCP achieved in those measurements. However, throughput itself is not sufficient information to determine whether TCP and RLP interacted in an inefficient way or not. For example, a throughput of one half of the theoretical maximum could either mean that the radio conditions were so poor that RLP had to retransmit every other frame or it could indicate competing error recovery between TCP and RLP (the latter was never the case as shown in Section 5.4).
Utilization is the key performance metric that can be used to
determine whether a data transfer suffered from inefficient TCP/RLP interactions or not. If the TCP sender fully utilizes the bandwidth provided by RLP (which may vary over time due to RLP retransmissions) with useful data then this indicates optimal performance (100 percent utilization) and rules out inefficient interactions between the two protocols. There are only 2 ways that utilization may not be optimal: (1) the TCP sender leaves the link (RLP) idle, or (2) the TCP sender transmits the same data multiple times. Hence, after each measurement MultiTracer checks for these two cases and determines whether utilization was optimal or not. To check for the first case, we use rlpdump to determine idle phases at the RLP sender. The tcpdump traces are used to determine how many bytes the TCP
sender transmitted multiple times. We used MultiTracer to isolate the traces where utilization was 95 percent or less. We then further investigated those traces to identify the causes of the degraded performance (see Section 5.3). The utilization results of all bulk data transfers are presented in Section 5.1. Note that utilization can never be exactly 100 percent because of TCP’s initial slow-start phase and the 3-way handshake required for both TCP connect and disconnect. In this study, the effect of slow-start is negligible because the pipe capacity is already reached with 2-3 segments, even when using a small MSS. Also, these effects are amortized when performing large bulk data transfers (as done here). Measuring utilization has the added advantage that it is independent of protocol overhead. Thus, parameters like the Maximum Transmission Unit (MTU) configured for PPP, the PPP framing overhead, and whether header compression was used or not, do not affect utilization as defined above.
There are various other metrics one could study with the platform depicted in Figure 3. In [2], [13], [14] the response
time was studied, which is fairly high in this network due to
the high latency of the GSM link (roughly 500ms [14]). This latency degrades the performance of interactive traffic, e.g., the PPP link establishment phase [14] or transactional application layer traffic [2], [13]. For example, HTTP/1.0 uses a separate TCP connection for each object it transfers. As such, performance degrades significantly, especially for connections with large RTTs, since both the TCP connect and disconnect each requires a 3-way handshake. However, in this paper, we were only concerned with utilization as a target performance metric.
4.4 How to Read Time/Sequence Plots
Before we discuss more complex plots in which we correlate multiple traces we want to briefly explain a simpler plot of a single TCP trace.
Figure 4 shows a TCP sender-side time/sequence plot. Data segments are shown by plotting the sequence number of the first byte contained in a segment. In TCP each byte of a connection is identified by a unique sequence number. Thus, the difference between two succeeding segments typically4 indicates the Maximum Segment Size (MSS) that was used for this connection. An ACK is shown by plotting the next sequence number the TCP receiver expects to receive. Due to the self-clocking property of TCP [11], the rate at which
10000 12000 14000 16000 18000 20000 22000 24000 26000 28000 30000 6 8 10 12 14 16 18 20 22 24 Bytes
Time of Day (sec) T c p S n d _ a c k
T c p S n d _ d a t a
Linear regression of returning ACKs determines the connection's throughput.
MSS = Difference between 2 "dots" Bytes unacked R T T Fast retransmit on 3rd DUPACK
ACKs return to the sender determines the throughput of the connection, or more precisely, the bandwidth available to the sender at the bottleneck link. Self-clocking itself can be seen from the fact that the sender (usually) only sends a new segment when an ACK has been received.
In the plot shown in Figure 4, the sender is in the slow-start phase (see Section 3.3) where every ACK clocks out two segments. One because the ACK advanced the window and another one because the congestion window was increased by one. The number of bytes the sender has outstanding unacked at any point in time and the current RTT can be read off the plot as indicated in Figure 4. It is apparent from the graph how the sender always “over-shoots” the bottleneck bandwidth by sending faster then the ACKs return. As explained in Section 3.3, this is a required feature that the sender uses to probe for more bandwidth that might have become available at the bottleneck link. This causes a constant increase in the RTT. Two special cases are shown in Figure 4: (1) the fast retransmit algorithm triggered at 20 seconds, and (2) the transmission pause between 10 and 15 seconds. The former is explained in Section 3.3 and the latter in Section 5.2.
4.5 Correlating Trace Information
In this Section, we demonstrate the capability to correlate and visualize multi-layer traces. Once the traces for a measurement have been captured, MultiTracer is used to visualize the results. In general, we use the following labelling scheme for all graphs shown in this paper: • TcpSnd_data is the time/sequence plot of data segments
leaving the TCP sender.
• TcpSnd_ack is the time/sequence plot of ACKs arriving
at the TCP sender.
• TcpSnd_cwnd is the time/size plot of the TCP sender’s
congestion window.
• TcpRcv_data is the time/sequence plot of data segments
arriving at the TCP receiver.
• TcpRcv_ack is the time/sequence plot of ACKs leaving
the TCP receiver.
• RlpSnd_data is the time/sequence plot of data frames
leaving the RLP sender.
• RlpSnd_rexmt is the time/sequence plot of retransmitted
data frames leaving the RLP sender.
• RlpSnd_rst is the time/event plot of link resets
per-formed by RLP.
MultiTracer generates more information (e.g. RTT, SRTT, RTO), but in this paper we only use the items listed above. The plot data for each plot is generated into separate files, providing the flexibility to correlate any combination of events at the TCP sender/receiver and RLP sender/receiver. Since at this point we are only interested in studying certain
effects, it is not critical that we precisely correlate the traces with respect to the same clock. Thus, we only loosely synchronize the clocks on the three machines shown in Figure 3 and post-process the traces to “synchronize” them with respect to the TcpSnd_data trace.
Figure 5 shows a typical measurement, which as in most cases, yielded optimal throughput performance. The three rectangles in Figure 5 indicate which sections of this measurement will be “zoomed in” for detailed analysis in the following section. In this measurement the TCP sender was on the mobile host. Linear regression of the
RlpSnd_data plot shows that throughput provided by RLP is almost 960 bytes/s which is equivalent to 9.6 kb/s asynchronous. Likewise, the trendline through TcpRcv_data yields a throughput of 848 bytes/s. This is what we would have expected as header compression was not used for this trace and the overhead per MSS of 460 bytes was 59 bytes (12 bytes timestamp option and 7 bytes PPP overhead). Thus, the TCP sender optimally utilized the bandwidth provided by RLP as discussed in Section 4.3.
Note that the RlpSnd_*, TcpSnd_*, and TcpRcv_* graphs are all offset by 10,000 bytes from each other in the plots so that the graphs do not overlap. The graph for RlpSnd_data has a larger slope than the TCP graphs because it includes the TCP/IP overhead.
5. MEASUREMENT RESULTS
5.1 TCP/RLP Interactions are Rare
We have found that TCP and RLP rarely interact in an inefficient way. As depicted in Figure 6, in almost 85 percent of all our measurements, the utilization (see Section 4.3) of the GSM data channel was 98 percent or more5. Even in those measurements where we detected protocol interactions, the utilization never dropped below 91 percent. We did not expected to observe such high figures, given that one third of all measurements were taken in an environment with poor receiver signal strength (see Section 4.1). In such an environment we expected to find cases of competing error recovery between TCP and RLP. In fact, we did not find any incidents of competing error recovery during bulk
4.In general, if the sender does not have enough data to fill a seg-ment of size MSS, then a smaller segseg-ment is sent. There are spe-cial rules for these situations [23].
5.Note that we use “rounded” figures. For example, a measured uti-lization between 99 and 100 percent is counted as 100 percent.
0 10000 20000 30000 40000 50000 60000 70000 0 10 20 30 40 50 Bytes
Time of Day (sec) TcpRcv_data (848 bytes/s) RlpSnd_data (958 bytes/s) TcpRcv_ack TcpSnd_ack TcpSnd_data Figure 12 Figure 7 Figure 11
data transfers, as discussed in Section 5.4. All measurements that yielded a utilization of 95 percent or less suffered from the impact of RLP link resets when TCP/IP header compression [9] was used. This is further explained in Section 5.3.
Figure 6 also shows the throughput range that sock (see Section 4.2) achieved for measurements that yielded the same utilization. Taking protocol overhead into account, the throughput was mostly close to the bit rate of the channel6. These results confirm similar findings from [2] and [13]. However, unlike in those studies, our tools provided us with the unique opportunity to measure utilization in addition to throughput. Thus, we could determine that a measurement (using TCP/IP header compression) which resulted in a throughput of only 7.0 kb/s, but yielded an utilization of 99 percent must have suffered from a non-optimal radio connection. Consequently, the RLP sender must have retransmitted a higher number of frames. The overall throughput results, however, suggest that the GSM data channel is over-protected with FEC. This is a topic that we will study in more detail in future work.
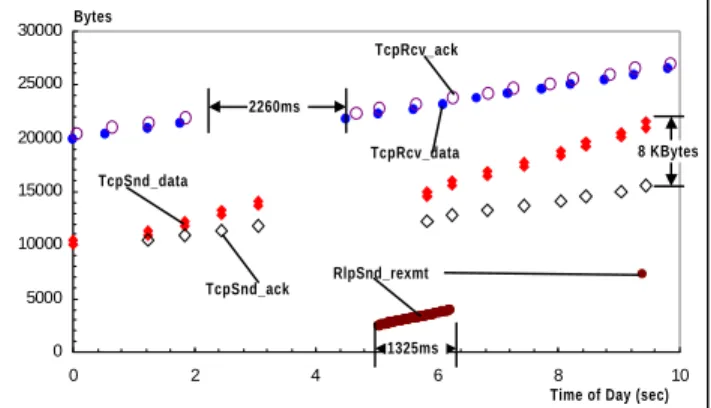
5.2 Excessive Queueing and Local Drops
One problem that is evident in the trace plots is the large mismatch between the pipe capacity and the load (see Section 3.3) that the TCP sender puts onto the network. The pipe capacity in this network is reached with 2 segments, assuming a MTU of 512 bytes. However, as can be seen in Figure 7, the TCP sender increases the load up to 8 KBytes or 16 segments. As explained in Section 3.3, the TCP sender has no way to determine the pipe capacity and, thus, will periodically increase the congestion window (the load) until the TCP receiver’s advertised window is reached. The latter usually corresponds to the default socket buffer size (a default setting of the operating system; commonly 8 or 16 KBytes). Consequently, the maximum pipe queue is 14 segments (with 8 KBytes socket buffers). In themeasurement platform shown in Figure 3, packets (PPP frames) queue up at the mobile host’s interface buffer. For downlink transmission, those packets would queue up at the other side of the bottleneck link (e.g., at the ISP7 as shown in Figure 1). Thus, the core of the problem is a largely overbuffered link. The default interface buffer size in BSD-derived UNIX [23] is 50 packets (!). Obviously, this is an inappropriate size for a mobile device, which usually does not have a large number of simultaneous connections. We have purposefully compiled a kernel with an interface buffer that was smaller than 8 KBytes, the default socket buffer size used by BSDi3.0, to provoke a local packet drop as shown in Figure 7. This triggers the ‘tcp_quench’ (source
quench [23]) function call8 to the TCP sender which in response resets the congestion window back to one. After about one half of the current RTT, the sender can again send additional segments until the DUPACKs for the dropped packet trigger the fast retransmit algorithm (see Section 3.3). This leads to setting the congestion window to one half of its value before the local drop occurred. At this point, the sender has reached the advertised window and cannot send any additional segments (which it could have otherwise) while further DUPACKs return. Thus, when the retransmission is acked, a burst of half the size of the sender-side socket buffer (8 segments) is sent out by the TCP sender at once.
As can be seen from the TCP receiver trace, excessive queuing, the ups and downs of the congestion window at the TCP sender, and even retransmissions do not degrade throughput performance. But excessive queueing has a number of other negative effects:
• It inflates the RTT. In fact, a second TCP connection established over the same link is likely to suffer from a timeout on the initial connect request. This timeout occurs because it takes longer to drain the pipe queue (here up to 14 x MTU or 7 KBytes) on a 960 bytes/s link
6.Note that some measurements were done with and others without TCP/IP header compression. Also, some commercial GSM net-works provide a user rate of 1200 bytes/s, whereas others only provide 960 bytes/s (see Section 5.5).
Figure 6. TCP channel utilization.
0% 10% 20% 30% 40% 50% 60% 70% 80% 92% 93% 95% 99% 100%
TCP Channel Utilization (in percent)
Percent of all Traces
7.1 - 9.0 Kb/s
7.0 - 8.8 Kb/s 6.4 - 6.6 Kb/s
5.8 - 6.2 Kb/s 5.7 - 6.2 Kb/s
7.This is why Internet Service Providers (ISPs) often configure their equipment to not allow more than 3-4 packets worth of buff-er space pbuff-er access line into their modem pool.
8.Congestion avoidance might be the better response as it is defi-nitely known that a packet was lost.
0 10000 20000 30000 40000 8 13 18 23 28 TcpSnd_data TcpSnd_ack TcpRcv_data TcpRcv_ack Fast retransmit on 3rd DUPACK Packet drop due to an interface buffer overflow leads to a local source quench
TcpSnd_cwnd 8 KBytes
Time of Day (sec) Bytes
than the commonly used initial setting for TCP’s retrans-mission timer (6 seconds).
• If the timestamp option is not used, the RTT sampling rate is reduced, leading to an inaccurate retransmission timer value [8].
• An inflated RTT inevitably leads to an inflated retrans-mission timer value, which can have a significant nega-tive impact on TCP’s performance, e.g., in case of multiple losses of the same packet. The negative impact results from the exponential back-off of the retransmis-sion timer and can be seen in Figure 10.
• For downlink transmissions (e.g., web browsing), where no appropriate limit is imposed onto the outbound inter-face buffer of the bottleneck router, the data in the pipe queue may become obsolete (e.g., when a user aborts the download of a web page in favor of another one). The “stale data” must first drain from the queue, which in case of a narrow bandwidth link, may take on the order of several seconds.
A simple solution to these problems is to statically adjust the interface buffer size to the order of the interface’s bit rate9. A more advanced solution is to deploy active queue management [3] at both sides of the bottleneck link. The goal is to adapt the buffer size available for queueing to the bit rate of the interface, a given worst-case RTT, and the number of connections actively sharing the link. Combining active queue management with an explicit congestion notification mechanism [21] would further improve network performance as fewer packets would have to be dropped and retransmitted (in the case of TCP). In fact we regard it as imperative that these mechanisms be implemented at both ends of wide-area wireless links, which we believe will be the bottleneck in a future Internet.
5.3 The Impact of RLP Link Resets
One of the key findings of our measurements and analysis is an understanding of the impact of RLP link resets (see Section 3.2) when TCP/IP header compression [9] is used to reduce the per segment overhead. As with other differential encoding schemes, header compression relies on the fact that the encoded “deltas” are not lost or reordered on the link between compressor and decompressor. Lost “deltas” will lead to false headers being generated at the decompressor, yielding TCP segments that have to be discarded at the TCP receiver because of checksum errors. This effect is described in [9], which proposes the use of uncompressed TCP retransmissions as a means for re-synchronizing compressor and decompressor. Thus, once a “delta” is lost, an entire window worth of data is lost and has to be retransmitted. Even worse, since the TCP receiver does not provide feedback for erroneous TCP segments, the sender is forced into a timeout. This effect is further exacerbated by excessive queuing as described in Section 5.2, since queuing leads to unreasonably large windows and
a large retransmission timer.
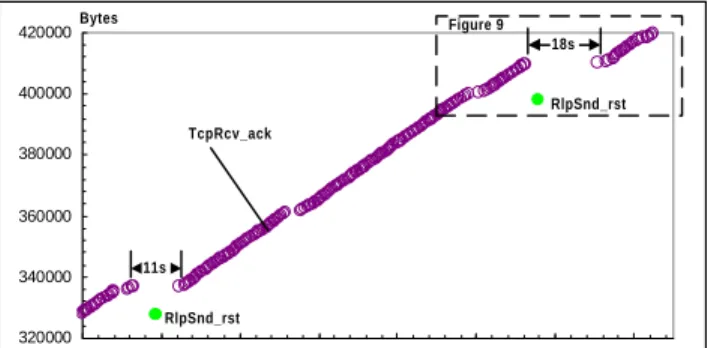
Figure 8 depicts this problem as perceived by the TCP receiver. We have only plotted the ACKs generated by the receiver and the RLP link resets (of which we captured 2 within 100 seconds). As can be seen, the first link reset leads to a gap of 11 seconds and 18 seconds for the second reset. During both gaps, no data is received correctly. The throughput during the interval depicted in Figure 8 drops to 634 bytes/s.
Figure 9 shows a detailed examination of what happens after the RLP link reset. The reset apparently caused the loss of 5 segments. Recall from Section 3.2 that RLP transports user data (PPP frames) transparently. Thus, if only the first or last few bytes of a PPP frame are lost when the RLP sender and receiver flush their buffers after the link reset, the whole PPP frame is discarded by the PPP receiver because of a checksum error. This causes the header decompressor to be off by 5 segments, so that segment i+5 is decoded as segment i and so forth. Thirteen of the segments shown in the plot are not acked by the TCP receiver because they are discarded due to checksum error. These segments should actually have been plotted with an offset of 5 x MSS parallel to the y-axis.
Another variant of the same problem is shown in Figure 10. This time ACKs get lost, including the one for the first retransmission; again due to a RLP link reset. This loss leads to an exponential timer back-off of the retransmission timer. Since the retransmission timer value is significantly
9.An interface buffer of 50 packets is certainly too large for an in-terface bit rate of 9.6 kb/s.
320000 340000 360000 380000 400000 420000 380 400 420 440 460 480 500 520 Bytes
Time of Day (sec) TcpRcv_ack RlpSnd_rst RlpSnd_rst 18s 11s Figure 9
Figure 8. Header decompressor failures.
393000 398000 403000 408000 413000 480 485 490 495 500 505 510 515 520 Bytes
Time of Day (sec) RlpSnd_rst 18 segments TcpRcv_ack TcpSnd_data TcpSnd_ack TcpRcv_data 5 segments lost due to RLP Reset 13 segments discarded at TCP receiver
inflated (see Section 5.2), this has a particularly bad effect.
We want to point out, though, that RLP link resets are very rare events. We have captured 14 resets, all of which occurred when the receiver signal strength was extremely low (see Section 4.1). In all cases, the link reset was triggered because a particular RLP frame had to be retransmitted more than 6 times (the default value of the RLP parameter N2, “maximum number of retransmissions”). Our results suggest that this default value is too low and needs to be increased. TCP connections before and after the link reset usually progress without problems and there is no apparent reason why the link should be reset. Increasing N2 is also supported by the fact that we did not find any sign of competing error recovery between TCP and RLP during bulk data transfers (see Section 5.4). We are currently investigating the question of a reasonable value for N2. Initial results indicate that TCP can tolerate a fairly high N2 without causing competing error recovery. This initial result and the negative interactions with header compression suggest that link layer retransmissions should be more persistent when transmitting fully reliable flows, e.g., TCP-based flows. This not only pertains to RLP [7] but also to comparable protocols which are intentionally designed to operate in a semi-reliable mode [12]. Recent studies of TCP over WLAN (Wireless Local Area Network) links report similar results [5]. On the other hand, persistent link layer retransmissions are not tolerable for delay-sensitive flows. In [14] we therefore propose the concept of flow-adaptive wireless links which choose the error control mode based on the protocol identifier in the IP header.
5.4 Competing Retransmissions are Rare
Various related studies [1], [4], [13] mention the potential problem of competing error recovery between TCP and a reliable link layer protocol resulting from spurious timeouts at the TCP sender. However, we did not find this problem in our measurements during bulk data transfers. A spurious timeout can be easily seen in a TCP sender-side time/ sequence plot: the ACK for a correctly received segment reaches the TCP sender after the retransmission timer covering that segment has expired. We only found 2 such instances in all our traces. However, both times the spurious timeout occurred at the beginning of the connection whenthe TCP sender had not yet converged to an appropriate retransmission timer value. Also, both times the receiver signal strength was very low and the RLP sender had performed many retransmissions at that time. All other timeouts we found were related to RLP link resets. In contrast, we found several instances that show that the TCP retransmission timer is conservative enough to even allow for extra delays due to link layer error recovery beyond 1200 ms. This is depicted in Figure 11 which shows a burst of retransmissions on the RLP layer of 1325 ms leading to a “hole” of 2260 ms at the TCP receiver. One reason for the difference in these values is that the end of a segment could have been affected by the retransmissions, which would require a full round-trip time on RLP layer (about 400 ms, see [14]). It cannot be the case that the returning ACKs were delayed in addition to the segment, as the plot shows no sign of ACK compression [18].
We were curious to understand why [13] did find spurious timeouts in their study which used almost the same network setup as ours. The authors of that study believe that these spurious timeouts were caused by excessive RLP retransmissions (i.e., because of competing error recovery between TCP and RLP). While it appears as if our results contradict the results of [13], our in-progress work indicates that this is not the case. The reason apparently lies in differences between the implementations of TCP that were used in both studies. Some implementations of TCP seem to maintain a more aggressive retransmission timer than others. Moreover, the TCP implementation we used (BSDi 3.0) uses the timestamp option [8], yielding a more accurate estimation of the RTT and consequently also a more accurate retransmission timer. Timing every segment instead of only one segment per RTT (which is done when the timestamp option is not used) enables a TCP sender to more quickly adapt the retransmission timer to sudden delay increases. Thus, we believe that timing every segment is an attractive enhancement for TCP in a wireless environment. However, we are not convinced that this requires the overhead of 12 bytes for the timestamp option field in the TCP header.
5.5 Other Effects
The data rate provided by RLP is 1200 bytes/s. We were therefore surprised when we saw the gaps in the 52000 57000 62000 67000 72000 50 55 60 65 70 75 80 85 RlpSnd_rst 1st Retransmission 2nd Retransmission 1st RTO: 7s 2nd RTO: 14 s Bytes
Time of Day (sec)
TcpRcv_ack TcpRcv_data
TcpSnd_data
TcpSnd_ack ACKs that never made it
back to the TCP sender
Figure 10. Exponential retransmission timer back-off.
0 5000 10000 15000 20000 25000 30000 0 2 4 6 8 10 TcpRcv_ack TcpRcv_data TcpSnd_data TcpSnd_ack RlpSnd_rexmt 1325ms 2260ms 8 KBytes Bytes
Time of Day (sec)
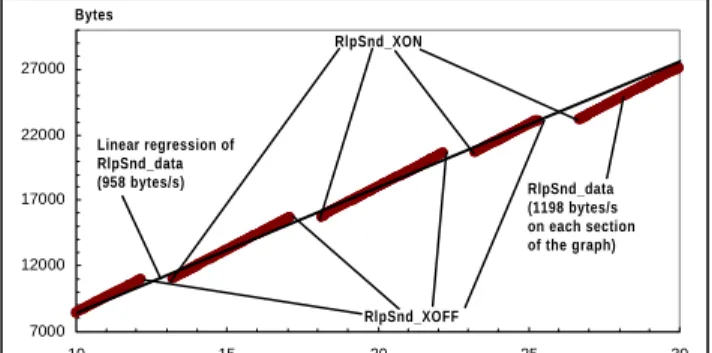
RlpSnd_data plots in some of our traces. However, after we
traced the flow control messages at the L2R layer (see Section 3.1) it became clear what was occurring. Due to limitations in some commercial GSM networks, the data rate appears to be limited to only 960 bytes/s (9.6 kb/s asynchronous).
In these networks, the RLP sender is flow controlled from the remote side so that the average data rate becomes 960 bytes/s. Figure 12 shows that the RLP sender sends at the maximum rate of almost 1200 bytes/s at times when it is not flow controlled, but the linear regression line shows that the real throughput is throttled by 20 percent down to about 960 bytes/s. However, the periodic gaps of 950 - 1300 ms did not trigger spurious timeouts in TCP.
It is worth mentioning that the GSM standard [7] also allows implementations where, instead of a link reset, the data call is completely dropped. We have measured this effect several times in some commercial GSM networks. Simply dropping the call is, however, an unacceptable alternative. Not only will the user in many cases have to re-initiate the data transfer (e.g., a file transfer), but will also be charged for air time that yielded an unsuccessful transmission.
6. CONCLUSION AND FUTURE WORK
We have developed a multi-layer measurement platform and trace analysis tools that provide the capability to study complex interactions of protocols running at different layers. In this paper, we have used these to study interactions between three protocols: (1) a reliable link layer protocol (RLP), (2) a link layer compression protocol (TCP/ IP header compression), and (3) a reliable transport protocol (TCP). Using a large number of measurements, we have demonstrated how powerful the means of correlating events on different layers is for performance analysis.Our key finding is that TCP and RLP rarely interact in an inefficient way. In particular we have not found any incident of competing error recovery between both protocols during bulk data transfers. We discuss why our results in this respect diverge from related work [13]. The reason lies in differences between the implementations of TCP. We also stress the importance of a careful design of the TCP retransmission timer. Moreover, we argue that timing every
segment is an attractive enhancement for TCP in a wireless environment, as it enables the retransmission timer to more rapidly adapt to sudden delay variations.
We show that the default value of the RLP parameter for the maximum number of retransmissions is too low. Our multi-layer analysis approach allows us to demonstrate how this, in rare cases, leads to RLP link resets and subsequent failures of the TCP/IP header decompressor. This in turn causes the loss of an entire window of TCP data segments each time RLP resets the link. We conclude that link layer retransmissions should be more persistent than current implementations when transmitting fully reliable flows, e.g., TCP-based flows. More persistence avoids interactions with differential link layer encodings, such as TCP/IP header compression. Finding a reasonable degree of persistence in link layer retransmissions is, however, still an open research question which we continue to study.
Our analysis demonstrates the negative impact of overbuffered links. This causes inflated end-to-end delays, which leads to a number of problems including unnecessarily long timeouts in cases of multiple losses of the same data segment. We explain how active queue management and explicit congestion notification mechanisms can avoid this problem. In fact we argue that it is imperative that these mechanisms be implemented at both ends of wide-area wireless links, which we believe will be the bottleneck in a future Internet.
Finally, our throughput measurements show that the GSM circuit-switched data channel mostly provides an ideal bit rate. This leads to the conclusion that the implemented channel coding and interleaving schemes over-protect the channel. It appears likely that weaker forward error control schemes and/or larger RLP frame sizes will yield higher TCP throughput results. Weaker forward error control schemes can cause higher sudden delay variations due to a higher fraction of RLP retransmissions. However, it seems that TCP can tolerate higher delay variations than experienced in the current GSM circuit-switched data channel. Again, timing every segment at the TCP layer further helps to prevent spurious timeouts.
Future work will focus on enhancing the multi-layer tracing platform and tools (e.g., terminating RLP in our testbed setup). This will give us the chance to refine the measurements to distinguish better between up- and downlink transfer directions. Ultimately, we want to exploit the experience we have gained from measurements for a simulation-based study of link layer design alternatives for the future Universal Mobile Telecommunications System (UMTS).
7. ACKNOWLEDGMENTS
We would like to thank Prof. Randy Katz for his advice and hospitality we have enjoyed at U.C. Berkeley. Thanks to Keith Sklower for helping us port the RLP code to UNIX and for lots of fruitful discussions. Thanks for comments on earlier versions of this paper to Michael Meyer, Markku Kojo, David Eckhardt, and the anonymous reviewers. 7000 12000 17000 22000 27000 10 15 20 25 30 RlpSnd_XON RlpSnd_XOFF
Time of Day (sec) Bytes Linear regression of RlpSnd_data (958 bytes/s) RlpSnd_data (1198 bytes/s on each section of the graph)
8. REFERENCES
[1] Balakrishnan H., Padmanabhan V., Seshan S., Katz R. H., A Comparison of Mechanisms for Improving TCP
Performance over Wireless Links, In Proceedings of
ACM SIGCOMM 96.
[2] Baucke S., Leistungsbewertung und Optimierung von
TCP für den Einsatz im Mobilfunknetz GSM, Diploma
Thesis, CS-Dept. 4, Aachen University of Technology, Germany, April 1997.
[3] Braden B., et al., Recommendations on Queue
Management and Congestion Avoidance in the Internet,
RFC 2309, April 1998.
[4] DeSimone A., Chuah M. C., Yue O.-C., Throughput
Performance of Transport-Layer Protocols over Wireless LANs, In Proceedings of IEEE GLOBECOM
93.
[5] Eckhardt D. A., Steenkiste P., Improving Wireless LAN
Performance via Adaptive Local Error Control, In
Proceedings of IEEE ICNP 98.
[6] ETSI, Quality of Service, GSM Specification 02.08, Version 3.0.0, March 1990.
[7] ETSI, Radio Link Protocol for data and telematic
services on the Mobile Station - Base Station System (MSBSS) interface and the Base Station System -Mobile Switching Center (BSS-MSC) interface, GSM
Specification 04.22, Version 5.0.0, December 1995. [8] Jacobson V., Braden R., Borman D., TCP Extensions for
High Performance, RFC 1323, May 1992.
[9] Jacobson V., Compressing TCP/IP Headers for
Low-Speed Serial Links, RFC 1144, February 1990.
[10] Jacobson V., Leres C., McCanne S., tcpdump, available at http://ee.lbl.gov/.
[11] Jacobson, V., Congestion Avoidance and Control, In Proceedings of ACM SIGCOMM 88.
[12] Karn P., The Qualcomm CDMA Digital Cellular
System, In Proceedings of the USENIX Mobile and
Location-Independent Computing Symposium, USENIX Association, August 1993.
[13] Kojo M., et. al., An Efficient Transport Service for Slow
Wireless Telephone Links, IEEE JSAC, Vol. 15, No. 7,
pp. 1337-1348, September1997.
[14] Ludwig R., Rathonyi B., Link Layer Enhancements for
TCP/IP over GSM, In Proceedings of IEEE INFOCOM
99.
[15] Mouly M., Pautet M.-B., The GSM System for Mobile
Communications, Cell & Sys, France 1992.
[16] Noble B. D., Satyanarayanan M., Nguyen G. T., Katz R. H., Trace-Based Mobile Network Emulation, In Proceedings of ACM SIGCOMM 97.
[17] Padmanabhan V., tcpstats, Appendix A of Ph. D. dissertation, University of California, Berkeley, September 1998.
[18] Paxson, V., End-to-End Routing Behavior in the
Internet, IEEE/ACM Transactions on Networking,
Vol.5, No.5, pp. 601-615, October 1997.
[19] Postel, J., Internet Protocol, RFC 791, September 1981 [20] Postel, J., Transmission Control Protocol, RFC 793,
September 1981
[21] Ramakrishnan K. K., Floyd S., A Proposal to add
Explicit Congestion Notification (ECN) to IP, Internet
Draft, Work in progress, January 1999.
[22] Simpson W., The Point-to-Point Protocol, RFC 1661, July 1994.
[23] Stevens W.R., TCP/IP Illustrated, Volume 1 (The
Protocols), Addison Wesley, November 1994.
[24] The ICEBERG Project, CS Division, EECS Department, University of California at Berkeley, http://iceberg.cs.berkeley.edu/.
[25] Xgraph, available at http://jean-luc.ncsa.uiuc.edu/ Codes/xgraph/index.html.
![Figure 1 (taken from [14]) shows the basic components used for circuit-switched data transmission in GSM](https://thumb-us.123doks.com/thumbv2/123dok_us/1792638.2756367/2.918.93.432.746.979/figure-taken-shows-basic-components-circuit-switched-transmission.webp)