Why Weak Patents?
Rational Ignorance or Pro-“customer” Tilt?
Zhen Lei and Brain D. Wright
Department of Agricultural and Resource Economics UC Berkeley
207 Giannini Hall, Berkeley, CA 97720 zlei@berkeley.edu and wright@are.berkeley.edu
Selected Paper prepared for presentation at the Agricultural & Applied Economics Association 2009
AAEA & ACCI Joint Annual Meeting, Milwaukee, Wisconsin, July 26-29, 2009
Copyright 2009 by Zhen Lei and Brian D. Wright. All rights reserved. Readers may make verbatim copies of this documents for non-commercial purposes by any means, provided that this copyright notice appears on all such copies.
Why Weak Patents?
Rational Ignorance or Pro-“Customer” Tilt?
Zhen Lei and Brian Wright
Abstract
The issuance of weak patents is widely viewed as a fundamental problem in the current US patent system. Reasons that have been offered for the granting of weak patents by the US Patent and Trademark Office (USPTO) include examiners’ “rational ignorance” of the patentability of applications and pro-“customer” rules and institutions that create incentives for examiners to grant patents of dubious validity to their “customers”- applicants. In this paper, we study whether US examiners’ behavior in prior art search betrays their assessment of applications’ patentability. For a sample of US patents for which applications were also filed at the European Patent Office (EPO), we construct a measure of the fraction of prior art that is missed by US examiners. We find that this measure significantly explains the probability of receiving a patent at the EPO. The results are robust to different empirical specifications. US examiners’ prior art searches indicate that they are, on average, not “rationally ignorant”. On the contrary, they identify and dedicate more search effort to those applications that seem more problematic, because they bear the burden of proof of non-patentability. Our study offers empirical evidence that a systematic problem of weak patents likely exists, and suggests that the problem may be more strongly attributable to the pro-applicant rules and policies than to examiners’ ignorance. The current prevalence of weak patents does not appear to be caused at the margin by lack of resources at the USPTO.
_______________________
* Department of Agricultural and Resource Economics at UC Berkeley, zlei@berkeley.edu and wright@are.berkeley.edu. This paper has benefited from discussions with Maximilian Auffhammer, Michael Anderson, Robert Barr, Peter Berck, Sara Boettiger, Gregory Graff, Stuart Graham, Dietmar Harhoff, Ann Harrison, Ethan Kaplan, Larry Karp, Alexandre Mas, David Mowery, Jeffrey Perloff, Elisabeth Sadoulet, Guanming Shi, Ted Sichelman, Sofia Villas-Boas, Michael Ward, Catherine Wolfram, David Zilberman, and numerous seminar participants. Paul Jensen, Alfons Palangkaraya and Elizabeth Webster generously provided their dataset. M-CAM, Inc. kindly offered their linguistic and semantic mapping service. I also thank Kyle Jensen for collecting some patent information.
1. Introduction
The US patent system has a key role in stimulating technological innovation by offering the prospect of economic rewards to inventors, and patenting is a big business in the United States. In 2007 approximately 467,243 patent applications were filed with the US Patent and Trademark Office (USPTO) and 184,377 new patents were issued, and both numbers have been growing steadily.1
However, there has been increasing concern about the operation of the US patent system in recent years. Critics such as Adam Jaffe and Josh Lerner claim that “the system is broken and endangering innovation and progress,” and one of the fundamental problems is that “the technology world today is awash in patents that should not have been granted in the first place.”2 Patents “ that should not have been granted in the first place” are called weak patents, because they are either not novel or obvious, in the light of prior art (including prior inventions and knowledge).3 Another way to think about weak patents is the notion of patent weakness (strength), conceptualized as the probability of being invalidated (validated) under a perfect re-examination4 or by an ideal court trial5 if challenged.
What are the costs of weak patents?6 Since market power enjoyed by a patent holder is typically considered to be a social cost that is necessary to stimulate innovation, weak patents might cause social costs without commensurate social benefits associated with increased innovation. Furthermore, there is generally no reason to expect that private incentives to challenge weak patents through litigation line up well with the social incentives.7
1 USPTO Annual Report (2007), Tables 2 and 6 (http://www.uspto.gov/web/offices/com/annual/2007). 2 Jaffe and Lerner (2004), page
3 Some widely cited and absurd patents include a method for swinging on a swing (US Patent No. 6,368,227); and a “sealed crustless sandwich” (US Patent No. 6,004,597).
4 By a perfect re-examination, we mean that the re-examination is a perfectly thorough and accurate implementation of the relevant statutes.
5 It is well recognized that, in practice, a court’s decision on patent validity is to a large extent determined by which side has more resources and means to invest on the trial, such as hiring better lawyers, etc. By an ideal court trial we mean that the court decision is immune from those factors (say, in the case of both sides having infinite resource and money), and completely based on the patentability of a patent.
6 For detailed discussions of costs of weak patents, see Lemley and Shapiro (2005) and Shapiro (2004). To give an example, Research In Motion, the company that sells BlackBerry wireless e-mail service, was sued by a company named NTP for infringing NTP’s patents and paid a $612 million “ransom” to settle the case, even though the USPTO had already indicated that it was likely to conclude soon that the NTP patents BlackBerry was accused of infringing were not even valid.
7 See Farrell and Merges (2004) for a discussion of various incentives to challenge patents. They point out that private incentives could be suboptimal due to the problems of free-riding and pass-through of royalties.
Proliferation of weak patents in a technology field raises the cost of licensing, litigation, or avoiding infringement.8 Uncertainty about the validity of previously issued patents may deter investment in innovation and/or distort its direction. Rent-seeking entrepreneurs may divert resources from productive activities into speculative patent acquisition and enforcement ventures. The Patent Reform Act, which has been discussed on the Capitol Hill since 2005, includes measures addressing the problem of weak patents.9
Why are weak patents issued? Statutory requirements for patentability of an invention include novelty, non-obviousness and reduction to practice.10 Upon receiving an application, a USPTO examiner is responsible for searching for and obtaining its prior art, and comparing the application to the prior art to evaluate its patentability. Two reasons, broadly speaking, have been offered for why US examiners issue so many weak patents.11 The first is examiners’ lack of qualifications, experience,12 time and resources for searching for prior art and evaluating each application,13 all of which are related to the level of funding available to the USPTO.14 It is alleged that, at the USPTO, an inexperienced workforce of examiners
Choi (2005) discusses the discrepancy in private incentives and social incentives to litigate, because of the possibility of cross-licensing and patent pools.
8 Farrell and Shapiro (2008) study how the structure and level of royalties depends on a patent’s strength. They show that when downstream licensees do not compete against each other or the patent holder, license fees approximate the license fee for an ironclad patent times the patent strength. When downstream users compete, they will accept surprisingly large per-unit royalties.
9 The House passed a version of the patent reform bill (HR 1908) in July, 2007. The bill suffered a serious. setback in May 2008 when its Senate version (S 1145) was stalled. See more of the history of this Patent Reform Act, visit http://www.fr.com/news/articledetail.cfm?articleid=490.
10 The US Patent Act of 1952 (35 U.S.C.) allows the granting of patents to “any new and useful process, machine, manufacture, or composition of matter, or any new and useful improvement” (Section 101), and precludes patent granting for subject matter that “was known or used by others” (Section 102), or “would have been obvious at the time the invention was made to a person having ordinary skill in the art.” (Section 103) These are called the utility, the novelty and the non-obviousness requirements, respectively.
11 See National Academies of Science (hereafter NAS) Study (2004) and Jaffe and Lerner (2004) for comprehensive discussions about why the USPTO might issue so many weak patents. The other side of the equation is that applicants submit too many applications and many of them are bad. The Court of Appeals for the Federal Circuit (CAFC) significantly broadened and strengthened the rights of patent holders. The rate of patent application filings in the US has been accelerating (Jaffe and Lerner, 2004).
12 It is argued that USPTO cannot retain good examiners and that most examiners have only 2-3 years of examination experience. Also examiners might be unfamiliar with new technologies and lack the
knowledge of where to look for prior art.
13 The average time allocated for an examiner to address one application is understood to be between sixteen and seventeen hours. The NAS study (2004, p51) reports that the number of examiners has not kept pace with the number and complexity of patent applications. The number of examiners per 1000
applications has been declining, while applications have become more complex, as measured by the number of claims and prior art citations per application.
conducts superficial searches and overlooks prior art that could render weak patents unpatentable. This situation is not unanimously viewed as problematic. One influential legal scholar has argued that US examiners “are ‘rationally ignorant’ of the objective validity of patents,…, because it is too costly for them to discover those facts” (Lemley, 2001). He argues that, given the skewed nature of patent value, society is better off if economizing on USPTO examinations and deferring rigorous determination of validity until the patent enters litigation.15 An alternative reason for the issuance of weak patents is an alleged pro-applicant bias of policies and procedures at the USPTO. Critics observe that since the 1980’s the USPTO’s culture, mission and incentives have been re-oriented towards issuing patents and serving the interests of patent applicants (denoted “customers” by the USPTO), and that US examiners are encouraged by various institutional incentives and protocols to accept
applications that they perceive to be ineligible (Jaffe and Lerner, 2004). In this paper, we investigate whether US patent examiners are “rationally ignorant”, or
whether they can and do distinguish strong applications from weak ones and conduct their examinations accordingly. Specifically, we ask whether a US examiner’s behavior in prior art search betrays his assessment of an application’s patentability. The basic idea is the following: if an examiner initiating two independent applications is “rationally ignorant,” then it is plausible that he spends the same, and limited, amount of time on each application and stops his search when the search time runs out, regardless of their patentability. Understandably, in neither of the two cases is his search thorough; and due to the stochastic nature of the results of prior art searches,16 one resulting patent likely has a higher share of prior art missed by the examiner than the other. We would then expect the patent with a higher share of missed prior art to be weaker, in the sense that it is more likely that prior art exists and be discovered later and used to invalidate it. Indeed, a view commonly held by scholars and practitioners is that if a patent has a larger amount of cited prior art, it has a higher likelihood of being validated.17
15 Lemley (2001) argues that strengthening the examination process is not cost effective, since very few patents are actually litigated or licensed; most patents simply sit on a shelf unused, or are used only for noncontroversial purposes, like financing. Because of this, society would be better off spending its
resources on more judicial inquiries of validity of those few cases in which it matters, rather than paying for more protracted examination of all patents ex ante.
16 For instance, a prior art search might miss a larger share of prior art if it is more difficult to find the application’s prior art or it happens that the examiner conducts the search on Friday afternoon.
Suppose instead that the examiner, constrained though he may be, can actually differentiate between the relative merits of the two applications. How would he decide his search effort? The examiner bears the burden of proof of non-patentability and the proof is the prior art he searches and obtains.18 If he is going to grant an application, no proof of patentability is needed; but if to reject an application, he needs to provide evidence of prior art to show the application is unpatentable. Furthermore, under the various legal, institutional and cultural incentives and constraints at the USPTO, which we shall discuss in Section 2, the examiner might target the application he deems as less patentable. He might give an easier pass to the good application, spending less time on prior art search, so that the resulting patent might have a higher share of missed prior art. But for the application he considers weak, the examiner, pursuing a rejection, searches harder for prior art to provide proof of non-patentability and to show the applicant the difficulty she would face if she chose to persist in pursuing the patent. In the end, the weak application is eventually allowed because the applicant is persistent and the examiner finally concedes. And we would observe a smaller share of missed prior art associated with the resulting patent.
Therefore, if USPTO examiners are “rationally ignorant,” a patent with a higher share of missed prior art might be weaker. However, if examiners do distinguish the relative patentability of applications and allocate their search effort accordingly, a higher share of missed prior art would suggest a stronger patent.
How do we test the relationship between the share of missed prior art and the strength of a patent? We study a sample of US patents with a USPTO filing date between 1990 and 1995, for which applications were also filed in the Europe Patent Office (EPO). Outcomes from independent EPO application process are used as indirect indicators of these US patents’ strength (patentability).
For each US patent i in the sample, a Natural Language Processing (NLP) algorithm, which involves linguistic and semantic analysis, is used to retrieve prior patents that are linguistically and likely technically similar to, but not cited by, the root patent i. We define to be valid.”
18 USPTO practice requires that examiners articulate their reasons for a rejection, however, examiners often say nothing if they chose to allow a case. It is argued that this practice encourages examiners to allow rather than to reject applications.
these uncited prior patents as a measure of patent i’s missed prior patents. Based on the information on the number of missed prior patents (MPPi) and cited prior patents (CPPi), we
construct a metric, share of missed prior patents (SMPPi), where SMPPi= MPPi/(MPPi+CPPi),
to proxy for its US examiner’s effort in searching for prior art.
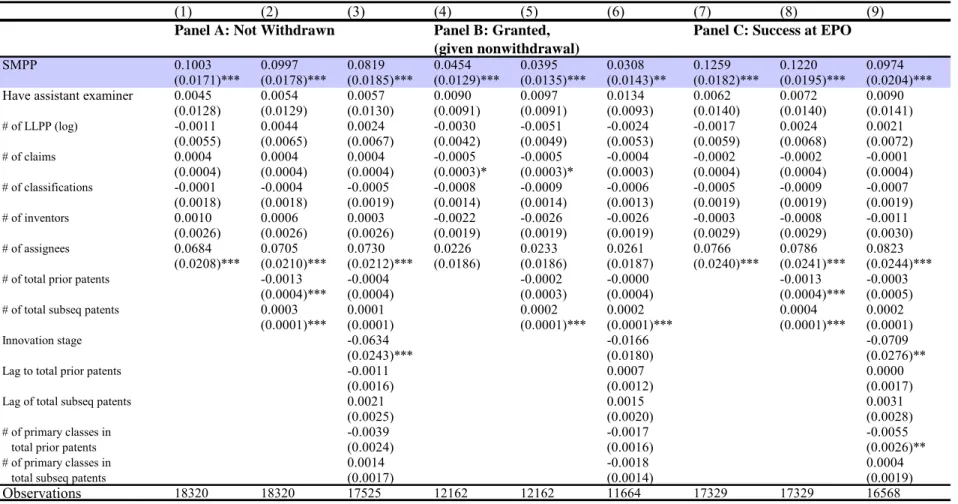
We find that, for the US patents in our sample, the share of missed prior patents (SMPP) can significantly explain the probability of non-withdrawal by applicants and the probability of being granted (conditional on non-withdrawal) at the EPO, suggesting that a US patent with a higher SMPP is indeed a stronger patent. The most convincing result is from a panel data model with US examiner by technology by US application year fixed effects. It allows us to identify the effect of SMPP through variations in SMPPs within the set of patents examined by the same US examiner, in the same technology field and with the same USPTO application year. Similar results also hold when we use a panel data model with USexaminer by patent assignee fixed effects to control for the possible heterogeneous interactions between applicants and US examiners. We also test several alternative rationales for the finding that a higher SMPP is positively correlated with the likelihood of an EPO success, and find that they are unpersuasive.
Our results indicate that, by and large, US examiners are not “rationally ignorant.” Instead, they can and do distinguish strong applications from weak ones, and conduct their searches accordingly. This appears consistent with the postulation in Allison et al. (2004) that “the much-maligned PTO is doing a better job than expected in evaluating the patents that really matters,” after they find that litigated patents cite more prior art and have a longer USPTO examination than a random sample of general patents.
Our study offers a piece of empirical evidence that the problem of weak patents in the US might be broad and systematic rather than anecdotal. For almost 35% of US patents in our sample, their related applications at the EPO failed, and many of these failures are predicted by the actions of examiners at the USPTO, who recognized their lack of patentability and attempted to reject them by putting more effort in search for prior art. This suggests that the USPTO indeed issues patents weaker, on average, than its European counterpart.
pro-“customer” policy and institutions, which make it difficult for US examiners to reject ineligible applications, might be more salient than examiners’ ignorance. Even without changing the number of US examiners and the workload and the time allocated for each application, the weak patent problem might be significantly addressed just by empowering examiners to be able to reject applications that they consider as non-patentable. A tradeoff between weeding out weak patents and increasing USPTO expenditure, suggested by the “rational ignorance” theory in Lemley (2001), does not appear to exist on the margin.
The remainder of the paper is organized as follows. Section 2 offers some institutional details at the USPTO to develop our hypothesis about examiner’s search effort and its implication for patent strength. Section 3 provides a simple model to illustrate the hypothesis. In Section 4 we describe the data and our empirical strategies for testing our hypothesis. We present the results in Sections 5 and propose a novel metric for patent strength in Section 6. Section 7 discusses the policy implications of our findings and concludes.
2. Examiners, Examination Procedures and Incentives at the USPTO
In this section, we briefly describe some institutional details about examiners, the patent examination process, and institutions and incentives for examiners at the USPTO, to develop our hypothesis that if US examiners are not “rationally ignorant” and distinguish stronger applications from weak ones, they put more effort in search for prior art for applications that they think are less patentable. As a result, a patent with a smaller share of missed prior art might be weaker.
2.1 Examiners and their burden of proof at the USPTO19
The USPTO is currently staffed by over 5477 patent examiners, and has more than 8900 total full-time equivalent employees. Examiners work together on closely related subjects in small groups called art units. Several related art units are organized into a work group, and several work groups covering a wide technology area are grouped into a
technology center. The USPTO has eight technology centers20 and approximately 271 art units.
Art units are the building blocks of the US patent examination system. Each art unit is led by a Supervisory Patent Examiner and contains 10–15 primary and assistant examiners. Primary examiners have at least 5 years of experience at the USPTO and have signatory authority in granting or rejecting patents. Assistant examiners are junior examiners who are like apprentices and must have their examinations reviewed and signed by a primary examiner. It takes five to six years for assistant examiners to become primaries.
The workflow for the patent application process is quite systematic. After being received at a central receiving office and passing basic checks to qualify for a filing date, patent applications are sorted by the Office of Initial Patent Examination, which allocates them to one of the art units. Within the art unit, the Supervisory Patent Examiner looks at the invention claimed in the application and assigns it to a specific examiner. The assigned examiner will, in most cases, have continuing responsibility for the examination of the application. He reads and understands the application, and searches for prior art (including previous patents, databases, and journals) to determine if this is patentable, i.e., if it is a novel, non-obvious and useful invention.21 A prior art search typically begins with a review of existing US patents in relevant technology classes and subclasses, either through computerized tools or by manual examination of hard-copy stacks of issued patents, and may then proceed to a search of foreign patent documents, scientific and technical journals, or other databases.
Is the intensity of search independent of the examiner’s judgment of the application? An answer is suggested by the following quote from a patent attorney representing
20 The eight technology centers at the USPTO are: 1600 Biotechnology, Organic Chemistry; 1700 Chemical and Materials Engineering; 2100 Computer Architecture, Software, and Electronic Commerce; 2600 Communications; 2800 Semiconductors, Electrical and Optical Systems and Components; 3600 Transportation, Construction, Agriculture, National Security and License and Review; 3700 Mechanical Engineering, Manufacturing, and Products; and 2900 Designs for Articles of Manufacture.
21 When an application is filed, the applicant has no duty to do a thorough search for prior art and disclose them to the USPTO, although he has a duty to disclose the prior art of which he is aware that is “material to the patentability of the application.” It is the examiner’s responsibility to search for prior art to determine whether the claimed invention is patentable.
applicants,22
“I do not have to prove my invention is patentable. It is the examiner who has to prove my invention is unpatentable.”
As suggested, an examiner’s responsibility is to prevent unpatentable applications from being granted. It is this function that distinguishes a patent examination system from a patent registration system.
Moreover, the examiner is not allowed to use his “gut feeling” to determine an application’s patentability, as suggested by the following quote from an ex-examiner:23
“I felt very sad when I had a gut feeling about a (bad) application but could not find the prior art (to reject it).”
Two messages can be read from the quotes above. First, examiners do form an opinion about an application’s patentability during the examination. Second, when an examiner tries to reject an application, he bears the burden of proof of non-patentability and must articulate his reasons and provide prior art to justify his rejection. By contrast, an allowance of an application does not require him to prove anything. With such burden of proof of non-patentability, an examiner may search more diligently for prior art when he regards an application as unpatentable and considers a rejection.
The Manual of Patent Examining Procedure (MPEP), the official guideline for patent examiners, instructs examiners to search for prior art that not only shows the unpatentability of original claims in an application but also, in a FOAM of non-final rejection, anticipates how the applicant will amend claims in response to the FOAM. The following excerpt is from MPEP Section 904.03 on “Conducting the Search”:
22 The quote is from an instructor in a course on patent prosecution that the author audited in the Boalt School of Law at UC Berkeley. The instructor is a patent lawyer who taught law students on how to prosecute patent applications for their clients.
23 The quote is from an informal conversation with an ex-examiner at the USPTO, who prefers to remain anonymous.
“It is normally not enough that references be selected to meet only the terms of the claims alone, …., the search should, insofar as possible, also cover all subject matter which the examiner reasonably anticipates might be incorporated into applicant’s amendment.” (Italics added)
The MPEP guidelines suggest that for a very good application, an examiner may not need to conduct as thorough a search, because he is about to approve the application, and the applicant is less likely to come back. However, if the examiner thinks an application to be unpatentable and considers a rejection, he needs to search harder for prior art to demonstrate the non-patentability of the original claims and the non-patentability of the anticipated claim amendments. All the burden of proof of non-patentability is on the examiner.
2.2 Incentives and constraints in patent examination at USPTO
After the examiner obtains and reads the prior art, he determines whether the application is patentable, and writes a letter of “first office action on merit (FOAM)” to the applicant (or normally, the applicant’s attorney) with either a Notice of Allowance or, more commonly, a Non-final Rejection. When writing a FOAM of non-final rejection, the examiner must write a detailed analysis of the basis for the rejection.24 The applicant then has a fixed length of time to respond by supplying additional arguments and evidence and/or amending the claims. After negotiation, the examiner writes a letter of “second and final office action” to allow the application or maintain some or all of the initial rejections. This second rejection is typically called a “final” rejection.
An overwhelming majority of applications at the USPTO receive a FOAM of non-final rejection, but only a minority of them receives a “final” rejection in the second office action. Moreover, a majority of the applications that receive a second and “final” rejection ultimately result in a patent, even without amendment.25 This seemingly puzzling
24 The Manual of Patent Examination Procedures (MPEP), Section 706.
25 Lemley and Sampat (2007) find that in their sample, 86.5% of the applications received a first office action on merit (FOAM) of a non-final rejection, but only 34.5% received a “final” rejection in the subsequent action. Subsequently, 52.9% of those applications that received a “final” rejection ultimately
fact could be, at least partly, explained by the cultural, procedural and institutional incentives at the USPTO that encourage examiners to grant, rather than continue in trying to reject applications from persistent applicants.
The compensation and promotion schemes for individual USPTO examiners provide incentives for them to process applications as quickly as possible, by allowing them. For each examiner, the USPTO sets a productivity goal specifying the number of hours he is to spend on an average application. In practice, the productivity goal is specified as a certain number of points that the examiner is supposed to earn, calculated on a biweekly basis (the “biweekly production goal”). The examiner is awarded a point when he either writes a FOAM or disposes of an application (the application being either abandoned, allowed, or appealed to the Board of Patent Appeals and Interference in which case the examiner needs to write an Examiner’s Answer in response). But no points are awarded for all other actions including: (1) a second, third, etc., action on the merits; (2) a final rejection; (3) an interview (in person or by telephone); and (4) an Advisory Action. The biweekly production goal is based on the examiner’s technology area and his experience level (primary or assistant examiner). If he exceeds 110% of his production goal, the examiner receives a bonus.26
The USPTO also implements various internal assessments to ensure “examination quality control” through auditing an examiner’s work. The primary quality indicator is the examiner’s error rate.27 The USPTO quality review specialists calculate this rate by analyzing a sample of allowed patents for patentability issues, such as the adequacy of the examiner’s search and the originality of the applicant’s claims, and determining the percentage of patents that contain at least one claim that would be held invalid in a court of law.28 There are informal “controls” of examination quality as well. For instance, the examiner might care
result in a patent, and another 20% are still pending. 56.7% of the applications issued are issued without any amendment. 66.1% of those which are amended after a final rejection are patented.
26 For a detailed discussion of USPTO examiners’ biweekly production goal and the reward system see a report (2004) by the Office of Inspector General, US Department of Commerce, (hereafter the OIG Report (2004).
27 Other indicators include: (1) USPTO reopens applications based upon applications sampled for post review; (2) the Board of Patent Appeals and Interferences reviews adverse patentability decisions; and (3) the examiner’s grant rate. (The Office of Inspector General Report (2004), p.14).
28 The error rate reported in USPTO quality assessment audits rose slightly during the 1990s, but has only ranged between 3.6% and 7% since 1980.
about his reputation and “does not want his patent to be the one that hit newspapers.”29 With these “quality control” mechanisms in place, the examiner likely targets applications that he considers to be unpatentable, for which he searches harder for prior art to prove their unpatentability.
Moreover, certain examination procedures at the USPTO allow an applicant essentially unlimited attempts to persuade a critical examiner to approve a patent, making it impossible for the examiner to ever finally reject a bad application if the applicant is persistent. As Lemley and Moore (2003) observe, “One of the oddest things about the US patent system is that it is impossible for the USPTO to ever finally reject a patent application. While patent examiners can refuse to allow an applicant’s claim to ownership of a particular invention, and can even issue what are misleadingly called ‘final rejections’, the applicant always gets another chance to persuade the patent examiner to change his mind.” The term “final rejection” is a classic legal misnomer.30 The applicant receiving a second and final rejection has several options: 1) she can continue to negotiate with the examiner by submitting claim amendments, evidence and arguments; 2) she can request a face-to-face or telephone interview with the examiner to try to persuade the examiner in person; or 3) she may choose to appeal the rejection. In these cases, the examiner is awarded no points until the application is disposed of. Alternatively, the applicant can start the examination process over by filing a Request for Continuation Examination (RCE), or application continuation.31
Furthermore, beginning in the early 1990s, the US Congress converted the USPTO from an agency funded by tax revenue to one funded by the fees it collects. The USPTO has since increasingly viewed itself as an organization whose mission is to serve its “customer”, patent applicants who want their applications granted.32 This new orientation creates strong incentives for the USPTO to process applications as quickly as possible. Examiners have
29 The quote is from an informal conversation with an ex-examiner at the USPTO.
30 See Robert P. Merges et al., Intellectual Property in the New Technological Age (p116, 3rd edition, 2003) (“The label ‘final rejection’ is a misnomer if ever there was one.”)
31 Application continuations permit an applicant to re-file a pending application and avoid the implementation of a patent examiner’s decision. There are three types of continuations: Continuation Application, Continuation-In-Part, and Division. Applicants can also file a “Request Continuation Examination”. See Lemley and Moore (2003) for a detailed discussion about the problem of application continuation.
reportedly been criticized by their supervisors for undertaking too many reviews of prior art before issuing a patent.33
With all these institutional and cultural barriers to reject an application, all an examiner can do when attempting to reject an unpatentable application is to search for more prior art to increase the difficulty, delay and cost34 for an applicant should she choose to persist, and perhaps to persuade her to narrow the claims in the application. The examiner hopes that such deterrence will lead to a more speedy disposal of the application. Should the applicant persist, however, it is costly for the examiner to engage in back-and-forth negotiations with the applicant; it consumes time and does not earn the examiner production points.
Although the examiner might ultimately grant a weak patent due to the applicant’s persistence, the fact that he conducted a more thorough search for prior art reflects his view that the application is relatively weak. Thus, the examiner’s search effort might be a signal of patent strength. This is the hypothesis explored in this study.35
3. A Simple Model
We use a simple model to illustrate the hypothesis presented in the Section 2. Define the underlying patentability of a US application i as a random variable Pi, with a normal distribution36 that is common knowledge:
33 Here are selected and very possibly non-representative quotes from PTO examiners: (1) We have a cultural goal now. If some examiner is not issuing enough, his SPE (supervisory patent examiner) will complain and make her or him feel like s/he’s a weirdo anal retentive tight butt…. The examiner wonders why s/he is working so hard. The examiner wonders why s/he draws complaints from the boss…. (2) We just don’t fight hard enough against the bull- being shoveled by upper management…. And why should you care? Hey, management pays you for good patents or bad, right? Why should you fight with management? Why reject? (These comments are taken from Gregory Aharonian, “A Few Patent Examiners Complain about Patent Quality,” PATNEWS, January 28, 1999.
34 The lengthy examination is costly for applicants because patent lawyers who represent applicants charge fees according to the hours they spend on the case.
35 Our hypothesis postulates that if an application is less novel or more obvious, the resulting patent has a smaller share of missed prior art. In another scenario, when an application has excessively broad claims, the examiner might conduct a more thorough search for prior art to narrow down the claims in the issued patent. This scenario could create a bias against our finding that a US patent with a higher share of missed prior art is more likely to succeed at the EPO, as this application with broad claims is likely to be narrowed down and issued at the EPO as well, and thus the share of missed prior art would have no explanatory power in its EPO application outcome.
36 If we prefer an application’s patentability to have a range of [0, ∞), we can consider P
i as the logarithm of the underlying patentability that has a lognormal distribution.
(1) ( ) ~ ( , 2)
i
f P N α σ
Suppose that Qi is the signal about the patentability of the application i. Qi is also a random variable in the sense that people may receive different signals of this patentability. We assume that Qi has the following conditional distribution (conditional on the true underlying patentability Pi) that is also normal and common knowledge:
(2) ( | ) ~ ( , )2
i i i
f Q P N P υ
The US examiner reads the application i and receives a signal about its patentability, qi, which is a realization of the random variable Qi. We can think of qi as the examiner’s perception about the application’s patentability.37 With this perceived patentability qi and the common prior belief about the true patentability Pi, the examiner forms his posterior belief about Pi, shown in Equation (3).
(3) 2 2 2 2 2 2 2 ( | ) ~ ( i , ) i i q f P q N σ σ υ σ +υ σ +υ
The examiner then decides how much effort he wants to put in search for prior art. The search effort is e with a support [0,1].
The USPTO has a patentability threshold p*. For the examiner, granting an application with a patentability Pi below the threshold p* incurs a cost, either because the quality assessment office or other people will with some probability detect the mistake later or the examiner might just feel bad for not meeting his job responsibility. We assume a constant cost C1 for granting an application whose Pi is below p*.
To try to put an end to an application that the examiner deems unpatentable, he conducts a more diligent search for prior art, not only to show a proof of non-patentability, but perhaps more importantly, to deter the applicant from persisting in pursuing the patent. If the applicant is determined, she can keep coming back over and over again. Suppose that the probability of the applicant being persistent D is inversely dependent on the share of prior art the examiner has found, which is in turn determined by the search effort ei, in a simple form
37 For simplicity, the model assumes that the examiner receives the signal and decides his search effort once and for all. Alternatively, the examiner, during the search, could do Bayesian updating of his perception of patentability and adjust his search effort accordingly. By contrast, the theory of “rational ignorance” postulates that the examiner does not link his search effort to the patentability of the application.
D(ei)=(1-ei).38, 39
However, the search effort is costly to the examiner, as a higher search effort consumes more time and thus reduces the points he will earn towards his biweekly production goal. We assume the cost of search effort to be C(ei)=C0 ei2, where C0 is a constant. In our study, the examiner’s search effort e is measured by the share of prior art that is cited in the resulting patent.
Given his perception about application i’s patentability qi, and his posterior belief about the underlying patentability f(Pi|qi), the examiner decides his search effort, ei, which minimizes the sum of the cost of search and the expected cost of approving application i:
(4) min * 2 0 1 ( ) ( | ) ( | ) p i i i i i i C e C D e f P q d P q −∞ +
∫
where the probability of granting the application i when its Pi below p* is *
( )i p ( | ) ( | )i i i i
D e f P q d P q
−∞
∫
, the product of the probability of the applicant being persistent (in which case the examiner has to grant) and the probability of Pi being smaller than p*.The examiner solves this cost minimization problem and decides his search effort, ei, which is given by Equation (5).
(5) 2 2 * 2 2 1 2 2 0 ( ) 2 i i p q C e C σ υ υ α σ σ υ ⎛ + − − ⎞ = Φ ⎜ ⎟ ⎝ ⎠
where Φ() is the cdf function for a normal distribution.
The derivative of ei with respect to qi is negative, meaning that if the examiner perceives application i to have higher patentability, he will use less search effort. Understandably, the examiner will take more search effort if the USPTO sets a higher patentability standard p*. The examiner’s search effort is also higher if the cost of granting an undeserved patent is higher or if the search cost is lower:
(6) i 0 i e q ∂ < ∂
38 Since an applicant can always obtain a patent if he is persistent and willing to spend time and money to contest a rejection, the patentability of the application per se does not affect his decision on whether to fight. It is the difficulty and cost of persuading the examiner, reflected by the prior art cited by the examiner, that matter to the applicant.
39 The probability of the applicant being persistent could also depend on the application’s potential commercial value, which we assume away in the model, for simplicity. This simplification does not change the results of the model
(7) * 1 0 0, 0, 0 i i i e e e p C C ∂ ∂ ∂ > > < ∂ ∂ ∂
As outside researchers, we observe the prior art cited by the examiner and we have an estimate of missed prior art. These two pieces of information can be used to construct an indicator of the examiner’s search effort ei. The question is, what is the conditional expectation of the true patentability Pi, conditional on ei (i.e., E[Pi|ei])?
Given ei, we can derive qi, the examiner’s perception of the patentability, from Equation (5): (8) 2 2 * 2 2 1 0 2 1 2 ( ) ( ) i i i C e p q e C σ υ αυ υ σ − ⎛ ⎞ + − = − Φ ⎜ ⎟ ⎝ ⎠ (9) i( )i 0 i q e e ∂ < ∂ whereΦ-1
() is the inverse of the cdf function of a normal distribution.
After we derive qi(ei), we can, from the conditional distribution f(Pi|qi) presented in
Equation (3), infer the expectation of the underlying patentability Pi, conditional on ei, i.e.,
E[Pi|ei]. (10)
[
|]
[
| ( )]
2 2 2 2i( )i i i i i i q e E P e E P q e αυ σ σ υ + = = +As shown in Equation (11), the derivative of E[Pi|ei] with respect to ei is negative, meaning that if we observe that a US patent has a higher search effort ei, the conditional expectation of its underlying patentability (E[Pi|ei]) should be lower.
(11) 2 2 2 [ | ] [ | ] * * 0 i i i i i i i i i i E P e E P e q q e q e e σ σ ν ⎛ ⎞ ∂ ∂ ∂ ∂ = =⎜ ⎟ < ∂ ∂ ∂ ⎝ + ⎠ ∂
Thus, the model illustrates that if a US examiner has a good assessment about the patentability of an application, he would conduct a less diligent search for prior art if he perceives it to be more patentable. As a result, we would expect a patent with a higher share of missed prior art to be a stronger patent.40 On the contrary, if the examiner is “rationally
40 In this simplified model, we assume that whether an application is granted by the USPTO is only determined by the applicant’s persistence, which is in turn determined by the examiner’s search effort and
ignorant” and allocates the same amount of time to each application, a patent with a higher share of missed prior art might be weaker. Therefore, an empirical study of the relationship between a patent’s share of missed prior art and its strength would be an indirect test of whether US examiners are “rationally ignorant.”
4. Empirical Strategies and Data Description
How do we empirically test whether a higher share of missed prior art, indicates a stronger or weaker patent? First, we need a sample of US patents and some indicators of which are stronger and which are weaker. Second, for each of these US patents, we need to know how much prior art is cited and how much has been missed by its US examiner during the examination, so that the share of missed prior art can be constructed.
4.1 Use of international patenting to distinguish stronger US patents from weaker ones Ideally, we would like to have a random sample of US patents drawn from the whole US patent pool and have them either examined again with a perfect re-examination at the USPTO or litigated for validity in the court with an ideal trial. The outcomes of the USPTO re-examinations or the validity decisions by the court would tell us their patent strength.
Since 1981, the USPTO has had a reexamination process available at any time during a patent’s life. However, the US reexamination has serious disincentives and drawbacks and is almost dysfunctional.41 Patent litigation data, which contain only a small fraction of patents that are highly selected, might be too complex and biased to be suitable for our purpose. Only 1.5% of US patents are ever litigated, and only 0.1% of patents are ever litigated to trial.42 All litigation could be viewed as a failure to settle. Those that finally reach a court decision are extremely selected: both sides must have a strong belief that the expected value of the
the invention’s commercial value. In a more complicated model where the application’s patentability plays a role in both the USPTO’s decision to grant and the applicant’s decision to persist, the relationship between the examiner’s search effort and patent strength may not be as straightforward. A patent with a higher search effort has two competing implications: (1) the examiner perceives it to be less patentable, but (2) it survived a more rigorous examination with more prior art being reviewed. The results from a more complicated model might be ambiguous.
41 See Graham et al. (2005) for a detailed discussion and an interesting comparison of USPTO re-examination and EPO opposition. Also, see Merges (1999).
outcome is high; otherwise they would have settled before the trial to save millions of dollars of cost.
In this paper, we instead look at the cases where an inventor files applications, with the same priority date, in multiple patent offices.43 We study a sample of 22,300 US inventions44 that filed and obtained US patents at the USPTO, and also filed applications, through non-PCT filings, at the European Patent Office (EPO) and the Japanese Patent Office (JPO).45 The US patents in our sample cover 30 distinct technology fields,46 and their USPTO
application years range from 1990 through 1995.
In this paper, we focus on the EPO application outcomes of the US patents in the sample, because the application process at the JPO has its own peculiarities that complicate the issues.47 Since the EPO applies patentability standards broadly similar to that of the USPTO,48,49 and the independent EPO examination could be considered as a second trial of the patentability of an invention claimed in a US patent, and EPO application outcomes might betray the strength of the patent.50 Moreover, since the EPO has been widely viewed as
43 Studies that make use of international patenting include Graham et al. (2002) who study US
re-examination and EPO opposition process by matching EPO patents to their “equivalent” US patents, Graham and Harhoff (2006) studying a set of litigated US patents and their “equivalent” EPO applications, and Jensen et al. (2006) who document the disharmony in application outcomes by international patenting offices.
44 These inventions are defined as US inventions because they have only US inventors and filed applications at the USPTO first.
45 Our data is a subset of the larger dataset compiled by Jensen et al. (2006). See Jensen et al. (2006) for a detailed description of their dataset and the variables in the data. This study focuses on US inventions only, because they provide a clear timeline of the application process both at the USPTO and the EPO, discussed in subsection 4.2.
46 The 30 technology fields are Office of Science and Technology (OST) technology groups, following Jensen et al. (2006). See Office of Science and Technology, Department of Trade and Industry, United Kingdom classification. See http://www.ipaustralia.gov.au/about/statistics.shtml#patents for details of the classification system. We also use the 6 Technology Categories and 36 Sub-Categories in Hall et al. (2001) to categorize technology fields, and the results remain similar.
47 For instance, an applicant could wait up to seven years to request an examination, until which point the application just sits at the JPO. It is very likely that what happens at the JPO, to a large degree, depends on what happened at the USPTO and the EPO. Studying the interactions among application processes at the Triadic patent office might be an interesting research line in its own right, which we shall pursue in the future.
48 The Agreement on Trade Related Aspects of Intellectual Property (TRIPS) require that all signatories to the agreement apply the criteria of novelty, non-obviousness and utility to determine whether an invention is eligible for a patent (TRIPS Article 27). Specifically, EPO patents are issued for inventions that are novel, mark an inventive step, are commercially applicable, and are not excluded from patentability for other reasons (Article 52 EPC).
49 There remain certain differences between the USPTO and the EPO, mostly in patentable subject matter. For example, software and genes are considered as subject matters that are less patentable at the EPO. 50 An analogy is two independent blood tests at two hospitals for the cholesterol level.
having more rigorous examinations and better performance than the USPTO,51 an application related to a stronger US patents is more likely to survive at the EPO. In both cases, the outcome of an EPO application might signal the strength (validity) of the corresponding US patent.
Note that the US patents in our sample are also selected in the sense that (1) inventions in our sample sought patent protection in both the USPTO and the EPO through a non-PCT filing. They might differ from those seeking only a US patent, or from those filing a PCT application, in regard to potential commercial value or patentability; and (2) the sample does not include inventions associated with applications that were filed with the USPTO, but rejected.52, 53 Given these sample selection phenomena, we should use caution in interpreting our findings.
4.2 The EPO application process
For a US inventor who files applications in both the USPTO and the EPO, the time line of the application process is illustrated in Figure 1. The applicant usually files an application at the USPTO first, where an examination automatically ensues, needing no further request from the applicant. Within one year from the US filing date, the applicant needs to file with the EPO in order to claim the US priority date. Upon receiving the application, a centralized EPO search office in The Hague, Netherlands, conducts search for prior art, writes a search report that cites the relevant prior art that the search found, and publishes the search report.54 Within 6 months after the search report is published, the applicant must decide whether to file a request for examination and pay the examination fee.
51 The grant rate for the USPTO in 1993-1998, corrected for continuing applications, ranges from 80% to 97%. In contrast, the grant rates for the EPO and the JPO from 1995-1999 (averaged) are 67% and 64%, respectively. (Quillen and Webster (2001)).
52 Before 2000, the USPTO only published issued patents and did not publish applications that were rejected by the USPTO. Thus, we do not have information about rejected applications filed at the USPTO before 2000.
53 The second selection issue might not be significant, given estimates of the grant rates at the USPTO based on original applications could be as high as 95% (Quillen and Webster, 2001). Even with a lower bound of the USPTO grant rate of 75-80%, the second selection problem might not be serious, as applications that are Non-PCT filings may have a higher grant rate than the general USPTO applications. 54 The search report is published either together with the publication of the application if the report is available by the due publication date for the application (18 months after the claimed priority date), or alone otherwise.
Upon receiving the request, an EPO examiner (different from the searcher) starts the examination of its patentability. If no request is made, the application is deemed as withdrawn by the EPO. Starting from the third year from the EPO filing date, the applicant must pay annual fees to keep the application alive until the application is disposed of at the EPO. The applicant may decide to withdraw the application at any time during the EPO examination. Meanwhile, the issuance of the US patent can occur at any time during the EPO examination. There are three EPO application outcomes of interest: withdrawn by applicants, granted or rejected by the EPO.55 These are sequential events: an applicant first decides whether to withdraw her application and, conditional on a non-withdrawal, the decision of grant or rejection by the EPO is then observed. Figure 2 illustrates the sequential events associated with an application at the EPO.
As shown in Table 1, overall only 60.2% of the US patents in our sample have a corresponding application granted at the EPO; 28.3% withdrawn and 5.8% rejected, respectively. The EPO grant rates vary significantly across different technology fields, ranging from 44% to 75.6%. The technologies with the top three grant rates are handling printing (75.64%), transport (72.7%), and agricultural food (71.6%). The bottom three technologies are semiconductors (44%), pharmaceuticals (45.4%), and information technology (51.4%). The EPO grant rates also vary by years, between 51.5% to 65.5%.
4.3 Information about prior art obtained and missed by US examiners
To construct a measure of the US examiner’ effort in search for prior art for a US patent, we need information about the prior art the examiner actually obtains through his search and the prior art he misses.
With regard to the former, on the front page of a US patent document there is a reference section where prior art is cited by the examiner. An applicant has the “duty to disclose” prior art of which he is aware (though no duty to conduct a thorough search for prior art), therefore the cited prior art on the front page of a US patent may contain both prior art disclosed by the applicant, and prior art obtained by the examiner through the search; these
55 See Jensen et al. (2006) for a more detailed discussion of categorizing these three EPO application outcomes.
cannot be distinguished for US patents in our sample.56
Using all prior art cited on the front page of a US patent to proxy for the prior art that the examiner (rather than the applicant) actually identifies through his search may not be a serious problem for our study, for two reasons. First, it is possible that the examiner would have obtained some applicant-disclosed prior art through the search, had the applicant not disclosed it. In other words, some applicant-disclosed prior art might just be a substitute for what the examiner would have obtained. More importantly, using all cited prior art, instead of the prior art obtained by the examiner induces a bias against our results in Section 4 and renders the results even more significant. There is evidence that applicants care more about applications that are more original and more important, for which applicants tend to conduct a search for prior art and disclose more prior art to the USPTO (Sampat 2005)57, 58. Therefore, a “better” application might have more applicant-disclosed prior art that, ceteris paribus, would render the resulting patent, which is a stronger patent, to have an understated share of missed prior art and an overstated examiner search effort. This would bias against our findings in Section 4 that a stronger patent has a higher share of missed prior art. In other words, if we had information about the prior art obtained by examiners through their search, and used it to construct the variable (the share of missed prior art), our results would have been even stronger and more significant.
Regarding prior art missed by US examiners during their searches, it is very difficult and expensive, if not impossible, to get precise information about missed prior art for a large sample of US patents. There is no way, other than reading patent claims in detail and applying perfect judgment, to identify exactly which prior art is relevant and missing. Patent lawyers
56 Starting from 2001, applicant-referenced prior art and examiner-referenced prior art are distinguished in a US patent. But the patents in our sample were filed at the USPTO during the period of 1990-1995. 57 Sampat (2005) discusses the incentives and disincentives for applicants to search for prior art and disclose to the USPTO. He finds that, after controlling for technology fields, patent applicants devote more effort to identifying prior art for more technologically and commercially valuable inventions, measured by forward citations (citations cited by subsequent patents), 4th year patent renewal and patent family size. He also finds that in so-called “complex product” industries (i.e. electronics, computers and telecommunication technologies), where patenting is mostly for “strategic” purposes of preserving freedom to practice and used as bargaining chips in cross-licensing and where firms care more about the quantity of patents than about obtaining “quality” patents, applicants are less likely to search for prior art.
58 The findings in Sampat (2005) are consistent with our informal discussions with some ex patent lawyers. Large companies tend to file thousands of patent applications at the USPTO each year, for which they tend to disclose no prior art to the USPTO. Alcacer and Gittleman (2004) study a random sample of 1,500 US patents over the period 2001-2003 and find that 40% of them have no prior art cited by applicants.
try to do this in patent litigation, for which they charge high fees. As an alternative, our study relies on a sophisticated Latent Semantic Analysis (LSA), also known as Natural Language Processing (NLP) analysis, to determine how closely related other patents are to a given patent (hereafter, root patent) and thus identify the missed prior patents of the root patent.59 When a prior patent satisfies a particular threshold of linguistic similarity to the root patent and is not cited by the root patent, it will be flagged as a missed prior patent of the root patent.60 , 61 The LSA analysis used in the paper was kindly provided by M-CAM, a
Charlottesville, VA-based patent analysis firm, which employed its own NLP algorithm to identify missed prior patents for each US patent in our sample.62, 63
For each patent i in the sample, in addition to “M-CAM missed prior patents” (MPP), the M-CAM analysis also provides two more pieces of information that we use in the study. The first piece is “M-CAM linguistically linked prior patents” (LLPP), all the prior patents that the M-CAM Latent Semantic Analysis identifies as linguistically linked to, but not cited by, the patent i. LLPPs are located by the M-CAM algorithm using a much lower threshold of linguistic similarity than MPPs and used as a proxy for difficulty of finding prior patents.64
59 For an explanation and application of the NLP analysis, visit http://www.cognition.com/info/how.html. In addition to M-CAM (www.m-cam.com) that does a NLP analysis for the US patents in our sample, there are other companies whose business is based on NLP. Among them is Cognition Technologies, Inc.
(www.cognition.com).
60 Note that the M-CAM analysis only searches patent documents to retrieve what it deems as “missed prior patents”, and we don’t have data on other types of missed prior art, such as missed journal articles. In this paper, we use only information about cited prior patents and M-CAM missed prior patents to measure US examiners’ search effort. It is widely viewed and empirically confirmed that US examiners’ searches are primarily focused on patent documents, particularly on US patents (Sampat 2005). Thus, measuring an examiner’ search effort using the number of cited prior patents and the number of missed prior patents appears reasonable, if not ideal.
61 The paper reports the results with examiners’ search effort measured by the number of cited prior US patents and the number of missed prior US patents. Using all the cited and missed prior patents (US, EP, Japanese and other national patents) might have a potential double counting problem, because one prior invention might be protected in multiple jurisdictions. The results with the latter measure of examiners’ search effort, not reported here, are similar.
62 The analysis algorithm of M-CAM is a trade secret, and detailed information about the algorithm is therefore unavailable. However, the firm indicates that the algorithm incorporates elements of latent semantic analysis as well as employing patent-specific bibliographical information to determine relationships between patents.
63 Of course, the M-CAM algorithm is not comparable to a legal and technical assessment of what are missed prior patents. However, on average, and over a large data set, the algorithm could provide useful information about technically related but uncited prior patents.
64 Analogous to those hundreds of links that appear if we do a Google search using some keywords, these linguistically linked prior patents (LLPP) can be considered as the pool of potential prior patents that the US examiner gets with a first round of search using some keywords, from which the examiner then has to figure out the “true” prior patents.
The second piece of information relates to the subsequent patents that might have built on root patent i and should have cited patent i but did not. We call them “M-CAM unciting subsequent patents,” as opposed to those subsequent patents that cite the root patent (hereafter citing subsequent patents). We combine a patent’s “citing subsequent patents” and “M-CAM unciting subsequent patents” together and use these “total subsequent patents” as a possibly more accurate measure for the importance and value of the patent. 65 Appendix 1 gives a more comprehensive description of the information obtained from the M-CAM analysis.
We conduct a case study to check how good the M-CAM LSA analysis is, i.e., how likely the M-CAM missed prior patents are the “true” missed prior patents. Listed in Table 2 are six high-profile patents that have been revoked by the USPTO after re-examinations, thanks to the validity challenges brought by PubPat, a non-profit organization representing the public interest and specializing in challenging undeserved patents that are both economically and socially significant.66 In three out of six cases, the true missed prior patents that were used by PubPat to invalidate those undeserved patents are included in the “M-CAM missed prior patents”. In five out of six cases, the true invalidating prior patents are included in the broader class, “M-CAM linguistically linked prior patents.” Thus, we have some confidence that M-CAM algorithm does a reasonably good job in locating missed prior patents.
Figure 3 shows the histograms of the number of cited prior patents and the number of M-CAM missed prior patents for the US patents in the sample. Both distributions are concentrated in the range of 1-50 and show significant levels of dispersion, suggesting that the M-CAM algorithm achieves a degree of discrimination’ it does not mechanically retrieve a roughly similar number of prior patents for each US patent in the sample.
4.4 Measurement for US examiner’s search effort: share of missed prior art
For each US patent i in our sample, based on the number of the cited prior patents (CPPi) on the front page and the number of M-CAM missed prior patents (MPPi), we construct a variable, share of missed prior patents (SMPPi), where SMPPi=
65 It has been suggested that if a patent has more citing subsequent patents and/or the citing subsequent patents spread over more diverse technology fields, the patent is more important and more valuable. See Hall, Jaffe and Trajtenberg (2001) and cited references there.
MPPi/(MPPi+CPPi) and (MPPi+CPPi) is the number of total prior patents. We are interested in
whether a higher SMPPi suggests a stronger or weaker patent.
A key advantage of using “M-CAM missed prior patents” is that, for the US patents in our sample, this information is observed only by us and was not known by either applicants or examiners in any patent offices. Thus, it has no direct impact on decisions by applicants and patent examiners.67 However, note that the set of M-CAM missed prior patents is not the “true” set of missed prior patents in a definitive sense. The constructed variable, SMPPi is a noisy measure of US examiner’s search effort, which could lead to a potential attenuation problem. This potential attenuation problem, caused by a noisy SMPP, might lead to understatement of the significance of the results, reported later.
Figure 4 provides graphic evidence that a higher SMPP suggests a stronger patent. It compares mean differences in SMPPs between US patents with different EPO application outcomes. We consider three comparisons: (1) the US patents that were not withdrawn at the EPO versus those withdrawn, (2) those granted by the EPO versus those rejected, conditional on non-withdrawal, and (3) those successful (granted) at the EPO versus those failed (either rejected or withdrawn).
Panel A of Figure 4 shows the mean differences in SMPPs for the three comparisons for US patents in each of the 30 technology fields. A solid circle indicates a significant difference from zero at 5% level, while a hollow circle indicates an insignificant difference. In 7 out of 30 technology fields,68 the US patents that were not withdrawn at the EPO have a significantly higher mean value in SMPP than those withdrawn; and in no fields, did those not withdrawn have a significantly lower mean SMPP relative to those withdrawn. The mean differences in SMPP between those granted and those rejected (conditional on a non-withdrawal) are significantly positive for 6 technology fields69 and insignificant for other technologies. In 10 out of the 30 technology fields,70 the differences in the average SMPP
67 M-CAM started its patent analysis business in 1999.
68 Those technology fields include telecommunications, optics, organic fine chemicals, macromolecular polymer, surfaces coatings, transport and nuclear engineering.
69 The fields include electrical devices, medical engineering, biotechnology, materials metallurgy, space technology weapons, and civil engineering building mining.
70 The fields include electrical devices, telecommunications, medical engineering, organic fine chemicals, macromolecular polymer, materials metallurgy, surfaces coatings, transport, nuclear engineering, and civil engineering building mining.
between the success (granted) group and the failure (rejected or withdrawn) group are significantly positive, and in no field is a significantly negative difference observed.
Panel B of Figure 4 shows the mean differences in SMPPs for the three comparisons for US patents with each of the six USPTO application years (1990-1995). In 5 out of the 6 years, US patents that are not withdrawn at the EPO have a significantly higher mean SMPP than those withdrawn; and only for year 1992, the difference is insignificantly positive. The differences in average SMPP for those granted and those rejected by the EPO (conditional on non-withdrawal) are significantly positive in two years (1990 and 1994), insignificantly positive in three years (1991, 1993 and 1995), and insignificantly negative only in 1992. In five out of the six years there are significantly positive mean differences in SMPP between the success (granted by the EPO) and failure (withdrawn or rejected) groups; the mean difference is insignificantly positive only in 1992.
4.5 Control variables
With regard to control variables, we use the number of “M-CAM linguistically linked prior patents” (LLPP) as a proxy for difficulty of finding relevant prior inventions. We also control for other characteristics of an invention that may influence applicants’ behavior or have impacts on EPO decisions. For instance, the higher commercial value an applicant believes his invention has, the more likely he is to be persistent and spend more money to get a European patent. As a result, the probabilities of not being withdrawn and being granted by the EPO (conditional on a non-withdrawal) might be higher if commercial value is higher. Specifically, for each US patent in the sample, we include the following control variables:71
(1) The number of claims in the US patent,
(2) The number of US classifications the US patent belongs to, (3) The number of inventors listed in the US patent,
(4) The number of assignees listed in the US patent,
(5) The number of total prior patents (both cited and missed prior patents),
71 We use “total prior patents” and “total subsequent patents” to construct control variables in the list because they, unlike “cited prior patents” and “citing subsequent patents” that are decided by examiners, are exogenous. As checks on the robustness of our results, we also use “cited prior patents” and “citing subsequent patents” to construct control variables and the results are similar.