Department of Parliamentary Services Parliamentary Library
Information, analysis and advice for the Parliament
RESEARCH PAPER
www.aph.gov.au/library26 May 2008, no. 31, 2007–08, ISSN 1834-9854
Budget Review 2008–09
Introduction
For the first time in twelve years we have, not only a new parliament, but a new government. This year’s Budget is a central document for establishing the policy directions of the recently elected Rudd Labor Government. The purpose of the Budget Review 2008–09 is to assist Senators and Members by considering a selection of measures contained in the Budget. It is not the intention of this document to make value judgements about the relative importance of different measures. Rather, it provides an overall examination of the Budget and some detailed analysis in selected areas.
The briefs are organised according to the subject matter discussed and the perspective adopted in the analysis. The opening feature article in the Economic Issues section provides a macroeconomic analysis and commentary of the Budget including the key assumptions underpinning the Government’s fiscal policy and the main spending and taxing features contained in the Budget. The article also provides a discussion on a range of economic indicators and forecasts and an overview on a range of international issues impacting on this year’s Budget. The remaining articles are more tightly focussed and examine the impact of the Budget across a broad range of specific issues and initiatives.
The Budget Review 2008–09 has necessarily been prepared under time pressure with a view to making it available to parliamentarians as soon as possible after the handing down of the Budget on 13 May. Great care has been taken to ensure that this paper is accurate and balanced. It is written using information publicly available at the time of production.
Clients of the Library are invited to raise any points requiring amplification or clarification directly with the research specialist concerned. Authors will also welcome general comments on papers. Any other feedback should be forwarded to me.
I hope, as with all our publications, that you find this a useful contribution from the Library.
Roxanne Missingham Parliamentary Librarian May 2008
Contents
Economic issuesBudget 2008–09: key features ... 1
Communications, broadband and the digital economy ... 22
Personal income tax and personal capital gains tax ... 25
Tax reform ... 32 Innovation funding ... 39 Infrastructure ... 43 Accounting standards ... 45 Workplace relations ... 47 Social issues Health ... 49 Education ... 67
Public housing and rental assistance ... 81
Early childhood services ... 85
Welfare ... 90
Disability and caring support ... 98
Carers ... 100
Employment services ... 103
Indigenous affairs ... 108
Immigration ... 112
Media and communications ... 116
Arts ... 120
Sport ... 124
Environmental and scientific issues Climate Change ... 127
Caring for our Country ... 136
Water for the Future ... 138
Agriculture ... 142
Science Funding ... 145
Attorney General’s Portfolio ... 156
Consumer Protection Laws and Corporations Laws ... 161
Defence and security issues
Defence ... 164
Security and policing ... 173
Foreign affairs
Official Development Assistance ... 178
Department of Foreign Affairs and Trade (DFAT) budget ... 181
Public Service issues
Budget Review 2008–09
Budget 2008–09: key features
David Richardson and Scott Kompo-Harms
Economics Section
Introduction
This Budget is the first under the Rudd Government and the first delivered by the new Treasurer, Wayne Swan. It is the first Budget brought down by a Labor Government since Ralph Willis’ last Budget in 1995. The main changes between the last Howard Government Budget and the first Rudd Government Budget are discussed below.
This Budget has been framed in a challenging environment for economic policy makers. On the one hand the Australian economy is operating at, or very close to, capacity, creating domestic inflationary pressures. The unemployment rate and participation rates are both hovering around three-decade lows and underlying inflation, now well outside the Reserve Bank of Australia (RBA) target range of 2 to 3 per cent, has accelerated in recent quarters. On the other hand, the global financial system is experiencing the fallout from the US sub-prime crisis, resulting in tighter credit conditions which are expected to slow growth in the advanced economies over the forward estimates period. In his speech, the Treasurer described the Budget in the following terms:
This Budget is designed to meet the big challenges of the future. It is a Budget that strengthens Australia's economic foundations, and delivers for working families under pressure. It is the responsible Budget our nation needs at this time of international turbulence, and high inflation at home. A Budget carefully designed to fight inflation, and ensure we meet the uncertainties of the future from a position of strength. A Budget with a $55 billion Working Families Support Package at its very core. A Budget that begins a new era of strategic investment in Australia's future challenges and opportunities. And a Budget that helps plan, finance and secure Australia's long-term national security and defence needs. These are the commitments the Government gave to the Australian people at the election. Mr Speaker, this Budget honours those commitments. The Government has made sure every single cent of new spending for the coming year has been more than met by savings elsewhere in the Budget. Our commitments have been honoured by redirecting spending. Difficult spending cuts have helped fund our Working Families Support Package and our new priorities for the nation.1
These comments reflect the uncertainty for economic policy makers going forward, but nonetheless reveal a commitment from the government to implement their election promises in a disciplined manner. They also reflect the government’s desire to contain spending to combat domestic inflationary pressures.
Most of the major items in the Budget had been revealed prior to its release. These included: personal income tax cuts; changes to the excise on ‘other excisable beverages’, known as ‘alcopops’; introduction of, or changes to existing, means-tests for Family Tax Benefit – Part B, the Baby Bonus and the Medicare levy; increases in the Child Care Rebate; and tax refunds for educational expenses. In general, the Budget contained no real ‘surprises’.
In the immediate aftermath of the Budget, the main focus of much of the media was on the tax cuts, the three ‘nation-building’ infrastructure funds and the degree of fiscal restraint exercised.2 The issue of whether fiscal settings are tight enough to have any impact on inflation tended to dominate the headlines. For example, on the morning of 14 May 2008 the headlines said:
• ‘Swan Lite on Inflation’ in The Australian
• ‘Swan’s Nip and Tuck Budget’ in the Australian Financial Review
• ‘It’s a Highwire Act - $41 billion for nation building but risk of pressure for inflation’ in
the Sydney Morning Herald, and
• ‘Softly, softly: Labor’s cautious first steps’ in The Age.
This brief succinctly covers some of the main features of the Budget by examining the economic forecasts contained in the Budget as well as the outlook for other macroeconomic aggregates, including inflation, unemployment, the current account and interest rates. It then discusses the main revenue and spending aspects of the Budget.3
The Economic Outlook
‘Statement 2: Economic Outlook’ in Budget Paper No. 1 2008–09 details estimates (2007– 08), forecasts (2008–09) and projections (2009–10 to 2011–12) of the main macroeconomic aggregates that underpin the revenue and expenses figures presented in ‘Statement 3: Fiscal Strategy and Outlook’, Budget Paper No. 1 2008–09.4 In a time of uncertainty given the countervailing forces that exist, both internationally and domestically, these numbers assume a greater importance to the future Budget outlook. First, Statement 2 provides an overview of the parameters that underpin the Budget. Second, it provides an indication of the government’s expectations of the state of the global economy up to the end of 2009. Third, Statement 2 provides a detailed outlook for the domestic economy. This section of the brief provides an analysis of the government’s forecasts, as well as comparing the outlook in the Budget to key economic forecasts from other sources.
The Domestic Outlook
Table 1 from the Statement 2 examines the major economic aggregates, estimates and forecasts (see Table 1 below).
2. For a detailed listing of post-Budget media coverage, see: http://libauth1/library%5Fservices/budget%5Flibrary/
3. Sections of this brief draw on discussion from previous Parliamentary Library Budget Briefs, in particular D. Richardson, Budget 2006-07: Background Note and D. Richardson, 2005–06 Budget — Main Features.
4. Australian Government, ‘Statement 2: Economic Outlook’ and ‘Statement 3: Fiscal Strategy and Outlook’, Budget Paper No. 1 2008–09, Commonwealth of Australia, Canberra, 2008.
Budget Review 2008–09
Table 1: Major Economic Aggregates, Estimates and Forecasts—annual percentage change 5
Estimates 2007–08 Forecasts 2008–09
Demand and Output
Household consumption 4½ 2¾
Dwelling investment 2½ 2
Business investment 9½ 8½
Private final demand 5¼ 4
Public final demand 4¾ 3
Total final demand 5¼ 3¾
Changes in inventories6 ¼ -¼
Gross National Expenditure 5½ 3½
Exports 3 6
Imports 11 9
Net exports7 -2 -1
Real gross domestic product 3½ 2¾
Non-farm product 3¾ 2¼
Farm product 2 20
Nominal gross domestic product 7¾ 9¼
Other Selected Economic Measures External Accounts
Terms of trade 4¾ 16
Current account balance (per cent of GDP) -6¼ -58 Labour Market
Employment9 2½ 1¼
Unemployment rate (per cent) 4¼ 4½10
Participation rate (per cent) 65¼ 65¼11
Prices and Wages
Consumer Price Index 4 3½
Gross non-farm product deflator 4 6¼
Wage Price Index 4¼ 4¼
Source: Statement 2, Budget Paper No. 1 2008–09, p.2–6.
From these figures, it can be seen that the government expects economic growth to slow to slightly below its long-run average at 2¾ per cent, down from an anticipated 3½ per cent in 2007–08. Notable aspects of these expectations include:
• a slowing of non-farm GDP, which will drive a moderation in price and wage pressures
although this will be cushioned by a forecast rise in farm production, which is expected to add ½ percentage point to real GDP
5. All figures are in chain volume, or ‘real’ terms (with the exception of nominal gross domestic product) and are year-average percentage changes unless otherwise specified.
6. Percentage point contribution to GDP growth. 7. Percentage point contribution to GDP growth. 8. Forecast for June Quarter, 2009.
9. Labour force survey basis 10. Forecast for June Quarter, 2009. 11. Forecast for June Quarter, 2009.
• in line with the RBA forecasts, underlying and headline inflation are still forecast to be
outside of the Bank’s 2–3 per cent target band by the end of 2008–09
• the Wage Price Index is also forecast to remain steady but at an elevated level
• the government is expecting that strong growth in the emerging economies will continue,
with a forecast of an incredibly strong rise in the terms of trade of 16 per cent in 2008–09. This is coming off the back of levels not seen since the Korean War wool boom. The government stated that ‘over the 2008 calendar year, the terms of trade are forecast to rise by over 20 per cent which, if realised, would be the largest in a generation.’12 This will lead to further strong growth in Australian domestic incomes, thereby exacerbating inflationary pressures, and
• the unemployment rate is forecast to rise slightly (from the lowest level in over 30 years)
by the end of 2008–09.
The International Outlook
In terms of the international outlook, the government expects a mild recession in the United States (US), driven by deteriorating consumer confidence as a result of the recent falls in US house prices and exacerbated by the recent stress in financial markets. The Federal Reserve has responded by sharply lowering interest rates in recent months and the US administration has implemented a fiscal stimulus package (of around 1 per cent of US GDP), targeted at boosting household consumption and business investment. The effects of these stimuli are expected to be felt during the second half of 2008. The US slowdown does imply that the US current account deficit should narrow, ‘… although the risk of a disorderly adjustment of current account imbalances remains a concern for the US economy and global outlook’.13 Other major advanced economies (Euro area and Japan) are also tipped to slow, although not to the same degree as the US. In sharp contrast, growth in emerging economies (particularly in Asia) has continued and is forecast to continue virtually unabated to the end of 2009. The Chinese economy is forecast to slow slightly, from a decade-high growth rate of 11.9 per cent at the end of 2007 to 9.5 per cent at the end of 2009. Indian growth is also tipped to slow slightly, from 9.1 per cent to 7.75 per cent over the same period. Other East Asian economies are expected to experience a moderation in growth through 2008 and a rebound in 2009.14
Other economic indicators and forecasts
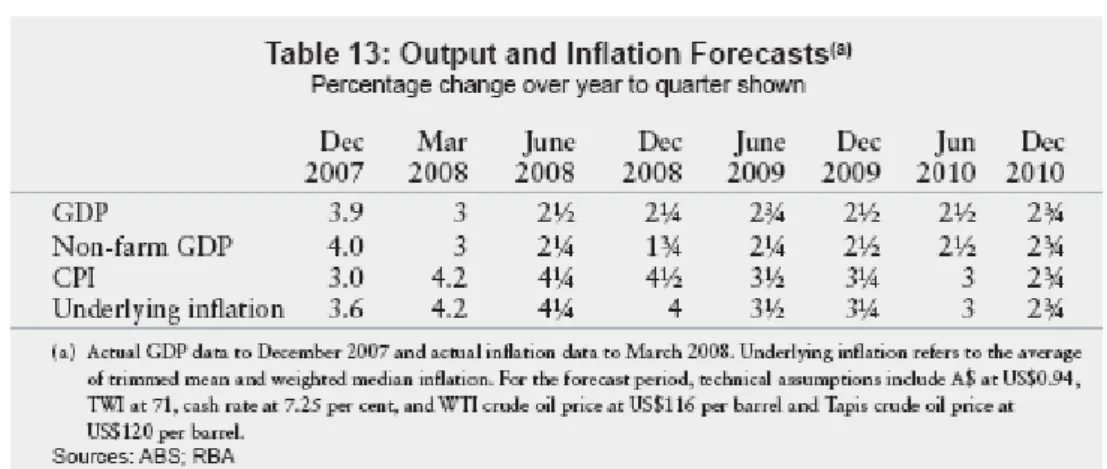
Other agencies and institutions also provide forecasts for economic activity. In this section Budget forecasts are compared with those made by the RBA, for the main economic aggregates of GDP, non-farm GDP, and CPI. The RBA also provides forecasts of underlying
12. Australian Government, ‘Statement 2: Economic Outlook’, Budget Paper No. 1 2008–09, Commonwealth of Australia, Canberra, 2008, pp. 2–22.
13 op. cit., Statement 2, Budget Paper No. 1 2008–09, p. 2–9. This has potential implications for the oil price assumption, as oil is traded in US dollars. Any deterioration in the value of the USD will push up world oil prices.
14 Countries including Hong Kong, Korea, Singapore, Taiwan, Indonesia, Malaysia, the Philippines, Thailand and Vietnam.
Budget Review 2008–09
inflation (although this is not included in the Budget). The RBA makes similar underlying assumptions to those made in the Budget (these assumptions are discussed in more detail in the section below). Table 2 below presents the RBA forecasts:
Table 2: RBA forecasts
Source: Reserve Bank of Australia, Statement on Monetary Policy, 9 May 2008, p. 68.
These latest RBA forecasts are roughly in line with the Budget forecasts, although the RBA’s forecasts, particularly for CPI inflation, tend to be a little more tilted to the upside (notwithstanding the different basis for comparing change over time – the Budget forecasts are performed on a year-average change basis, whereas the RBA uses year-to-quarter changes). However, it should be noted the RBA forecasts for non-farm GDP are well below that presented in the Budget. On inflation risks, the RBA states:
Risks to these forecasts can be identified in both directions. A further deterioration in the outlook for global growth would be the main source of downside risk to the forecasts for domestic activity. In particular, if the weakness in the major developed economies were to lead to a large moderation in growth in China and India, it is likely that the outlook for the Australian economy and commodity markets would deteriorate significantly…There are also upside risks to the domestic growth and inflation forecasts. It is possible that the recent weakness in consumer sentiment and domestic spending will prove to be mostly temporary, especially in light of the large boost to national income arising from the terms of trade. If demand were to be stronger than expected, the forecast moderation in the inflation rate would probably not eventuate. In addition, the persistence of inflation at relatively high rates for some time could result in inflation expectations becoming entrenched at higher than acceptable levels, which could feed back into wage- and price-setting behaviour.15
On the downside, the continuation of strong revenue gains as a result of strong terms of trade increases experienced in recent years depends heavily on whether domestic consumption and investment in emerging economies will fill the void left by flagging foreign demand from the major advanced economies. On the upside, if domestic demand does not moderate as expected, inflation is not likely to moderate posing serious risks to inflationary expectations which have remained well-anchored to date. In the short-term there is a risk that if domestic demand does not moderate as expected, yet a sudden and dramatic fall in commodity prices (and by implication the terms of trade) occurred, then at least for a short time (perhaps a few
months) inflation could rise sharply as the AUD would also tend to fall suddenly, raising the prices of imports (most importantly, the price of fuel). This would only be a temporary phenomenon of itself (and usually not much to worry about), but at a time of strong existing inflationary pressures, a sharp temporary surge in inflation could just be the trigger for inflationary expectations to surge and feed into wage-and price-setting behaviour.
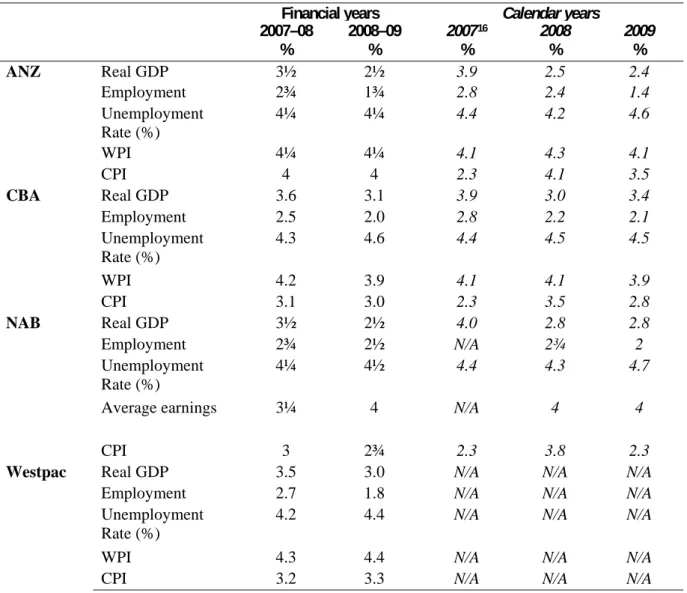
The following section summarises estimates of the key economic aggregates from the four major banks (Table 3 below). Compared with Table 1 above, the Budget forecasts are also roughly in line with these private-sector forecasts.
Table 3: Economic forecasts, ANZ, CBA, NAB and Westpac
Financial years Calendar years
2007–08 % 2008–09 % 2007 16 % 2008 % 2009 % ANZ Real GDP 3½ 2½ 3.9 2.5 2.4 Employment 2¾ 1¾ 2.8 2.4 1.4 Unemployment Rate (%) 4¼ 4¼ 4.4 4.2 4.6 WPI 4¼ 4¼ 4.1 4.3 4.1 CPI 4 4 2.3 4.1 3.5 CBA Real GDP 3.6 3.1 3.9 3.0 3.4 Employment 2.5 2.0 2.8 2.2 2.1 Unemployment Rate (%) 4.3 4.6 4.4 4.5 4.5 WPI 4.2 3.9 4.1 4.1 3.9 CPI 3.1 3.0 2.3 3.5 2.8 NAB Real GDP 3½ 2½ 4.0 2.8 2.8 Employment 2¾ 2½ N/A 2¾ 2 Unemployment Rate (%) 4¼ 4½ 4.4 4.3 4.7
Average earnings 3¼ 4 N/A 4 4
CPI 3 2¾ 2.3 3.8 2.3
Westpac Real GDP 3.5 3.0 N/A N/A N/A
Employment 2.7 1.8 N/A N/A N/A
Unemployment Rate (%)
4.2 4.4 N/A N/A N/A
WPI 4.3 4.4 N/A N/A N/A
CPI 3.2 3.3 N/A N/A N/A
Sources: ANZ - Economic Outlook (2 May 2008), ANZ – Federal Budget Report (14 May 2008), CBA Research - Forecasts–Economic (9 May 2008), NAB - Monthly Business Survey (8 April 2008), NAB - 2008/09 Budget Download (14 May 2008), Westpac – Australian Budget 2008/09 (14 May 2008).17
16. Actual figures—not a forecast.
Budget Review 2008–09
Overall, private-sector bank economists expect the Budget’s impact on inflation and interest rates to be neutral. For example, Saul Eslake, chief economist at ANZ stated:
The Budget embodies a very modest tightening of fiscal policy and as such is more appropriate for the circumstances than recent Budgets have been. It won’t add [Eslake’s emphasis] to upward pressure on interest rates as the previous government’s last few budgets did – but nor can it really be said that the Budget exerts maximum downwards [Eslake’s emphasis] pressure on interest rates.18
NAB Capital chief economist, Rob Henderson stated that the current Budget represented a structural tightening of fiscal policy, equivalent to ¼ per cent of GDP, but also reminds us that the 1996–97 Budget delivered a tightening of 1 per cent of GDP. According to Henderson, the tightening in the current Budget is:
[n]ot sufficiently frugal to represent a quantum change to the outlook.19 Key Assumptions Underlying the Economic Outlook
It should be noted there are a number of underlying assumptions made when these forecasts are generated. For 2008–09, the key assumptions are:
• the bilateral AUD/USD exchange rate is assumed to be around 93 US cents, with a trade
weighted index of around 71
• domestic interest rates are assumed to remain unchanged
• world oil prices (using the West Texas Intermediate benchmark) are assumed to be around
US$115 per barrel, and
http://www.anz.com/documents/economics/AEO%20Jun%2008.pdf and http://www.anz.com/documents/economics/Budget%20Report%202008-09.pdf; CBA material accessed on 16 May 2008 from:
http://www.research.commbank.com.au/CBA_Research_Common_Functions/Display_Pdf/0,2 226,23857,00.pdf;
NAB material accessed on 16 May 2008 from:
https://www.nabcapital.com/downloads/protected/30011_0.pdf?SourcePage=/research/australia /economics.aspx and
https://www.nabcapital.com/downloads/public/29765_0.pdf?SourcePage=/research/flagshippub lications/nationalmonthlybusinesssurvey.aspx (free registration and login required for both publications);
Westpac material accessed on 16 May 2008 from:
http://www.westpac.com.au/manage/wrap.nsf/vPdfUrls/9CA7E0A098DF643DCA2574480035 E743/$File/er20080513AustralianBudget2008.pdf?OpenElement.
18. S. Eslake et. al., ‘2008–09 Budget: A reasonable first effort’, ANZ Federal Budget Report, ANZ, 13 May 2008.
• farm sector forecasts assume average seasonal conditions but take account of low water
storage levels.20
Were any of these assumption violated, the forecasts would need to be altered. Previous Budgets usually presented a table containing information on the impact of deviations from some assumptions on revenue and expenses—this budget does not contain such a table. Rather, the 2008–09 Budget presents two illustrative scenarios:
• a permanent decrease in commodity prices, consistent with a 1 per cent fall in nominal
GDP, and
• a 0.5 per cent ongoing increase in both labour productivity and the participation rate,
consistent with a 1 per cent increase in real GDP.
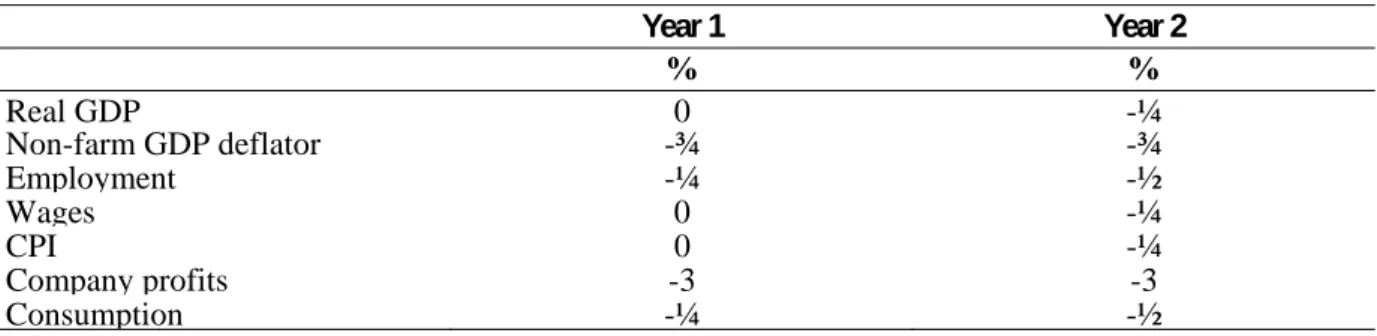
The scenarios reproduced below are presented as deviations from the baseline forecasts in the year after the change occurred.21 The first scenario can be categorised as a negative demand shock, while the second scenario can be thought of as a positive supply shock, and thus, the opposite cases can also be considered (i.e. the sign of the estimated effects on receipts and payments will change).
Table 4a: Illustrative impact of a permanent commodity price fall consistent with a 1 per cent fall in nominal GDP (per cent deviation from baseline level)
Year 1 Year 2 % % Real GDP 0 -¼ Non-farm GDP deflator -¾ -¾ Employment -¼ -½ Wages 0 -¼ CPI 0 -¼ Company profits -3 -3 Consumption -¼ -½
Table 4b: Illustrative sensitivity of the budget balance to a 1 per cent reduction in nominal GDP due to a fall in the terms of trade
Year 1 Year 2
$b $b
Receipts
Individuals and withholding taxation -0.5 -1.9
Superannuation taxation -0.1 -0.1
Company tax -1.3 -2.7
Goods and services tax -0.1 -0.2
Excise and customs duty -0.1 -0.1
Other taxation 0.0 0.0 Total Receipts -2.0 -5.0 Payments Income support 0.1 0.1 Other payments -0.2 -0.3 GST payments -0.1 -0.2 Total Payments -0.2 -0.4
20 op. cit., Statement 2, Budget Paper No. 1 2008–09, p. 2–6.
Budget Review 2008–09
Interest change on surplus change -0.1 -0.3
Underlying cash balance impact -1.9 -4.8
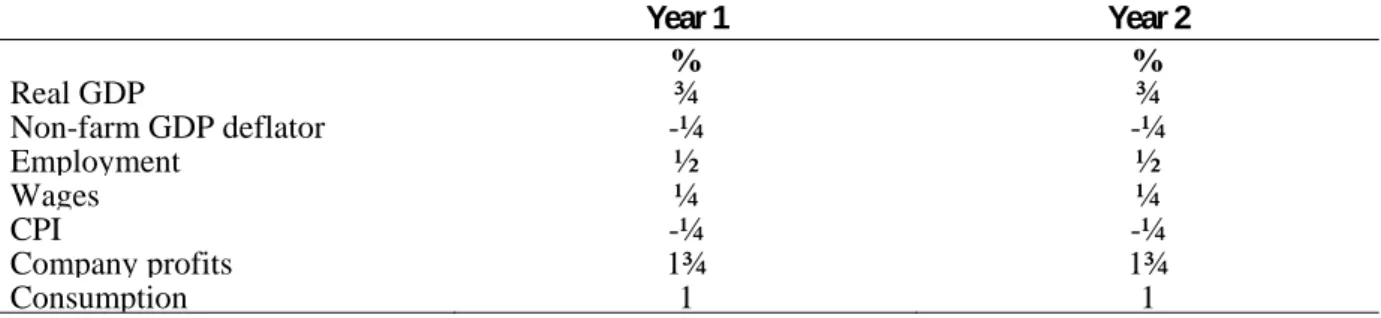
Table 5a: Illustrative impact of an ongoing (equal) increase in both the participation rate and labour productivity consistent with a 1 per cent rise in real GDP (per cent deviation from baseline level) Year 1 Year 2 % % Real GDP ¾ ¾ Non-farm GDP deflator -¼ -¼ Employment ½ ½ Wages ¼ ¼ CPI -¼ -¼ Company profits 1¾ 1¾ Consumption 1 1
Table 5b: Illustrative sensitivity of the budget balance to a 1 per cent rise in real GDP due to an ongoing (equal) increase in both the participation rate and labour productivity
Year 1 Year 2
$b $b Receipts
Individuals and withholding taxation 1.5 1.7
Superannuation taxation 0.0 0.1
Company tax 0.8 1.6
Goods and services tax 0.4 0.4
Excise and customs duty 0.4 0.4
Other taxation 0.0 0.0 Total Receipts 3.0 4.1 Payments Income support 0.0 0.1 Other payments -0.1 -0.2 GST payments 0.4 0.4 Total Payments 0.3 0.3
Interest change on surplus change 0.1 0.3
Underlying cash balance impact 2.8 4.1
The most significant thing to note from these tables is that most of the action, in terms of impact on the underlying cash balance, occurs on the receipts side. The impact on payments is small. The government also states:
To the extent that the increase in productivity and participation are temporary rather than permanent, the impact on the economic and fiscal position would be more subdued.
As mentioned above, it is also possible to consider the reverse cases (i.e. a positive demand shock and a negative supply shock), merely by reversing the sign of the impacts on receipts and payments.
Spending and Taxing: Main Features
This Budget forecasts ‘an underlying cash balance,’ or surplus, of $21.7 billion for 2008–09 up from the estimated $16.8 billion balance in the last Budget brought down by the former
treasurer, Peter Costello. It is also dramatically different from the last Keating Government budget brought down by Ralph Willis. That Budget produced a balance of minus $11.1 billion or a deficit of 2.1 per cent of GDP.
As far as can be ascertained, all commentators have accepted that the surplus will be $21.7 billion for 2008–09. However, when examining the historic series, we are told that the figure of $21.7 billion does not include the earnings of the Future Fund. If we add that back into the surplus then the true figure is in fact $25.2 billion. As a share of GDP, the figure would rise to approximately 2.3 per cent. There is no reason for excluding the earnings of the Future Fund from the budget balance and in other places in the Budget Papers it is added into the cash balance.22 In most of what follows we continue to use the government’s chosen figure (excluding Future Fund earnings) so as to enable cross checking with the Budget Papers. Surpluses are projected to continue into the forward estimates at roughly the same value. The budget surpluses for 2008–09 and 2009–10 will be allocated towards three new funds: the Building Australia Fund, the Health and Hospitals Fund and the Education Investment Fund. This Budget continues the recent trend towards allocating surpluses to specific purposes. Of course the allocation is largely notional, the presentation in the Budget Papers and the definitions of revenue, spending and balance remain the same.
The fiscal balance for 2008–09 is forecast to be $23.1 billion up from $20.4 billion in 2007– 08.23 The following table shows how that balance comes about.
Table 6: Budget revenue, expenditures and balance
Budget Estimates 2007–08 ($b) 2008–09 ($b) Increase % Revenue 303.8 319.5 5.2 % GDP 26.9 25.9 -3.7 Expenses 280.6 292.5 4.2 % GDP 24.9 23.8 -4.4
net capital investment 2.8 3.9 39.3
Fiscal balance 20.4 23.1 13.2
% GDP 1.8 1.9 5.6
Source: Statement 3, Budget Paper No. 1 2008–09, p. 3–5.
There are a number of interesting features of this table. The table shows that revenue will increase from $303.8 billion in 2007–08 to $319.5 billion in 2008–09: an increase of 5.2 per cent. However, as a share of GDP, revenue falls from 26.9 per cent to 25.9 per cent. The reason for that is the large forecast increase in nominal GDP of 9.25 per cent. The forecast
22. For example, Budget Paper No. 1 2008–09, op. cit., p. 3–10 and p. 10–8. 23. The fiscal balance is the accrual equivalent of the cash balance.
Budget Review 2008–09
increase in real GDP is more modest at 2.75 per cent but prices (using the gross non-farm product deflator) are expected to increase by 6.25 per cent.24
Expenses will increase from $280.6 billion in 2007–08 to $292.5 billion in 2008–09, an increase of 4.2 per cent.25 Incidentally, the forecast increase in the consumer price index suggests there will be a very modest increase in real expenditure for 2008–09. The Budget Papers claim that spending growth has been held to a 1.1 per cent real increase.26 As a share of GDP, those figures imply a fall in spending from 24.9 to 23.8 per cent of GDP in 2008–09. This Budget introduces a new table that shows not only the effect of policy decisions on the budget balance but splits the decisions into spending and savings decisions.27 This is a useful innovation; especially at a change of government when there will be interest in how the priorities are changing. The total effect of policy decisions since the Pre-Election Economic and Fiscal Outlook (PEFO) in October 2007 was to add $1996 million to the cash balance for 2008–09. The new table shows us that this was made up of:
• new spending worth $5274 million, offset by • cuts to other spending of $5338 million, plus
• new revenue measures costing $13 million, offset by • revenue increases worth $1918 million.
While this breakdown is new and useful it does not extend to the forward estimates.
The government has stressed its preparedness to make savings to finance its new spending. In the Budget Speech the Treasurer said ‘[e]very single dollar of new spending is more than offset by savings. We have delivered our commitments by redirecting spending to more pressing priorities.’28
The government has grouped a large number of those savings measures together under the heading ‘Responsible Economic Management’. Those appear on pages 321 to 427 in Statement 2.29 They are described there as measures that cut ineffective and wasteful programs, target welfare payments and realise efficiencies in the public sector. There is no equivalent heading for receipts ‘savings’ measures.
24. Adding 6.25 and 2.75 brings us to a 9 per cent increase but the cross product brings us up to 9.25 with rounding.
25. ‘Expenses’ are basically government spending on current account.
26. op. cit., Statement 3, Budget Paper No. 1 2008–09, p. 3–6. This is based on CPI rather than GDP deflator or non-farm GDP deflator as has been the common practice in the past. See Statement 3, Budget Paper No. 1 2008–09, op. cit., pp.10–6 and 10–8 for further explanation. 27. ibid., Statement 3, Budget Paper No. 1 2008–09, Table 2, p. 3–6.
28. op. cit., W. Swan, Budget Speech 2008–09, p. 6.
In addition to the effect of policy decisions, the government also had the advantage of the ‘parameter and other variations’ that added $5388 million since the PEFO. These are basically the effects of the economy doing much better than initially expected. Going back further it is useful to examine how we got from the last Costello Budget with its projection of a $12.7 billion surplus for 2008–09 to the present estimate of $21.7 billion. For that purpose we can also look at how the forward estimates are changed. Those figures are presented in the following table.
Table 7: Policy and parameter effects on the budget balance.
2008–09 2009–10 2010–11 May 2007 Budget estimates: underlying cash balance 12712 13812 12447
Effect of policy decisions -8897 -13835 -16157
Effect of parameter and other variations 17889 19692 22706 May 2008 Budget estimates: underlying cash balance 21703 19669 18996 Source: Statement 3, Budget Paper No. 1 2008–09, p. 3–11.
It is interesting to note that the policy measures have a substantially greater effect in the out-years then they do in the budget year. The effect of policy decisions in 2010–11 is almost twice the effect in 2008–09. In each year the policy effects are clearly dominated by the effects of parameter and other variations. Those parameter and other variation effects have been particularly strong this year with a powerful effect on the expected cash balance going well into the future. Most of the impact is on the revenue estimates to which we return later in this brief.
Comparing International budget balances
In the rest of the world there is a wide variety of experience so it is worth comparing Australia’s surplus with some other countries.
Table 8: International comparisons: Budget Balance as Percentage of GDP – 2008 Forecast
Country Budget Balance % of GDP Country Budget Balance % of GDP Country Budget Balance % of GDP
USA - 2.4 Netherlands 0.6 Hong Kong 3.0
Japan -2.9 Spain -0.7 India -3.1
China 0.5 Czech Rep. -2.5 Singapore 1.0
Britain -3.2 Denmark 3.6 South Korea 0.2
Canada 0.4 Hungary -4.1 Argentina 1.1
Euro Area -0.8 Norway 17.5 Brazil -1.8
Austria -0.4 Poland -2.0 Chile 7.0
Belgium -0.4 Russia 2.5 Luxembourg 1.2
France -2.9 Sweden 2.4 New Zealand 3.1
Germany 1.0 Switzerland 0.9 Saudi Arabia 17.9
Greece -2.6 Turkey -2.0
Italy -2.6 Australia 1.5
Budget Review 2008–09
Australia is one of a hand full of surplus countries, some other high-income countries being Canada, Denmark, Germany, Netherlands, Norway, Russia and Sweden. Of course, other countries are at different stages in their economic cycles and are subject to a host of other influences. One important difference between Australia and many other countries is that they are experiencing the inverse of Australia’s favourable terms of trade movements. Other notable countries are China and Saudi Arabia. China is interesting because of its importance for Australia and Saudi Arabia because it is a major resource-rich country. Saudi Arabia, like Norway, is one of the extreme outliers with a surplus approaching 18 per cent of GDP. Other nations are running significant deficits at the moment. It is interesting to look at some of the absolute amounts of budget deficits throughout the world. This figure is available on a consistent basis in $US from the International Monetary Fund World Economic Outlook database.30 For all the countries we can measure, combined budget balance is a deficit of $US867 billion forecast for 2008 of which the US alone accounts for $US634 billion.
Revenue issues
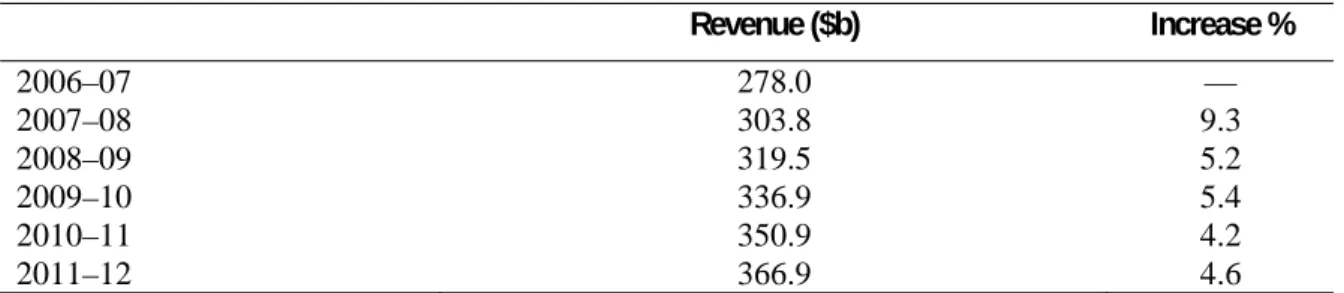
Budget surpluses are expected to continue into the future at least in part driven by revenue growth in the recent past which is expected to persist into the future. The following table projects the revenue figures into the future. It also includes the estimates and projections for GDP itself. The Budget Papers project revenue of $366.9 billion in 2011–12 or 26.1 percent of GDP. That is only marginally above the 25.9 per cent of GDP estimated for 2008–09.
Table 9: Revenue growth in the forward estimates.
Revenue ($b) Increase % 2006–07 278.0 — 2007–08 303.8 9.3 2008–09 319.5 5.2 2009–10 336.9 5.4 2010–11 350.9 4.2 2011–12 366.9 4.6
Source: Statement 3, Budget Paper No.1 2008–09, p. 3–5.
Australia’s recent experience suggests a tendency for revenue to come in much higher than expected. There is even more reason than normal to think that the revenue growth in the ‘out-years’ (2009–10 to 2011–12) will exceed the Budget figures. The reasoning is simply that the revenue growth in these years is based on the projection assumption of 2.5 per cent growth in the CPI. The RBA has published inflation forecasts through to December 2010 which significantly exceed these projections. If the RBA is correct, then we would expect revenue projections are underestimated on that count. In addition, it is worth stressing that the forward projections for 2011–12 come in at roughly the same share of GDP as the 2008–09 estimate; 26.1 per cent and 25.9 per cent respectively. However, the scatter plot published in the Budget Papers shows that the elasticity of revenue with respect to GDP growth tends to exceed unity by a substantial margin.31 If so, we would expect that estimates of revenue to
30. IMF, ‘IMF Publications’, http://www.imf.org/external/pubind.htm, accessed 21 May 2008. 31. op. cit., Statement 5, Budget Paper No. 1 2008–09, p. 5–46.
GDP would show an upward trend in the forward estimates, at least once the effects of new measures wash out of the system. On that ground, the figures given in the Budget could be substantial underestimates. On the other hand, the RBA forecasts a period of economic growth well below the projections in the Budget Papers. If this occurs it could produce a large downward movement in revenues as discussed earlier.32
This year the Budget Papers contain a good deal of discussion about the disappointing performance in forecasting government revenue.33 The errors discussed there relate to recent years in which outcomes have been much greater than forecasts. A lot of the error is explained by underestimates in the forecast economic growth. When the economy is growing strongly there is a tendency to underestimate. If we look at the historic performance we find that when the economy is weak there is a tendency to overestimate economic growth— historically the Budget Papers did not forecast any of the recessions Australia has experienced since the early 1950s.34 It might be hoped that economic forecasts would gradually improve. However, that may not be the case. The former Governor of the Reserve Bank of Australia, Mr Ian Macfarlane, in evidence to the House of Representatives Committee on Economics, Finance and Public Administration made the following point about economic forecasting:
Economic forecasting is a very imperfect art—I would not use the word 'science.' It, by and large, has not improved in 30 years. I have been through all the attempts to improve it—all the large econometric models, the small econometric models, the leading indicators, all the surveys of expectations—and basically it is about the same as it always was.35
Tax Summit
Following the 2020 Summit the Prime Minister announced a tax summit. There were no details, just that bald statement. The 2008–09 Budget clarifies the nature of the review of the tax system.36 Essentially the review will consider:
1. the ‘balance of taxes on work, investment and consumption’ 2. the role for environmental taxes
3. the interaction of the tax and social security system on affected people and families 4. taxes on savings, assets, investment income and company income
32. The Budget projections are given in Budget Paper No1, Statement 1, op. cit., p. 1–3 while the Reserve Bank forecasts are given in the Statement on Monetary Policy, 9 May 2008, op. cit., p. 68.
33. ‘Appendix D: Forecast performance’, in Budget Paper No. 1 2008–09, Statement 5, p. 5–45. 34. See D Richardson, ‘Official economic forecasts: how good are they?’, Parliamentary Library
Current Issues Brief no. 17, 2000–01, 26 June 2001.
35. I. Macfarlane, ‘Reserve Bank of Australia annual report 1999-2000’, House of Representatives Standing Committee on Economics, Finance and Public Administration, Hansard, 11 May 2008, Melbourne, p. 16,
http://parlinfoweb.parl.net/parlinfo//Repository/Commttee/Commrep/Linked/1254-2.PDF, accessed on 21 May 2008.
Budget Review 2008–09
5. taxation of consumption but excluding the GST
6. simplifying the total tax system at all levels of government, and
7. the interrelations between the various taxes and with the proposed emissions trading system.
A discussion paper is due to be released by the end of July 2008 and a final report is to be produced by the end of 2009.
The ‘China effect’ on revenue
Treasury presents a useful discussion of the effects of the terms of trade increase on the tax revenue. Over recent years, there has been discussion to the effect that the resources boom has created windfall tax revenue that can disappear as quickly as it arrived. Hence, it is argued that the windfall tax should not add to recurrent spending levels that would be unsustainable when the resources boom dies down.
The Budget estimates that the terms of trade effect will have increased tax revenue by $33 billion in 2008–09.37 That may seem a large increase to be generated by mining which contributed a gross real value added of a modest $65 billion in 2006–07, the latest full year figure available.38
The implication of the Budget Paper estimate seems to be that the resources boom has increased revenue by $33 billion and, without any commensurate increase in spending, the surplus would have been higher by that amount. In other words, the resources boom has given the government another $33 billion in new revenue to do with as they will. Certainly, that is the message from people such as Chris Richardson from Access Economics, a respected private consultancy company, although his own estimate differs from the latest Budget Paper figure.39 However, this sort of approach may significantly overstate the effect of the resources boom on revenue. Before explaining that issue, it should be pointed out that the $33 billion estimate of the effect of the resources boom is only ever mentioned in Box 2 on pages 5–14 and 5–15 in Statement 5 of Budget Paper No. 1 2008–09. That estimate is not referred to in commentary anywhere else in the Budget Papers. Perhaps the authors of the Budget Papers have provided that estimate as a service to readers but are not confident enough in the methodology to use it in their discussion. Nevertheless it is worth going through the exercise.
The effect of the resources boom on revenue is calculated by adjusting the national accounts magnitudes for the terms of trade effect. The Australian Bureau of Statistics (ABS) does that when they estimate the ‘real net national disposable income’. The full account may be too technical, but essentially what they do is boost the export component by the amount export prices have exceeded import prices. That gives a measure of the extent to which the country is wealthier when Australia’s exports can purchase more imports. That is the purpose of
37. op. cit., Statement 5, Budget Paper No. 1 2008–09, Box 2, p. 5–14.
38. Figure taken from: ABS, Australian National Accounts: National Income, Expenditure and Product, December 2007, Cat no 5206.0, 5 March 2008. Incidentally, the real value is based on 2005–06 prices.
making the calculations. However, this is a pure valuation effect. A simplified example is given in Appendix A.
To argue that taxes are higher as a result of these new valuations, it has to be admitted that the value of expenses must also have risen by a similar amount. In fact, what the ABS has done in calculating national accounts magnitudes is to revalue all of the magnitudes that are recorded in the national accounts. If the value of taxation has risen, then so too has the value of the unemployment benefit, the cost of infrastructure projects and many other items. There need not be any more resources available to government.
This is not to argue that the mining boom has not generated some windfall gain in revenue. Clearly it has and we can see that in the extraordinary increases in the profits being earned by BHP Billiton, Rio Tinto and other mining companies. Those profit increases have generated commensurate increases in company tax by those companies. However, the amounts are likely to be much more modest than the Budget Papers suggest.40
The pattern of spending
This section examines the changing priorities in the new Government’s spending initiatives. In the Budget Speech the Treasurer announced emphasis on the Working Families Support Package together with emphasis on the themes of education, health, climate change and others. The purpose in this section is to examine how those priorities affect the patterns of spending and taxing.
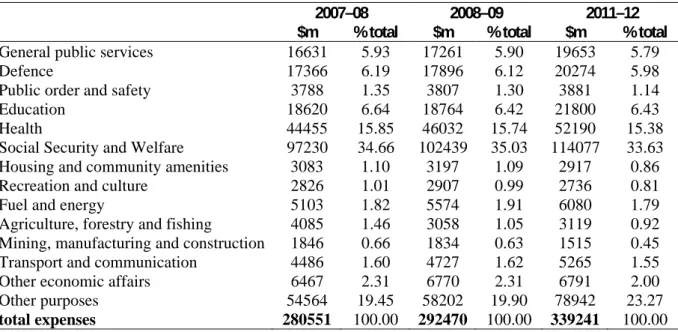
Table 10: Expenses by Function
2007–08 2008–09 2011–12 $m % total $m % total $m % total General public services 16631 5.93 17261 5.90 19653 5.79
Defence 17366 6.19 17896 6.12 20274 5.98
Public order and safety 3788 1.35 3807 1.30 3881 1.14
Education 18620 6.64 18764 6.42 21800 6.43
Health 44455 15.85 46032 15.74 52190 15.38
Social Security and Welfare 97230 34.66 102439 35.03 114077 33.63 Housing and community amenities 3083 1.10 3197 1.09 2917 0.86 Recreation and culture 2826 1.01 2907 0.99 2736 0.81 Fuel and energy 5103 1.82 5574 1.91 6080 1.79 Agriculture, forestry and fishing 4085 1.46 3058 1.05 3119 0.92 Mining, manufacturing and construction 1846 0.66 1834 0.63 1515 0.45 Transport and communication 4486 1.60 4727 1.62 5265 1.55 Other economic affairs 6467 2.31 6770 2.31 6791 2.00 Other purposes 54564 19.45 58202 19.90 78942 23.27
total expenses 280551 100.00 292470 100.00 339241 100.00
Source: Statement 6, Budget Paper No. 1 2008–09, p. 6–5.
We have already noted that total spending will decline gradually as a share of GDP over the forward estimates. The following table is constructed to illustrate how the actual spending
40. According to their latest annual reports, Australian income tax collected from BHP Billiton and Rio Tinto was US $2768 million and US $1378 million respectively for the year 2006–07.
Budget Review 2008–09
priorities have changed from the last Howard Government Budget to the first Rudd Government Budget as expressed in the estimates for 2008–09 and through to the end of the forward estimates period in the year 2011–12. That gives a total run of five years to observe the change in priorities.
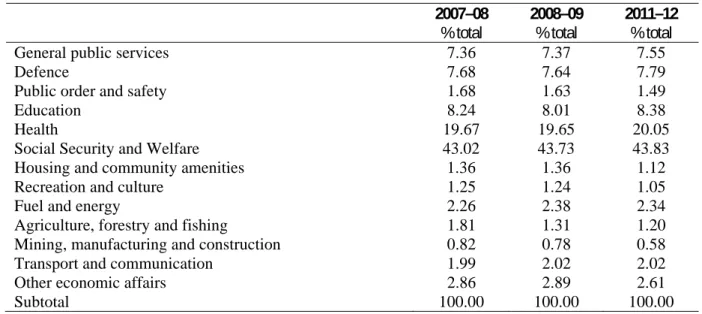
Most of the categories here show a downward movement except for ‘other purposes’ which show an increase from 19.45 per cent of outlays in 2007–08 to 23.27 per cent in 2011–12. This is the only spending category to increase as a share of total expenses. The main reason is that ‘other purposes’ includes the payment of the GST revenue to the states and territories. Those GST payments will increase as a share of expenses only because they would be expected to grow at roughly the same rate as GDP, whereas total expenses are projected to fall as a share of GDP. The following table attempts to adjust for that bias by excluding ‘other purposes’.
Table 11: Expenses excluding ‘Other purposes’ as a share of the total
2007–08 2008–09 2011–12
% total % total % total
General public services 7.36 7.37 7.55
Defence 7.68 7.64 7.79
Public order and safety 1.68 1.63 1.49
Education 8.24 8.01 8.38
Health 19.67 19.65 20.05
Social Security and Welfare 43.02 43.73 43.83
Housing and community amenities 1.36 1.36 1.12
Recreation and culture 1.25 1.24 1.05
Fuel and energy 2.26 2.38 2.34
Agriculture, forestry and fishing 1.81 1.31 1.20 Mining, manufacturing and construction 0.82 0.78 0.58
Transport and communication 1.99 2.02 2.02
Other economic affairs 2.86 2.89 2.61
Subtotal 100.00 100.00 100.00
Source: Parliamentary Library, calculations based on Table 10 above.
With those adjustments, we are able to more clearly see the changes in the pattern of expenses. We can appreciate that most of the changes are fairly moderate, even going from the last Howard Government Budget to the Rudd Government Budget four years out. The main commentary is developed in the specific issues briefs contained in this publication but some main points include:
• General public services shows a modest increase in its share of spending. That seems to be
mainly a result of a new commitment to foreign aid reflecting the commitment to gradually increase aid to 0.5 per cent of Australia’s Gross National Income
• Defence was promised a guaranteed real increase of 3 per cent per annum in the
‘underlying funding base’ but that has not showed up as a major increase in defence as a share of the functions in Table 11. Rather defence increases its share by a modest 0.11 per cent
• Public order and safety actually shows a significant decline over the forward estimates.
Expenditure in this category seems to have levelled out in nominal values
• Education shows a minor increase over the whole period but with a low in 2008–09 which
seems to be mainly due to a gap between the end of the higher Education Special Projects scheme and the start of spending from the Higher Education Endowment Fund
• Social Security and Welfare, the biggest item by far, gets a boost mainly through family
payments and the age pension
• Housing and community amenities experience a decline • Recreation and culture experience a decline
• Fuel and energy increases slightly compared with the previous year but remains constant
after that
• Agriculture experiences quite a reduction down to 0.58 per cent of spending, mainly
because of the cessation of drought assistance
• Mining, manufacturing and construction experience a substantial fall due to the winding
down of some assistance programs
• Transport and communications remain roughly constant, and
• Other economic affairs will see a decline, mainly as a result of the restructuring of labour
market services.
The comments above do not take account of any of the major changes within the functional categories. The detail is left for the specific issues briefs below. In addition, our discussion here does not take account of any changes in tax expenditures which are similar to expenses in most respects. Tax expenditures receive only brief treatment in Budget Paper No. 1 2008-09 in a two page appendix to Statement 5.41 Note also that the tax expenditure statement is usually produced around six months after the Budget Papers.
The pattern of revenue
Turning now to the revenue patterns, the following table simplifies some of the figures in the Budget Papers and gives the share of revenue raised by the various tax categories.
Budget Review 2008–09
Table 12: Revenue by Function
2007–08 2008–09 2011–12 % total % total % total Individual and withholding tax 41.6 39.8 39.9
Fringe Benefits Tax 1.3 1.3 1.1
Super funds 4.0 3.1 3.4
Companies 21.2 22.9 23.3
Petroleum Resource Rent Tax 0.6 0.8 0.8
Total income tax 68.7 67.9 68.5
Sales tax (incl GST 14.8 14.9 15.4
Excise duty 8.0 8.0 7.5
Customs duty 1.8 1.8 1.5
other 0.8 0.9 0.8
Total indirect tax 25.5 25.6 25.2
Non tax receipts 5.8 6.5 6.3
Total 100.0 100.0 100.0
Source: Statement 5, Budget Paper No. 1 2008–09, p. 5–44.
It has to be stressed first that this table examines tax shares while, as we saw above, total tax revenue is expected to decline as a share of GDP. The first interesting thing to note is that individual and withholding tax is forecast to decline significantly in 2008–09 as tax cuts are introduced but will remain approximately constant after that. This category remains just under 40 per cent over the forward estimates. The next biggest category is company tax which is expected to increase substantially in 2008–09 and slightly more through to 2011–12. That appears to reflect anticipated healthy company profits over the forecast period. The contribution from super funds is expected to decline in 2008–09 and bounce back slightly after that. Changes to the treatment of super funds announced in earlier budgets are still flowing through.
Surpluses forever?
As noted above, the government has budgeted for a strong surplus for 2008–09 and into the future. According to the Budget Papers, the government’s strategy involves achieving budget surpluses over the medium term. The only attempt at justifying that is the sequitur that surpluses ‘contribute to a strong government balance sheet’.42 This does not seem entirely consistent with the remark by the Treasurer in the Budget Speech that:
We have no intention of hoarding the strong surplus for its own sake. This money is not ours, it belongs to the Australian people.43
The government has put a strong argument for a short-term surplus strategy. It wants to make substantial contributions to the three new funds out of which spending will be made in the future. Second, a surplus now suits the strategy to moderate the growth in aggregate demand on macroeconomic grounds. It can be appreciated that the government has a difficult macroeconomic balancing act. Moderating aggregate demand may well ease the risk of
42. op. cit., Statement 3, Budget Paper No. 1 2008–09, p. 3–3. 43. op. cit., W. Swan, Budget Speech 2008–09, p. 10.
higher inflation and lessen the need for the RBA to take action. However, reducing aggregate demand will most likely reduce employment growth at a time when the unemployment rate is forecast to increase from the present 4.2 per cent to 4.75 per cent in the June quarter 2009. The macroeconomic aspects of the Budget are discussed in the Economic Outlook section above.
A consequence of the run of surpluses is that the net worth of the Australian Government is expected to increase by $25.2 billion in 2008–09, equal to the real cash surplus in 2008–09 (when the Future Fund is added back). Net worth is expected to increase by similar amounts in the subsequent years.44 By the end of 2012, it is anticipated that the government will hold financial assets with a gross value of $283.6 billion or approximately 20 per cent of GDP.45 That would be a significant share of the total capitalisation of the Australian stock market. At the moment the market capitalisation of the stock market is around 135 per cent of GDP. If that ratio is maintained then the government could be holding financial investments worth around 15 per cent of the companies listed on the stock exchange.
Governments from both sides of politics have in the past shed various businesses that they regarded as more appropriately owned and managed in the private sector. After two decades of selling assets to the market, we now have governments accumulating assets once more. That raises a series of awkward questions. Recently, there was a suggestion that Chinese interests might want to purchase a share of BHP Billiton (BHPB).46 It is not inconceivable that soon the government may have to consider a foreign takeover submission for a company such as BHPB while at the same time it owns a large share in that company—leading to a real and perceived conflict of interest.
This illustrates the double-edged sword that the surpluses represent. To run persistent surpluses means acquiring claims on the private sector. The alternative is to buy back old government debt but that came to an end when the former government was able to announce zero Commonwealth debt.47
A further concern is that surpluses become a measure of the fiscal responsibility of the government no matter what else is happening. Not that long ago the Budget Papers had to argue the case for a stimulatory fiscal stance. If there is an economic downturn in Australia there could well be an end to surpluses on the present settings. The automatic stabilisers would kick in as tax revenue contracts and expenditures increase. The effect is to cushion any macroeconomic downfall. A commitment to continuing surpluses would be incompatible with the appropriate macroeconomic response to a downturn.
44. op. cit., Statement 3, Budget Paper No. 1 2008–09, p. 3–18.
45. If the government continued to run surpluses indefinitely at 2 per cent of GDP while GDP itself is growing at 6 per cent of GDP in nominal terms, the ratio to GDP of the net financial assets held would asymptote to one third of GDP.
46. M. Vaughan, ‘BHP, Rio fire up market’, The Australian Financial Review, 15 May 2008, p. 1. 47. P. Costello, Budget Speech 2006–07, Commonwealth of Australia, Canberra, 2006.
Budget Review 2008–09
Appendix A: Adjusting national accounts magnitudes for the terms of trade effect
We can think of an economy producing 100 units of output of which 25 are exports. From the production of 100 units we all earn 100 units. We spend that on 75 units of home product and imports of 25 units of goods not available here.
Now, let the terms of trade double so that for every export we can now buy twice as many imports. We can still spend our 100 units on 75 units of home production and 25 units of imports. But we can buy twice the number of imports that we used to buy. So our spending is now the equivalent of 125 units if we calculate using the old import and export prices. That is true even though current production is unchanged at 100 units. We can now say the value of the economy is 25 per cent higher. The doubling of our terms of trade has now boosted our measure of well being by 25 per cent.
Now we can ask if there is any more tax revenue. Suppose we tax all Australians at 20 per cent raising 20 units so that the government can buy Australian products worth 20 units. Before and after the change in the terms of trade nothing has changed. We can now say that those taxes and spending are now worth 1.25 times 20 using the new valuation technique, but there is still nothing left over for the government as a surplus. A surplus would only arise if the government spent money on 20 units of imports and so did not need to spend as much after the doubling of the terms of trade.
We can take this example further and consider various other combinations but the point is made. Terms of trade effects themselves do not necessarily change the government tax take. However, it should be pointed out that the above example assumes the change is due to a fall in import prices which alters the terms of trade. But it would also apply to the case where export prices increase but the exchange rate and other adjustments are made so that the value of non-traded goods increases in line with export prices. The RBA Statement on Monetary Policy includes a graph that shows the real exchange rate has indeed closely tracked the terms of trade.48
Communications, broadband and the digital economy
Jonathan Chowns
Economics Section
There were few new communications initiatives announced in the 2008–09 Budget. The high value measures—such as the cancellation of the OPEL contract, the building of a national broadband network and the extension of the Australian Broadband Guarantee—were announced prior to the Budget.
National Broadband Network
The Budget makes no allocation for the construction of the National Broadband Network (NBN) because the extent and timing of the Commonwealth’s commitment will not be known until the procurement process for the NBN has been completed.49 However, allowance for the NBN, and other measures, is made in a contingency reserve.50 There is also provision for departmental expenses for managing the NBN process.51
The
contribute $4.7 billion towards the building of a ‘national broadband network’.52 It is intended that the network will reach 98 per cent of households and businesses and will provide speeds of no less than 12 megabits per second. Labor promised that work would commence on the network before the end of 2008.
Of that funding, $2 billion was to come
provide an income stream to fund the previous government’s response to the
recomm
RTIRC). The RTIRC is reviewing the adequacy of telecommunications services in regional, rural and remote parts of Australia.
The budget papers elaborate on the proposed method of funding for the NBN. The Commonwealth will set up the ‘Building Australia Fund’ (the BAF) which will be used to finance infrastructure projects, including the NBN and the government’s response to the RTIRC recommendations. Amongst other funding, the BAF will receive the $2.4 billion in the Communications Fund, which will then be closed. The BAF will also receive $2.7 billion of the $6.6 billion in final instalment payments from the most recent sale of the
49 Australian Government, ‘Part 2: Expense Measures’, Budget Paper No. 2: Budget Measures 2008–09, Commonwealth of Australia, Canberra, 2008, p. 99.
50. Australian Government, ‘Statement No. 6: Expenses and Net Capital Investment’, Budget Paper No. 1: Budget Strategy and Outlook 2008–09, Commonwealth of Australia, Canberra 2008, p. 6–34; Australian Government, ‘Part 2 Expense Measures’, Budget Paper No. 2: Budget Measures 2008–09, Commonwealth of Australia, Canberra, 2008, p. 99.
51. Australian Government, ‘Part 2 Expense Measures’, Budget Paper No. 2: Budget Measures 2008–09, Commonwealth of Australia, Canberra, 2008, p. 98.
52 K. Rudd (Prime Minister), Building a National Broadband Network, media release, Canberra, 21 March 2007, http://www.alp.org.au/media/0307/pcloo210.php, accessed on 21 May 2008.
Budget Review 2008–09
Commonwealth’s interest in Telstra (known as the T3 sale), which are due on 29 May 2008.53
On 11 March 2008, the Minister for Broadband, Communications and the Digital Economy the membership of the Expert Panel which was to determine the manner in which the request for proposals/tender (RFP/T) for the NBN would be conducted and to assess any proposals that are submitted.54
On 11 April 2008, the Minister for the
NBN.55 Submissions on regulatory issues are due on 25 June 2008 and the RFP/T closes on 25 July 2008. The outcome of this process will inform the Commonwealth’s consideration of scale and timing of its financial commitment.
Cancellation of OPEL contract
The budget papers report savings of $959.3 million over three years from the termination of the contract with OPEL Networks (a joint venture between Optus and Elders). This provided for the development of infrastructure to provide broadband services to about 3.7 million premises in rural and regional Australia. The contract had been entered into in June 2007, during the term of the previous government and the term on 2 April 2008.56
The funding was originally to be $600 million but was extended, controversially, to approximately $958 million prior to the contract being awarded. The original funding was from the $600 million Broadband Connect infrastructure program (which in turn was part of
the previous government’s $1.1 billion
the previous government on 17 August 2005).57
From the time of the 2007 election, there had been speculation about whether the new government would continue with the OPEL contract because the Minister, when in opposition, had been critical of the wireless standard (WIMAX) that was to be used by
53. Australian Government, Portfolio Budget Statements 2008–09: Budget related paper No. 1.8, Finance and Deregulation portfolio, Commonwealth of Australia, Canberra, 2008, p. 16.
54. S. Conroy, Government announces Panel of Experts to assess National Broadband Network proposals, media release, 11 March 2008,
http://www.minister.dbcde.gov.au/media/media_releases/2008/government_announces_panel_ of_experts_to_assess_national_broadband_network_proposals, accessed on 21 May 2008. 55. S. Conroy, Government invites National Broadband Network proposals, media release,
11 April 2008, http://www.minister.dbcde.gov.au/media/media_releases/2008/023, accessed on 21 May 2008.
56. S. Conroy, OPEL Networks Funding Agreement not to proceed, media release, 2 April 2008, http://www.minister.dbcde.gov.au/media/media_releases/2008/019, accessed on 21 May 2008. 57. The elements of the $1.1 billion Connect Australia package were $878 million for Broadband
Connect, $113 million for Clever Networks, $30 million for Mobile Connect and $90 million for Backing Indigenous Ability.
OPEL, but he gave assurances that the contract would continue.58 That assurance was
on the basis that OPEL had failed to meet a
particular contractual obligation concerning the area to be covered by the network extension.
Extension of Australian Broadband Guarantee
the continuation of the Australian Broadband
Guarantee (ABG).59 The ABG was an initiative of the previous government that was announced by the then Minister for Communications, Information Technology and the Arts on 7 March 2007.60 The ABG evolved from the Broadband Connect incentive scheme (the other limb being the infrastructure scheme already mentioned). The ABG, like the Broadband Connect incentive scheme, provides broadband service subsidies (rather than infrastructure funding). The subsidies aim to provide metropolitan-comparable services to underserved areas until the NBN is built and for the remaining two per cent of the population outside the reach of the NBN. Some of the increased funding for the ABG is attributable to the termination of the OPEL contract which aimed to provide broadband services in regional and rural Australia within the period for which ABG funding has been increased.
58. ABC television, ‘Conroy discusses the state of play for broadband’, Inside Business, 10 February 2008, http://www.abc.net.au/insidebusiness/content/2007/s2158854.htm, accessed on 21 May 2008.
59. S. Conroy, Australian Broadband Guarantee funding until 2012, media release, 13 May 2008, http://www.minister.dbcde.gov.au/media/media_releases/2008/032, accessed on 15 May 2008. 60. H. Coonan, $162.5 million for Australian Broadband Guarantee, media release, 7 March 2007,
http://parlinfoweb.aph.gov.au/piweb/TranslateWIPILink.aspx?Folder=pressrel&Criteria=CITA TION_ID:S0IM6%3B, accessed 15 May 2008.
Budget Review 2008–09
Personal income tax and personal capital gains tax
Leslie Nielson
Economics Section
In contrast to previous Budgets, this one was remarkable for not including further reductions in personal income tax. The government has also announced that it will extend the current Capital Gains Tax (CGT) small business concessions and provide CGT relief for shares received as the result of a demutualisation of health insurers. Additionally, the government will also alter the way receipts arising from the cancellation of interest in widely held entities are treated for CGT purposes.
There were initiatives to reduce the amount of personal income tax paid, but these initiatives were carefully targeted. Further, the income threshold for the payment of both the Medicare Levy and Surcharge were also increased. However, there were some significant changes in the eligibility for some personal income tax deductions for higher income earners. Following are further details of these changes.
Personal Income Tax
The proposed reductions in personal income tax are contained in Tax Laws Amendment (Personal Income Tax Reduction) Bill 2008, which is before the Senate as at the date of writing. In general, the Treasurer confirmed that the proposed reductions in personal income tax, and increases in the Low Income Tax Offset (LITO) would go ahead.61 Table 1 summarises these changes for resident tax payers.
Table 1: Proposed changes in personal income tax rates and thresholds for resident tax payers
From 1 July 2008 From 1 July 2009 From 1 July 2010
Thresholds Rate Thresholds Rate Thresholds Rate
0 6 000 0 0 6 000 0 1 6 000 0
6 001 34 000 15 6 001 35 000 15 6 001 37 000 15
34 001 80 000 30 35 001 80 000 30 37 001 80 000 30
80 001 180 000 40 80 001 180 000 38 80 001 180 000 37 180 001 and over 45 180 001 and over 45 180 001 and over 45
LITO value $1 200 LITO value $1 350 LITO value $1 500 Source Budget Paper No.2, 2008–09, p. 14.
Impact of changes
Table 2 shows the amount of tax paid, at various income levels, taking into account the changes in the low income tax offset only. The figures in bold represent average weekly ordinary time earnings.
61. W. Swan, Treasurer, ‘Second reading speech: Appropriation Bill No. 1 2008–2009’, House of Representatives, Debates, 13 May 2008, p. 37.