Title
A hybrid brain-computer interface combining the EEG and NIRS
Author(s)
Ma, L; Zhang, L; Wang, L; Xu, M; Qi, H; Wan, B; Ming, D; Hu, Y
Citation
The 2012 IEEE International Conference on Virtual
Environments, Human-Computer Interfaces, and Measurement
Systems (VECIMS 2012), Tianjin, China, 2-4 July 2012. In IEEE
VECIMS Proceedings, 2012, p. 159-162
Issued Date
2012
URL
http://hdl.handle.net/10722/181798
Rights
IEEE International Symposium on Virtual Environments,
Human-Computer Interfaces and Measurement Systems Proceedings.
Copyright © IEEE.
A Hybrid Brain-Computer Interface Combining the
EEG and NIRS
Lan Ma, Lixin Zhang, Lu Wang, Minpeng Xu, Hongzhi Qi, Baikun Wan, Dong Ming*
Department of Biomedical Engineering Tianjin University
Tianjin 300072, China * ([email protected])
Yong Hu
Department of Orthopaedics and Traumatology Kai Shing Faculty of Medicine
The University of Hong Kong Hong Kong, China
Abstract—Compared to the conventional brain-computer interface (BCI) system, the hybrid BCI provides a more efficient way for the communication between the brain and the external device. The Electroencephalography (EEG) signal and the change of oxygenation in the brain are two prevailing approaches used in the BCI. However, single physiological signal couldn’t provide enough information for a satisfied BCI. This paper proposes a hybrid BCI system based on the combination of the EEG signal and the cerebral blood oxygen changes measured by the near-infrared spectroscopy system (NIRS) to detect the state of motor imagery (MI). The result shows that the average recognition rate can achieve above 75.04% and the highest rate 91.11%, which are higher than when only using EEG or NIRS. It suggests that the proposed hybrid BCI system has a good performance in the combination of these two different signals. Further investigation may help develop better BCIs with high accuracy and significant efficiency.
Keywords- Hybrid BCI; EEG; NIRS;Motor imagery I. INTRODUCTION
A brain–computer interface (BCI) is a direct communication pathway between the brain and an external device [1]. BCIs are often directed at assisting, augmenting, or repairing human cognitive or sensory-motor functions and have focused primarily on neuroprosthetics applications that aim at restoring damaged hearing, sight and movement.
Electroencephalography (EEG) measures scalp voltage fluctuations resulting from ionic current flows within the neurons of the brain [2,3]. EEG based BCI has been most studied, due to its fine temporal resolution, easy recording and low set-up cost. Many patients with amyotrophic lateral sclerosis benefit from the successful use of such BCI systems [4,5,6]. Ivan Volosyak presents a EEG-based Bremen BCI system, which allowed one of the subjects in an online experiment to reach a peak information transfer rate (ITR) of 124 bit/min [7].
EEG-bases BCIs have many different modalities, such as P300, steady-state visual evoked potential (SSVEP), and motor imagery (MI) [8]. This study focuses on motor imagery by which an individual rehearses or simulates a given action [9].It has been proved that motor imagery retains many of the properties, in terms of temporal regularities, programming
rules and biomechanical constraints, which are observed in the corresponding real action when it comes to execution [10]. It is now widely used as a technique to enhance motor learning and to improve neurological rehabilitation in patients after stroke [11,12].
When people think, the oxygen content of blood will change in the brain which can be measured by the near-infrared spectroscopy (NIRS). BCI systems based on the NIRS have been developed rapidly in recent. R. Sitaram et al develop a motor imagery based BCI by using NIRS measured oxyhemoglobin signals. NIRS systems have also been successfully applied to the research of working memory and emotion changes [13,14].
In recent years, BCI paradigms combining two different mental control signals, called “hybrid BCIs”, have been studied increasingly as a potent approach to improve BCI system [15,16]. A hybrid BCI is composed of two BCIs, or at least one conventional BCI and another system. Hybrid BCIs could involve a second type of input operating sequentially and/or simultaneously. The second input might be another BCI, which might require the user to perform additional mental tasks. The second input might use on other physiological signals [17]. A hybrid BCI controls faster and has a higher accuracy rate. This paper proposes a hybrid BCI system based on the combination of the EEG signal and the cerebral blood oxygen changes measured by the near-infrared spectroscopy system (NIRS) to detect the state of motor imagery.
II. MATERIALS AND METHODS A. Subjects
Six participants (four males and two females), aged from 22~26, right-handed, without any antecedent of neurologic or orthopedic impairment affecting upper limbs take part in the experiment. All participants were informed of the procedure and the natural consequence of the study and signed the consent. All participants have passed the movement imagery questionnaire and they have a training time before experiment. B. Experiment
This study took motor imagery as the mental task. During the experiment the participant sat in front of a computer monitor and viewed a direction cartoon. One complete mental
task followed the chronological order shown as Fig. 1. First, it started with a 5-second resting stage (RS) in which subjects were asked to keep calm and relax themselves. Then, after a cue lasting one second, subjects were asked to follow the tips on the screen to image their right or left hand movement for 7 seconds with no actual movement during the imagery stage (IS). After a daily training for a week, each subject performed 450 complete tasks which were equally divided into 15 sets. Between every two sets, there were 5 minutes for subjects to have a rest.
Figure 1. the chronological order of a completed mental task C. Date recording and perporcessing
Figure 2. The structure schematic drawing of the system
There are two different types of channels to detect the brain activities. The structure schematic drawing of the system is given in Fig. 2. This system includes two parts: the EEG acquisition sub-system which involves electrodes, EEG signal amplifier (type: 9216SM, made by SYMTOP Company), and the data acquisition card (DAQ card, type: USB-6251, made by National Instrument Company) and the Blood oxygen acquisition system which involves near-infrared lights (760nm), constant current driver, photo detectors, and the DAQ card.
Two EEG electrodes, two near-infrared lights and six photo detectors were fixed on a shading material set on the forehead. The EEG electrodes were located FP1 and FP2 following the 10-20 system. Each referenced to an electrode put on the right ear. The near-infrared lights were located in line with the EEG electrodes and between them. Six photo detectors (Z1, Z2, Z3, Z4, Z5 and Z6) were equally set into two parallel lines shown as Fig. 2. The channels from left to the right at the top row are: Z1, Z2, Z3. And the channels from left to the right at the underneath row are: Z4, Z5, Z6. Each photo detectors had a distance of 2.89cm from the nearest near-infrared light. And the distance between the near-infrared light was 3.75cm.
When subjects executed the mental task, the EEG signal and the cerebral blood oxygen were changing accordingly. The electrodes set on the forehead transported the changed EEG signal to the amplifier whose outputs link to the DAQ card. With the same time, the photo detector located on the forehead
received the reflected light emitted by the near-infrared light through the cerebral cortex and sent to the DAQ card. All these signals are stored in the computer after digital conversion by the DAQ card at a sample frequency of 1000Hz.
In the pre-processing, the EEG signal was bandpass filtered at 0.1 to 30 Hz while the cerebral blood oxygen signal was bandpass filtered at 0.06 to 0.09 Hz. And then the EEG signal was down sampled at 250Hz while the cerebral blood oxygen signal at 10 Hz.
D. Support vector machine
The principal idea of the support vector machine (SVM) [18] is to find the separating hyperplane between two classes, so that the distance between the hyperplane and the closest points from both classes is maximal. In other words, it needs to maximize the margin between the two classes. Since the EEG signal is nonlinear and is not the case that two states are linearly separable, we used a support vector machine with the Gaussian radial-basis function
) exp( ) , (fi fj fi fj 2 K (1) as a kernel. fi and fj are the support vectors in the feature space. The outcome of the SVM for a new sample is the value for
n i i i iyK f f b w b w f y 1 ) , ( ) , , ( (2) Where fi are the support vectors chosen from the training set with known class labels and wi are lagrange multipliers.III. RESULTS
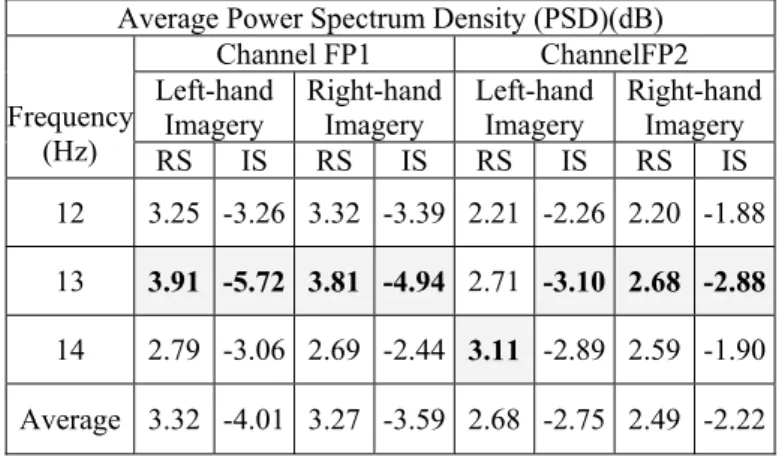
TABLE 1. The average PSD of different mental states
Event related desynchrony (ERD) is a common phenomenon when people executes motor imagery. The phenomenon is often found on the sensorimotor area by means of power spectrum density analysis (PSD). In this study, PSD were used to analyze the EEG signals.
Table 1 shows the average PSD during the resting stage (RS) and the imagery stage (IS) at the frequency range from 12 to 14 Hz. For each condition, the largest absolute value is in dark background. Most of them are at 13 Hz. As can be seen from the table, it is easy to distinguish the motor imagery from the resting state as the average PSD of the motor imagery is
Average Power Spectrum Density (PSD)(dB)
Channel FP1 ChannelFP2
Left-hand
Imagery Right-hand Imagery Left-hand Imagery Right-hand Imagery Frequency (Hz) RS IS RS IS RS IS RS IS 12 3.25 -3.26 3.32 -3.39 2.21 -2.26 2.20 -1.88 13 3.91 -5.72 3.81 -4.94 2.71 -3.10 2.68 -2.88 14 2.79 -3.06 2.69 -2.44 3.11 -2.89 2.59 -1.90 Average 3.32 -4.01 3.27 -3.59 2.68 -2.75 2.49 -2.22
negative while the average PSD of the resting stage is positive whether at channel FP1 or channel FP2.
However, the electrodes located in the opposite sides to the hand doesn’t have a steady larger absolute PSD than that located in the same sides when subjects perform right or left motor imagery. For example, the absolute PSD of the right-hand motor imagery at the channel FP1 (-5.72) is larger than that at the channel FP2 (-3.10), which is in according with the lefthand motor imagery (the PSD is 4.94 at channel FP1 and -2.88 at channel FP2). In addition, the absolute PSD at the channel FP1 is almost larger than that at the channel FP2 in the same condition. For example, channel FP1 has a larger value than channel FP2 at 13 Hz when subjects were in resting stage.
In most cases, the absolute PSD of the left-hand imagery is larger than that of the right-hand imagery at the corresponding electrodes. But a paired t-test shows there is no significant difference between them. Thus the state of left-hand imagery and the right-hand imagery were easy to mix-up in terms of the PSD features at channel FP1 and FP2.
TABLE 2. Average amplitude of the cerebral blood oxygen signal at 0.06-0.09Hz
Channel Left-hand Imagery Right-hand Imagery RS IS RS IS Z1 3.11 -3.42 4.78 -4.67 Z2 3.59 -1.98 3.54 -3.53 Z3 4.66 -3.55 5.45 -4.14 Z4 4.80 -5.66 7.35 -7.32 Z5 1.52 -2.17 3.73 -7.06 Z6 1.08 -5.85 3.11 -4.00
This study used 760nm LED as a light source to provide near-infrared light, whose primary absorber at the brain tissue is deoxyhemoglobin. It supposes that the concentration of deoxyhemoglobin only changed when subjects perform mental task. So the intensity of reflected light detected by the photo detector changed with a period lasting 18 seconds. In other words, there is a 0.077Hz-frequency wave which carries vital information about cerebral blood oxygen changes induced by the motor imagery.
Table 2 shows the average amplitude of the cerebral blood oxygen signal at 0.06-0.09Hz. Just as the EEG signal, the cerebral blood oxygen changes show similar trends. For each mental state, the largest absolute value is in dark background. Most of them are at channel Z4. On the basis of the table, it is easy to distinguish the motor imagery from the resting state as the average amplitudes of the motor imagery are negative while the resting stage is positive at all channels.
As can be seen from the table, the absolute value of the left motor imagery at the channel Z3 (-3.55) is larger than that at the channel Z1 (-3.42) while the right-hand motor imagery (the absolute value is -4.67 at channel Z1 and -4.14 at channel Z3). In a similar way, the absolute value of the left motor imagery at the channel Z6 5.85) is larger than that at the channel Z4 (-5.66) while the right-hand motor imagery (the absolute value is -7.32 at channel Z4 and -4.00 at channel Z6).
Mostly, the absolute value of the right-hand imagery is larger than that of the left-hand imagery at the corresponding photo detectors. But there also a paired t-test shows that no significant difference appears between them. Therefore it is hard to tell the state of left-hand imagery from the right-hand imagery by the cerebral blood oxygen changes at all channels.
Figure 4. The classification accuracy of all subjects when using different features
As the different kinds of mental tasks are hardly to be separated by the EEG signal or the NIRS signal in terms of the PSD analysis, we try to distinguish the imagery state from rest state of the brain. In this study, there are three different kinds of features: the EEG signal feature, the cerebral blood oxygen feature and the combination feature of them. SVM was used for mental state recognition. 5-fold cross validation was adopted to make the classification accuracy robust. The results show that the averaged accuracy of combined features can achieve 82.79%, which are higher than the others (Fig. 4). For all subjects, the combination features achieve a higher accuracy than other single features. The single EEG feature has a higher accuracy than that of the single NIRS feature for the most of the subjects. The maximum accuracy of 91.11% can be found in the combination features for subject 2. While the EEG feature only achieves 87.78% to the max and the NIRS feature achieves 79.45%.
IV. DISCUSSION
Different from conventional motor imagery signal recording methods and positions, this study records the EEG and NIRS simultaneously on the forehead area. The PSD features of the EEG signal and amplitude of the NIRS signal are taken in consideration for analyzing the brain activities. It is clear that the imagery stage can be easily separated from the resting stage no matter which kind brain signal is used, but it is difficult to make a distinction between left and right hand movement.
From the view of the classification results, the combination of both features is better than the single EEG or NIRS feature to separate the imagery state from the rest state. It implies the good performance of the proposed hybrid BCI system and needs further researches to develop a greater efficiency system.
ACKNOWLEDGMENT
This research was supported by National Natural Science Foundation of China (No. 30970875, 90920015, 61172008, 81171423), National Key Technology R&D Program of the
Ministry of Science and Technology of China (No. 2012BAI34B02) and Program for New Century Excellent Talents in University of the Ministry of Education of China.
REFERENCES
[1] Zander TO, Kothe C, “Towards passive brain-computer interfaces: applying brain-computer interface technology to human-machine systems in general,” J Neural Eng. Vol. 8, pp 025005, April 2011. [2] Silvoni S, Ramos-Murguialday A, and Cavinato M, “Brain-computer
interface in stroke: a review of progress,” Clin EEG Neurosci. Vol. 42, pp 245-52, October 2011.
[3] Saa JF, Cetin M, “A latent discriminative model-based approach for classification of imaginary motor tasks from EEG data,” J Neural Eng. Vol. 9, pp 026020, March 2012.
[4] Nijboer F, Sellers EW, and Mellinger J, “A P300-based brain-computer interface for people with amyotrophic lateral sclerosis,” Clin Neurophysiol. Vol. 119, pp 1909–1916, August 2008.
[5] Sellers EW, Vaughan TM, and Wolpaw JR, “A brain-computer interface for long-term independent home use,” Amyotroph Lateral Scler. Vol. 11, pp 449-455, October 2011.
[6] Vaughan TM, McFarland DJ, and Schalk G, “The Wadsworth BCI Research and Development Program: at home with BCI, ” IEEE Trans Neural Syst Rehabil Eng. Vol. 14, pp 229-233, October 2006.
[7] Volosyak I, “SSVEP-based Bremen-BCI interface--boosting information transfer rates,” J Neural Eng. Vol. 8, pp 036020, June 2011.
[8] Jeannerod M, “Neural simulation of action: a unifying mechanism for motor cognition,” Neuroimage. Vol. 14, pp 103-109, July 2001.
[9] Mulder T, de Vries S, and Zijlstra S, “Observation, imagination and execution of an effortful movement: more evidence for a central explanation of motor imagery,” Exp Brain Res. Vol. 163, pp 344-351, June 2005.
[10] Jackson PL, Lafleur MF, and Malouin F, “Potential role of mental practice using motor imagery in neurologic rehabilitation,” Arch Phys Med Rehabil. Vol. 82, pp 1133-1141, August 2001.
[11] Sjoerd de Vries and Theo Mulder, “Motor imagery and stroke rehabilitation: a critical discussion,” J Rehabil Med. Vol. 39, pp 5-13,January 2007.
[12] Pichiorri F, De Vico Fallani F, and Cincotti F, “Sensorimotor rhythm-based brain–computer interface training: the impact on motor cortical responsiveness,” J Neural Eng. Vol. 8, pp 025020, April 2011. [13] Power SD, Kushki A,and Chau T, “Automatic single-trial
discrimination of mental arithmetic, mental singing and the no-control state from prefrontal activity: toward a three-state NIRS-BCI,” BMC Res Notes. Vol. 5, pp 141, March 2012.
[14] Fazli S, Mehnert J, and Steinbrink J, “Enhanced performance by a hybrid NIRS-EEG brain computer interface,” Neuroimage. Vol.59, pp 519-529, January 2012.
[15] Müller-Putz GR, Breitwieser C, and Cincotti F, “Tools for Brain-Computer Interaction: A General Concept for a Hybrid BCI,” Front Neuroinform. Vol. 5, pp 30, November 2011.
[16] Pfurtscheller G, Allison BZ, and Brunner C, “The hybrid BCI,” Front Neurosci. Vol.4, pp 30, April 2010.
[17] Brunner C, Allison BZ, and Altstätter C, “A comparison of three brain-computer interfaces based on event-related desynchronization, steady state visual evoked potentials, or a hybrid approach using both signals,” J Neural Eng. Vol. 8, pp 025010, March 2011.
[18] V. Vapnik, “The Nature of Statistical Learning Theory,” Springer, New York, NY, USA, 1995.