RESEARCH ARTICLE
A decision fusion method based on multiple support vector machine
system for fusion of hyperspectral and LIDAR data
Behnaz Bigdelia*, Farhad Samadzadeganaand Peter Reinartzb a
Department of Surveying & Geomatics Engineering, Faculty of Engineering, University of Tehran, Tehran, Islamic Republic of Iran;bDepartment of Photogrammetry and Image Analysis, Remote
Sensing Technology Institute, German Aerospace Centre (DLR), Berlin, Germany
(Received 4 February 2014; accepted 21 April 2014)
Fusion of remote sensing data from multiple sensors has been remarkably increased for classification. This is because, additional sources may provide more information, and fusion of different information can produce a better understanding of the observed site. In the field of data fusion, fusion of light detection and ranging (LIDAR) and optical remote sensing data for land cover classification has attracted more attention. This paper addressed the use of a decision fusion methodology for the combination of hyperspectral and LIDAR data in land cover classification. The proposed method applied a support vector machine (SVM)-based classifier fusion system for fusion of hyperspectral and LIDAR data in the decision level. First, feature spaces are extracted on LIDAR and hyperspectral data. Then, SVM classifiers are applied on each feature data. After producing multiple of classifiers, Naive Bayes as a classifier fusion method combines the results of SVM classifiers form two data sets. A co-registered hyper-spectral and LIDAR data set from Houston, USA, was available to examine the effect of the proposed decision fusion methodology. Experimental results show that the proposed data fusion method improved the classification accuracy and kappa coeffi-cient in comparison to the single data sets. The results revealed that the overall accuracies of SVM classification on hyperspectral and LIDAR data separately are 88% and 58% while our decision fusion methodology receive the accuracy up to 91%.
Keywords:LIDAR data; hyperspectral data; multi-sensor fusion; support vector machine
Introduction
Data and sensor fusion methods emerged as a powerful methodology for improving the classification performance. Based on the existing different airborne and spaceborne remote sensing sensors, a wide spectrum of data can be available for the same observed site. For many applications, the information provided by individual sensors are incom-plete, inconsistent or imprecise. Multiple sensors may provide complementary data, and fusion of information from different sensors can produce a better understanding of the observed site, which is not possible with single sensor (Pohl and Van genderen 1998, Simone et al.2002, Duet al.2013).
Fusion on remote sensing data can be performed at the signal, pixel, feature and decision levels. At signal level fusion, signals from different sensors are combined to create a new signal with a better signal-to-noise ratio. Pixel-level fusion fuses information from different images on a pixel-by-pixel basis to improve the performance of image processing tasks, such as segmentation. Feature-level fusion fuses features extracted from
*Corresponding author. Email:[email protected]
Vol. 5, No. 3, 196–209, http://dx.doi.org/10.1080/19479832.2014.919964
© 2014 Taylor & Francis
different images. At feature-level fusion, features are extracted from multiple images, then combined into a concatenated feature vector and classified using a standard classifier. Decision-level fusion fuses information at a higher level of abstraction. Based on the data from each sensor, a preliminary classification is performed. Fusion then fuses the outputs from the preliminary classifications. Ability to fuse different types of data from different sensors, independence to errors in data registration step and accurate fusion methods could be mentioned as the benefits of decision-level fusion methods rather than other level fusion (Yun2004, Donget al.2009, Duet al.2013).
During the last decade, the number of sensors and satellites has been growing steadily, and the coverage of the earth in space, time and the electromagnetic spectrum is increas-ing fast. Because of these advances, sensor fusion become a research hot spot in remote sensing and has been extensively applied to many areas.
Airborne light detection and ranging (LIDAR) provides accurate height information for the objects on the earth, which makes LIDAR become more and more popular in terrain and land survey. On the other hand, hyperspectral imaging is a relatively new technique in remote sensing that acquires hundreds of spectral channels. The rich spectral information of hyperspectral images increases the capability to distinguish different physical materials, leading to the potential of a more accurate image classification. A promising and challenging approach is to fuse these data in the information-extraction procedure (Dalponteet al.2008, Swatantranet al.2011). Hyperspectral images provide a detailed description of the spectral signatures of classes, whereas LIDAR data give detailed information about the height but no information on the spectral signatures. A sensor fusion approach can integrate characteristics from hyperspectral and LIDAR data to improve the classification accuracy.
This paper describes our approach for fusion of hyperspectral and LIDAR data based on a decision fusion system. Feature extraction strategies were applied on two data sets to generate more features. Then, support vector machine (SVM) was utilised as a supervised classification strategy on the feature spaces of each data set. Finally, a decision fusion strategy based on Bayesian theory fused all resulted classifiers from LIDAR and hyper-spectral data.
Literature review
Decision-level fusion consists of merging information at a higher level of abstraction, combines the results from multiple algorithms to yield a final fused decision. Input images are processed individually for information extraction. The obtained information is then combined using decision fusion methods. Decision-level fusion was chosen against pixel-level fusion and feature-pixel-level fusion in the three-pixel-level fusion hierarchy, because of its feasibility, lower computational complexity and robustness to the removal or addition of individual data sources.
An extensive literature is available on the decision fusion approaches. As one of the most important techniques in decision fusion, voting has been applied in different applications. In voting-based fusion, the class assigned by a classifier is considered as a vote for that class. Applications of majority voting techniques to combine classifiers can be found in Lam and Suen (1997), Rahman and Fairhurst (2000) and Lin et al.
(2003). A comprehensive review of majority voting and its variants for combining multiple classifiers in character recognition has been presented in Rahman et al.
(2002) and Kuncheva (2004).
In weighted version of voting method, usually a weight is assigned to each classifier. Detailed discussion of weighted voting can be found in Littlestone and Warmuth (1994). Benediktsson and Kanellopoulos (1999) used a weighting-based approach to combine the classification results from multiple neural networks and statistical models. The weights of the individual classifier reflected the reliability of the sources and were optimised in order to improve the combined classification accuracy during training. Tsoumakaset al.(2005) combined weighted voting with the classifier selection step so that only the results from a subset of the classifiers were used for fusion. Such selective fusion was shown to be a generalisation of weighted voting.
In addition, Bayesian decision fusion strategy has been successfully applied in diverse fields ranging from pattern recognition (handwritten digit/character recognition and image recognition), to medical diagnosis and machine fault diagnosis (fault diagnosis in trans-former and induction motor). Zhenget al.(2005) used Bayesian-based fusion to integrate results from different image processing approaches for diagnosing diseases. McArthur
et al. (2004) combined k-means clustering, back-propagation neural network and user-written rules based on Bayesian approach to diagnose faults in a power transformer. Dempster–Shafer-based fusion has also been widely used in various fields. Parikh et al.
(2001, 2003) used the Dempster–Shafer evidence theory to combine the outputs of multiple primary classifiers to improve overall classification performance. The effective-ness of this approach was demonstrated for detecting failures in a diesel engine cooling system. There are several other decision fusion strategies including behaviour knowledge space (Huang and Suen1993,1995) which uses a lookup table that lists the most common correct classes for every possible class combinations given by the classifiers, decision templates (Kunchevaet al.2001) which compute a similarity measure between the current decision profile of the unknown instance and the average decision profiles of instances from each class. A detailed overview of various decision fusion strategies is available in Kuncheva (2004).
With the development of the remote sensing imaging technology, application of decision fusion approaches for fusion of images from different sensors is becoming more and more widespread in remote sensing.
Recently, new researches focus on decision fusion strategies to overcome the weak-nesses of single remote sensing sensors (Simone et al.2002, Hsu and Burke 2003). As hyperspectral images provide a detailed description of the spectral signatures of classes without any height information, fusion of this data with LIDAR data may improve classification results. Dalponteet al. (2008) investigate the potentialities of the joint use of hyperspectral and LIDAR data, combined with advanced classification techniques based on SVM, for forest classification. Two recent researches related to the decision fusion of hyperspectral and LIDAR data are published by Zhaoet al.(2013) and Uhlmann
et al. (2013). First, Zhao et al. (2013) applied four features: minimum noise fraction, principal component analysis, normalised difference vegetation index (NDVI) and grey-level co-occurrence matrix (GLCM) on hyperspectral data. Then three classifiers: max-imum likelihood classifier, SVM and multinomial log regression were applied on features of hyperspectral data. On LIDAR data, they separated ground points and non-ground points by Axelsson filter and applied three mentioned classifiers on LIDAR data. Finally, they fused all classifiers with majority voting. Second, Uhlmann et al. (2013) extracted some features from hyperspectral data. Then they combined each of the single features with the original hyperspectral bands and LIDAR data into five additional feature sets. In classification step, they used SVM with polynomial kernel to classify each feature sets. Finally, they applied majority voting to fuse classification maps of classifiers. In
comparison to these two last researches, the proposed method of this paper tries to use SVM with radial basis function (RBF) rather than polynomial kernel, Bayesian fusion rather than simple voting strategy and more spectral feature on hyperspectral data to improve the classification accuracy.
This paper presents a decision fusion method for fusion of hyperspectral and LIDAR data based on a multiple SVM system. The proposed method tries to establish a classifier fusion system to fuse hyperspectral and LIDAR data. In this way, classification results benefit from spectral information of hyperspectral data and height information of LIDAR data.
Proposed fusion method on hyperspectral and LIDAR data
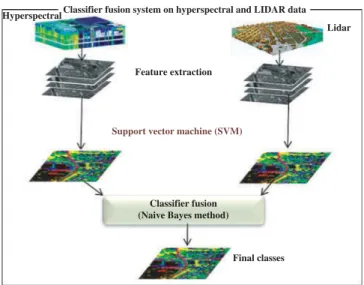
A SVM-based classifier fusion system for fusion of hyperspectral and LIDAR data is presented inFigure 1. First, feature extraction phase is applied on two data sets to generate feature spaces. Second, the proposed methodology applies a SVM classifier for classifica-tion of each feature space which is produced in the previous step. Finally, a classifier fusion method is used to fuse the SVM classification results which are applied in previous steps on hyperspectral and LIDAR data. The resulting classifier is generally more accurate than any of the individual classifiers that make up the ensemble of classifiers (Ruta and Gabrys2000, Kuncheva2004).
Phase 1: feature extraction on LIDAR and hyperspectral data
The main step of classification process on LIDAR and hyperspectral data is extraction of features from data sets. These features must contain useful information to discriminate between different objects. The features on LIDAR data are listed inTable 1.
Texture descriptors can be measured based on the grey value relationships between each pixel and its neighbouring pixels in a local window or in the global image. GLCMs are one of the earliest techniques used for image texture analysis defined by Haralicket al.
(1973). Furthermore, variance operators are one of the useful statistical methods for
Classifier fusion system on hyperspectral and LIDAR data Hyperspectral
Feature extraction
Lidar
Classifier fusion (Naive Bayes method)
Final classes Support vector machine (SVM)
Figure 1. Flowchart of the proposed fusion method on hyperspectral and LIDAR data.
texture analysis based on the differences between the pixels in a local neighbouring window. Semi-variogram as a geo-statistical operator is also in the family of variance operators. The operation of semi-variogram is based on the directional distances between each pixel and its neighbouring pixels in a local window (Chica-Olmo and Abarca-Hernández 2004).
Also, inTable 1roughness, relief, slope and aspect are measures of the topography of a surface. Furthermore, some of the spectral features on hyperspectral data are presented
inTable 2.
Phase 2: support vector machine as classification method
One of the most popular classification methods are SVMs defined by Vapnik (1998), a large margin-based classifier with a good generalisation capacity in the small-size training set problem with high-dimensional input space. SVMs discriminate two classes by fitting an optimal linear separating hyperplane to the training samples of two classes in a
Table 1. Different features on LIDAR data.
Name Formulation
Texture features Entropy
Ent¼ P N1 i;j¼0 Pi;j ðlnPi;jÞ Correlation corr¼NP 1 i;j¼0 ½ðiμiÞðjμjÞ= ffiffiffiffiffiffiffiffiffiffiffiffiffiffiffi ðσ2 iÞðσ2j q Þ Contrast Cont¼ P N i;j¼0 PijðijÞ2 GLCM Mean Mean i¼ P N1 i;j¼0 iPði;jÞ Standard deviation variance i¼ P N1 i;j¼0 Pði;jÞ ðiMean iÞ2 Homogeneity H¼ P N1 i;j¼0 Pi;j 1þðijÞ2 Dissimilarity Diss¼ P N1 ij¼0 Pijjijj Second moment M¼ P N1 ij P2 ij Variogram Semi-variogram γkðhÞ ¼2n1ðhÞP nðhÞ i¼1 fDNkðxiÞ DNkðxiþhÞg2Þ Radogram γkðhÞ ¼ 1 2nðhÞ P nðkÞ i¼1 ffiffiffiffiffiffiffiffiffiffiffiffiffiffiffiffiffiffiffiffiffiffiffiffiffiffiffiffiffiffiffiffiffiffiffiffiffiffiffiffiffiffiffiffiffiffiffiffi DNkðxiÞ DNkðxiþhÞ j j p Madogram γkðhÞ ¼ 1 2nðhÞ P nðkÞ i¼1 DNkðxiÞ DNkðxiþhÞ j j Topography features Slope Aspect Relief Roughness Ra¼1=N:P N n¼1 hn j j
multidimensional feature space. The optimisation problem being solved is based on structural risk minimisation and aims to maximise the margins between the optimal separating hyperplane and the closest training samples –the so-called‘support vectors’. A detailed description on the general concept of SVM is given by Burges (1998) and Schölkopf and Smola (2002). It is worth underlining that the kernel-based implementation of SVMs involves the problem of the selection of multiple parameters, including the kernel parameters (e.g., parameters for the Gaussian and polynomial kernels) and the regularisation parameterC.
In our proposed method, the kernel of each individual classifier is adjusted according to the corresponding feature space properties. This paper utilised one-against-one multi-class SVM with RBF kernel (RBF is one of the most popular kernel function for SVM classifier) as base classifier.
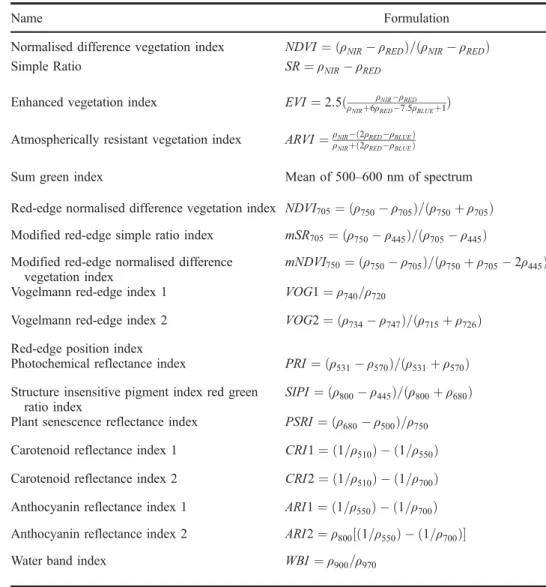
Table 2. Different spectral features on hyperspectral data.
Name Formulation
Normalised difference vegetation index NDVI¼ ðρNIRρREDÞ=ðρNIRρREDÞ
Simple Ratio SR¼ρNIRρRED
Enhanced vegetation index EVI¼2:5ð ρNIRρRED
ρNIRþ6ρRED7:5ρBLUEþ1Þ
Atmospherically resistant vegetation index ARVI¼ρNIRð2ρREDρBLUEÞ
ρNIRþð2ρREDρBLUEÞ
Sum green index Mean of 500–600 nm of spectrum
Red-edge normalised difference vegetation index NDVI705¼ ðρ750ρ705Þ=ðρ750þρ705Þ Modified red-edge simple ratio index mSR705¼ ðρ750ρ445Þ=ðρ705ρ445Þ Modified red-edge normalised difference
vegetation index
mNDVI750¼ ðρ750ρ705Þ=ðρ750þρ7052ρ445Þ
Vogelmann red-edge index 1 VOG1¼ρ740=ρ720
Vogelmann red-edge index 2 VOG2¼ ðρ734ρ747Þ=ðρ715þρ726Þ Red-edge position index
Photochemical reflectance index PRI¼ ðρ531ρ570Þ=ðρ531þρ570Þ
Structure insensitive pigment index red green ratio index
SIPI¼ ðρ800ρ445Þ=ðρ800þρ680Þ
Plant senescence reflectance index PSRI¼ ðρ680ρ500Þ=ρ750
Carotenoid reflectance index 1 CRI1¼ ð1=ρ510Þ ð1=ρ550Þ Carotenoid reflectance index 2 CRI2¼ ð1=ρ510Þ ð1=ρ700Þ Anthocyanin reflectance index 1 ARI1¼ ð1=ρ550Þ ð1=ρ700Þ Anthocyanin reflectance index 2 ARI2¼ρ800½ð1=ρ550Þ ð1=ρ700Þ
Water band index WBI¼ρ900=ρ970
Kðx;x0Þ ¼expðλxx02Þ (1) Grid search is a well-known technique for model selection which performs exhaustive search and selects a set of parameters values with the best fitness (Hsu et al.2010).
Phase 3: classifier fusion
After feature extraction on hyperspectral and LIDAR data, SVM classifiers are separately applied on each feature space. Then results of single classifiers are fused through a multiple classifier system (MCS). MCS or classifier fusion is successfully applied on various types of data to improve single classifiers results. Classifier fusion can improve classification accuracy in comparison to a single classifier by combining results of classification algorithms on different data sets. The possible ways of combining the outputs of classifiers in a MCS depend on what information can be obtained from the individual members. Two types of classifier outputs (crisp/fuzzy) produced two types of classifier fusion methods. Our proposed method applied SVM as crisp classifier consequently we applied one of the crisp classifier fusion methods (Naïve Bayes (NB)) (Kuncheva2004).
NB is a statistical classifier fusion method that can be used for fusing the outputs of individual classifiers. The essence of NB is based on the Bayesian theory (Ruta and Gabrys2000, Kuncheva2004) as follows:
pðS=wkÞ ¼pðs1;s2;. . .;sL=wkÞ ¼ YL i¼1
pðsi=wkÞ (2)
Denoted by pðsjÞ the probability that jth classifier labels x in class sj2Ω. (L is the number of classifier and cis the number of classes, where s¼ ½s1;. . .;sL denotes the vector with the label output of the ensemble). Then the posterior probability needed to labelxis as follows: pðwk=SÞ ¼ pðwkÞpðS=wkÞ pðSÞ ¼ pðwkÞ QL i¼1 pðSi=wkÞ pðSÞ ;k¼1;. . .;c (3)
The denominator does not depend onwkand can be ignored, so the final support for class
wk is as follows:
μkðxÞ /pðwkÞ
YL i¼1
pðsi=wkÞ (4)
whereμkis the final support forkth class. Maximum value ofμappoints winner class for
xsample.
The practical implementation of the NB method on a data set with cardinality Nis explained below. For each classifier, accconfusion matrixCMiis calculated by testing the data set (Kuncheva 2004). The (k, s)th entry of this matrix,cmik;s is the number of elements of the data set whose true class label iswk and is assigned by the classifier to classws. ByNs we denote the total number of elements of data set from classws. Taking
cmik;si=Nkas an estimate of the posterior probability, andNk=N as an estimate of the prior
probability, the final support for classwkisEquation (5). The maximum membership rule
ðμÞwill label xinwkclass.
μkðxÞ / 1 NL1 k YL i¼1 cmik;si (5)
The Bayes classifier has been found to be surprisingly accurate and efficient in many experimental studies (Xu et al.1992, Kuncheva2004).
Experimental settings
Data sets
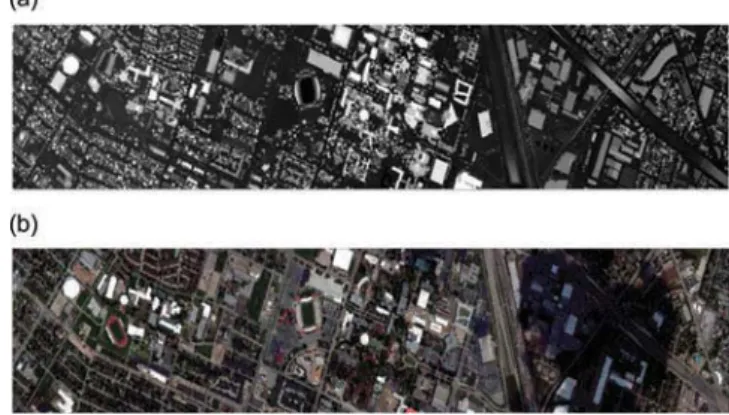
In this section, we present the application of the proposed general fusion scheme to the improvement of classification results on urban areas. The proposed approach was applied on two data sets. A hyperspectral image and a LIDAR-derived digital surface model (DSM); both with spatial resolution of 2.5 m have been utilised to evaluate the proposed method (Figure 2). The hyperspectral image has 144 spectral bands. The data sets have captured over the University of Houston campus and the neighbouring urban area and have been acquired by the National Science Foundation (NSF)-funded Centre for Airborne Laser Mapping (NCALM). Ground truth of this data set also was provided by NCALM:
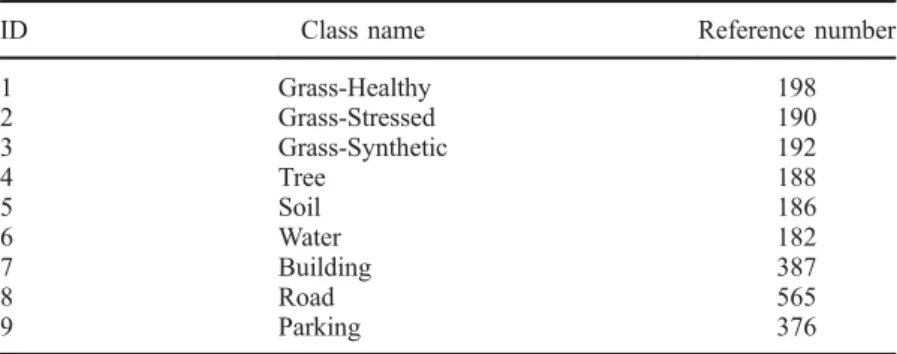
From the 15 different land cover classes available in the original ground truth; some of these classes have been merged (residential and commercial classes were merged to produce Building class as 3D objects. Also road, highway and railroad were merged to produce road class; similarly Parking lot 1 and 2 were merged to produce Parking class). Available nine land cover classes were used to generate training and test data sets (Table 3).
Results
The first step of the presented methodology was designed to produce feature spaces on hyperspectral and LIDAR data independently. In case of LIDAR data, all of the textural and topographical features in Table 1 were applied on data to generate feature space.
Figure 3illustrates some of these features on LIDAR data.
Figure 2. Data sets, (a) LIDAR-derived DSM and (b) hyperspectral data over Houston campus.
The feature space on hyperspectral data, which is listed in Table 2, produced more spectral information on this data. Some of these features are presented inFigure 4.
After feature extraction, for the task of data classification, one-against-one SVM is applied on hyperspectral and LIDAR data. Proposed strategy applies grid search as the model selection of SVM classifier. The search range for C is [2–2, 210], and [2–10, 22] forγ.
Table 3. Houston University lands cover classes and available reference samples.
ID Class name Reference number
1 Grass-Healthy 198 2 Grass-Stressed 190 3 Grass-Synthetic 192 4 Tree 188 5 Soil 186 6 Water 182 7 Building 387 8 Road 565 9 Parking 376
Figure 3. Some features on LIDAR data: (a) roughness, (b) aspect, (c) GLCM (std) and (d) variogram.
After classification of LIDAR and hyperspectral data, NB is applied as classifier fusion approaches on the outputs of classifiers.
In order to show the merits of the proposed methodology, this paper implements a SVM on integration of hyperspectral and LIDAR data. In simple integration method, LIDAR data and features on it are applied as additional bands of hyperspectral data. In this way, we try to compare the results of classifier fusion method to simple integration of these two data sets.
Table 4 and Figure 5 represent the overall accuracy (OA) and kappa coefficient of
different classification strategies on hyperspectral and LIDAR data. Based on these results, proposed classifier fusion on hyperspectral and LIDAR data improves the results of independent classifiers on each data set independently. It can be observed that fusion strategy exhibited the best accuracy, with an OA of 91.2%, which improved the accuracy of SVM on LIDAR and hyperspectral data up to 32.6% and 2.5%, respectively. Furthermore, classifier fusion based on NB outperforms simple integration of hyperspec-tral and LIDAR data in terms of classification accuracy. The reasonable cause of these results is that height information of LIDAR data and spectral information of hyperspectral data together could improve classification accuracy.
Figure 4. Some features on hyperspectral data: (a) NDVI, (b) red-edge normalised difference vegetation index and (c) water band index.
Table 4. Results of different classification strategies.
Measure LIDAR Hyperspectral Integration Classifier fusion
OA 58.554 88.69 89.4 91.2
Kappa 51.86 86.83 87.2 89.8
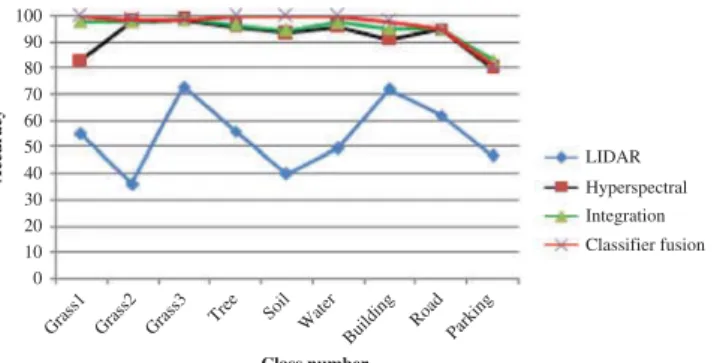
Figure 6demonstrates the accuracies of different classification strategies for all nine classes of data sets. The analysis of Figure 6 shows that for most of classes, fusion strategy performs better than single classifiers and integration method. Finally, Figure 7 demonstrates the classification map of classifier fusion strategy on hyperspectral and LIDAR data.
Conclusion
In this paper, the performance of a decision fusion system for fusion of hyperspectral and LIDAR imageries is assessed. After definition of feature spaces on LIDAR and
Figure 5. Comparison of classification results.
100 90 80 70 60 50 40 30 20 LIDAR Hyperspectral Integration Classifier fusion Class number Accuracy 10 0
Grass1 Grass2 Grass3 Tree Soil Water Building
Road Parking
Figure 6. Comparison of class accuracies between different classification strategies.
Green-healthy Soil Water Stressed-grass Synthetic-grass Residential Tree Commercial Road
Figure 7. Classification map of proposed SVM based classifier fusion on hyperspectral and LIDAR data.
hyperspectral data, SVM classifiers were applied independently on hyperspectral and LIDAR data. Finally, a decision fusion method based on Bayesian theory was applied to fuse classifiers of hyperspectral and LIDAR data.
The main important aim of the proposed method is related to the effectiveness of fusion of hyperspectral and LIDAR data in decision level. Because of the complexities of hyperspectral and LIDAR data, previous researches on pixel-level fusion or simple integration of these two data sets could not overcome classification of these data sets’ drawbacks. Rather than previous researches, our proposed method applied a classifier fusion to fuse decisions of hyperspectral and LIDAR data. Also, the proposed method utilised a powerful classifier fusion method based on Bayesian theory that shows more improvement in terms of classification accuracy. Hyperspectral images provide a detailed description of the spectral signatures of classes but no information on the height of ground covers, whereas LIDAR data give detailed information about the height but no informa-tion on the spectral signatures. Consequently, the elevainforma-tion informainforma-tion of LIDAR was very effective for the separation of species with similar spectral signatures but different mean heights. Also the spectral information of hyperspectral data was very effective for discrimination of similar elevation classes but different spectral information. The usability of the measurement set-up was assessed by a co-registered hyperspectral and LIDAR data. Based on the results, we conclude that fusion of classifiers on these two data could improve classification accuracy.
This paper applied decision fusion strategy based on SVM as crisp classification method while in remote sensing, each pixel form different satellites might represent several kilometres of land. Consequently, fuzzy classification systems might be more efficient than traditional crisp classifiers. Further studies could focus on the fuzzy classification of hyperspectral and LIDAR data and decision fusion methods on fuzzy classifiers, such as fuzzy integral and decision template.
Acknowledgements
The authors would like to thank the Hyperspectral Image Analysis group and the NSF-funded Center for Airborne Laser Mapping (NCALM) at the University of Houston for providing the data sets used in this study and the IEEE GRSS Data Fusion Technical Committee for organising the 2013 Data Fusion Contest.
References
Benediktsson, J.A. and Kanellopoulos, I., 1999. Classification of multisource and hyperspectral data based on decision fusion.IEEE Transactions on Geoscience and Remote Sensing, 37 (3), 1367– 1377. doi:10.1109/36.763301.
Burges, C.J.C., 1998. A tutorial on support vector machines for pattern recognition.Data Mining and Knowledge Discovery, 2 (2), 121–167. doi:10.1023/A:1009715923555.
Chica-Olmo, M. and Abarca-Hernández, F., 2004. Variogram derived image texture for classifying remotely sensed images.In: S.M. de jong and F.D. van der Meer, eds. Remote sensing image analysis: including the spatial domain. 93–111.
Dalponte, M., Bruzzone, L., and Gianelle, D., 2008. Fusion of hyperspectral and LIDAR remote sensing data for classification of complex forest areas.IEEE Transactions on Geoscience and Remote Sensing, 46 (5), 1416–1427. doi:10.1109/TGRS.2008.916480.
Dong, J.,et al., 2009. Advances in multi-sensor data fusion: algorithms and applications.Journal of Sensors, 9 (10), 7771–7784. doi:10.3390/s91007771.
Du, P.,et al., 2013. Information fusion techniques for change detection from multi-temporal remote sensing images.Information Fusion, 14 (1), 19–27. doi:10.1016/j.inffus.2012.05.003.
Haralick, R., Shanmugam, K., and Dinstein, I., 1973. Textural features for image classification.
IEEE Transactions on Systems, Man, and Cybernetics, 3 (6), 610–621. doi:10.1109/ TSMC.1973.4309314.
Hsu, C.-W., Chung, C.-C., and Lin, C.-J., 2010.A practical guide to support vector classification
[online]. Taipei, National Taiwan University. Available from:http://www.csie.ntu.edu.tw/_cjlin
[Accessed 13 March 2010].
Hsu, S. and Burke, H., 2003. Multisensor fusion with hyperspectral imaging data detection and classification.Lincoln Laboratory Journal, 14 (1), 145–159.
Huang, Y.S. and Suen, C.Y., 1993. Behavior-knowledge space method for combination of multiple classifiers.In:Proceedings of IEEE computer vision and pattern recognition. New York, NY: IEEE, 347–352.
Huang, Y.S. and Suen, C.Y., 1995. A method of combining multiple experts for the recognition of unconstrained handwritten numerals. IEEE Transactions on Pattern Analysis and Machine Intelligence, 17 (1), 90–94. doi:10.1109/34.368145.
Kuncheva, L., 2004. Combining pattern classifiers methods and algorithms. Hoboken, NJ: John Wiley & Sons.
Kuncheva, L.I., Bezdek, J.C., and Duin, R., 2001. Decision templates for multiple classifier fusion: an experimental comparison. Pattern Recognition, 34 (2), 299–314. doi:10.1016/S0031-3203 (99)00223-X.
Lam, L. and Suen, S.Y., 1997. Application of majority voting to pattern recognition: an analysis of its behavior and performance.IEEE Transactions on Systems, Man, and Cybernetics–Part A: Systems and Humans, 27 (5), 553–568. doi:10.1109/3468.618255.
Lin, X., et al., 2003. Performance analysis of pattern classifier combination by plurality voting.
Pattern Recognition Letters, 24, 1959–1969. doi:10.1016/S0167-8655(03)00035-7.
Littlestone, N. and Warmuth, M., 1994. The weighted majority algorithm. Information and Computation, 108, 212–261. doi:10.1006/inco.1994.1009.
McArthur, S.D.J., Strachan, S.M., and Jahn, G., 2004. The design of a multi-agent transformer condition monitoring system. IEEE Transactions on Power Systems, 19 (4), 1845–1852. doi:10.1109/TPWRS.2004.835667.
Parikh, C.R., Pont, M.J., and Jones, N.B., 2001. Application of Dempster–Shafer theory in condition monitoring applications: a case study.Pattern Recognition Letters, 22, 777–785. doi:10.1016/ S0167-8655(01)00014-9.
Parikh, C.R., et al., 2003. Improving the performance of CMFD applications using multiple classifiers and a fusion framework.Transactions of the Institute of Measurement and Control, 25 (2), 123–144. doi:10.1191/0142331203tm080oa.
Pohl, C. and Van Genderen, J., 1998. Review article multisensor image fusion in remote sensing: concepts, methods and applications.International Journal of Remote Sensing, 19 (5), 823–854. doi:10.1080/014311698215748.
Rahman, A.F.R., Alam, H., and Fairhurst, M.C., 2002. Multiple classifier combination for character recognition: revisiting the majority voting system and its variations. In: IAPR workshop on document analysis systems, Vol. 2423, August 2002 Princeton, NJ. Berlin: Springer, 167–178. Rahman, A.F.R. and Fairhurst, M. 2000. Decision combination of multiple classifiers for pattern classification: hybridisation of majority voting and divide and conquer techniques.In:5th IEEE workshop on applications of computer vision, WACV 2000, 4–6 December 2000. Palm Springs, CA, 58–63.
Ruta, D. and Gabrys, B., 2000. An overview of classifier fusion methods.Computation Information. System, 7 (1), 1–10.
Schölkopf, B. and Smola, A., 2002.Learning with kernels. Cambridge, MA: MIT Press.
Simone, G., et al., 2002. Image fusion techniques for remote sensing applications. Information Fusion, 3 (1), 3–15. doi:10.1016/S1566-2535(01)00056-2.
Swatantran, A., et al., 2011. Mapping biomass and stress in the Sierra Nevada using LIDAR and hyperspectral data fusion.Remote Sensing of Environment, 115 (11), 2917–2930. doi:10.1016/j. rse.2010.08.027.
Tsoumakas, G., Angelis, L., and Vlahavas, I., 2005. Selective fusion of heterogeneous classifiers.
Intelligent Data Analysis, 9 (6), 511–525.
Uhlmann, S., Kiranyaz, S., and Yildirm, A., 2013. Evaluation of classifiers for polarimetric SAR classification.In:IEEE international geosciences and remote sensing symposium, 21–26 July 2013 Melbourne, Australia.
Vapnik, V.N., 1998.Statistical learning theory. New York, NY: Wiley.
Xu, L., Krzyzak, A., and Suen, C.Y., 1992. Methods of combining multiple classifiers and their applications to handwriting recognition.IEEE Transactions on Systems, Man, and Cybernetics, 22 (3), 418–435. doi:10.1109/21.155943.
Yun, Z., 2004. Understanding image fusion.Photogrammetry Engineering and Remote Sensing, 6 (1), 657–661.
Zhao, B.,et al., 2013. Hybrid generative/discriminative scene classification strategy based on latent Dirichlet allocation for high spatial resolution remote sensing imagery.In:IEEE international geosciences and remote sensing symposium, 21–26 July 2013 Melbourne, Australia.
Zheng, M.M., Krishnan, S.M., and Tjoa, M.P., 2005. A fusion-based clinical decision support for disease diagnosis from endoscopic images.Computers in Biology and Medicine, 35, 259–274. doi:10.1016/j.compbiomed.2004.01.002.