Estimating Movement from Mobile
Telephony Data
John Doyle
A thesis submitted in partial fulfilment
of the requirements for
Doctor of Philosophy
Department of Electronic Engineering
National University of Ireland Maynooth
Ireland
Head of the Department: Dr. Ronan Farrell
Your past is your future.”
I hereby certify that this thesis, which I now submit for assessment on the programme of study leading to the award of PhD has not been submitted, in whole or part, to this or any other University for any degree and is, except where otherwise stated the original work of the author.
Signed: . . . .
Mobile enabled devices are ubiquitous in modern society. The information gathered by their normal service operations has become one of the primary data sources used in the understanding of human mobility, social connection and information transfer. This thesis investigates techniques that can extract useful information from anonymised call detail records (CDR). CDR consist of mobile subscriber data related to people in connection with the network operators, the nature of their communication activity (voice, SMS, data, etc.), duration of the activity and starting time of the activity and servicing cell identification numbers of both the sender and the receiver when available.
The main contributions of the research are a methodology for distance measurements which enables the identification of mobile subscriber travel paths and a methodology for population density estimation based on significant mobile subscriber regions of interest. In addition, insights are given into how a mobile network operator may use geographically located subscriber data to create new revenue streams and improved network performance. A range of novel algorithms and techniques underpin the development of these methodologies. These include, among others, techniques for CDR feature extraction, data visualisation and CDR data cleansing.
The primary data source used in this body of work was the CDR of Meteor, a mobile network operator in the Republic of Ireland. The Meteor network under investigation has just over 1 million customers, which represents approximately a quarter of the country’s 4.6 million inhabitants, and operates using both 2G and 3G cellular telephony technologies.
Results show that the steady state vector analysis of modified Markov chain mobility models can return population density estimates comparable to population estimates obtained through a census. Evaluated using a test dataset, results of travel path identification showed that developed distance measurements achieved greater accuracy when classifying the routes CDR journey trajectories took compared to traditional trajectory distance measurements. Results from subscriber segmentation indicate that subscribers who have perceived similar relationships to geographical features can be grouped based on weighted steady state mobility vectors. Overall, this thesis proposes novel algorithms and techniques for the estimation of movement from mobile telephony data addressing practical issues related to sampling, privacy and spatial uncertainty.
First and foremost, I would like to extend my sincere gratitude and thanks to my research supervisors Dr. Ronan Farrell and Prof. Se´an Mcloone for their continuous support throughout my PhD. Each in their own unique way, acted as both a mentor and a friend. Their encouragement, guidance and ability to impart knowledge of mathematical and engineering principles where vital in the completion of this body of work. Particular thanks are also due to Dr. Peter Hung whose mentoring ability was only out done by his editorial masterclasses, friendship and domain expertise. I thank all of you for your help, I could not have finished my thesis without you.
I would also like to extend my gratitude to Dr. Damian Kelly, Dr. Muhammad Tahir and Dr. Tim McCarthy for their contributions and involvement in this body of work.
The Research presented in this thesis was funded by a Strategic Research Cluster grant (07/SRC/I1168) by Science Foundation Ireland under the National Development Plan and by the Irish Research Council for Science, Engineering and Technology through an IRCSET postgraduate scholarship in partnership with ESRI Ireland. I would like to gratefully acknowledge this support, in particular Michael Byrne of ESRI Ireland.
I would also like to gratefully acknowledge the support of Meteor for providing the data used in this thesis, in particular John Bathe and Adrian Whitwham.
Ordinance Survey Ireland are also gratefully acknowledged for the provision of geographical region polygons and transportation network vectors.
A significant contributor to my continued enjoyment of the past few years has been the great community spirit that exists within the Electronic Engineering Department at the National University of Ireland Maynooth. Thank you to all of the staff, especially Joanne Bredin and Ann Dempsey. For their priceless IT and hardware support, I would also like to thank John Maloco, Denis Buckley and James Kinsella.
Thanks to the NUIM postgrads and espically my colleagues and friends in the Callan Institute for the banter, support and guidance, espically Dr. John Dooley, Dr. Grzegorz Szczepkowski, Dr. Alvaro Palomo Navarro, Dr. Tomasz Podsiadlik, Han Su, Emmett Carolan, Tony Keenan (extra thanks for the lifts to work, priceless), Keith Finnerty, Mary Larkin, Aidan McDermott, Diarmuid Collins, Prakash Srinivasan, Felix Wu and Sarah Adel. Also, a special thanks to Joanna O’Grady for all the help throughout my time within the Institute. I would also like to extend my gratitude to my colleagues in StratAG, in particular Dr. Jan Rigby and Melina Lawless for their support in completing this research.
To my friends outside college, thank you for the understanding, advice and sanity checks. In particular, a special thanks to Darren, Brendan, Gabhan, Seamus, Paul, Ciara, the Rage and Luo.
To Ursula, you are my best friend and my rock. Your love, encouragement and support are the main reasons I was able to finish this thesis. No matter how tough things got, you were always there. Thank you for being you, for your hugs, kisses, motivation, your understanding and for your constant loving support. I will never forget everything that you have done. You were always there when I needed someone to talk to or when I was having a bad day or week. Even though you were busy with your own PhD you would not hesitate in being there for me and for us. You mean everything to me, and I am forever yours. I would also like to extend a special thanks to Ursula’s family for their support, encouragement and help over the last few years.
Finally, I would like to thank my own family for all their support over the last few years in particular. My parents Eddie and Kathleen for your unconditional love, your understanding and the constant words of encouragement. To my sisters Emma and Catherine, my extended family Brendan and James and my nieces and nephew Kathlyn, Jasmine, Amber Rachel and Seamus, thank you for the constant laughs and much needed distractions. For all the support you have given and for being there when needed, even if it meant moving tonnes of equipment half way around the country, driving hours to fix car related issues or the time spent sorting out issues, thank you all.
Publications Arising From This Thesis x
List of Abbreviations xii
List of Symbols xvi
List of Figures xviii
List of Tables xxvi
1 Introduction 1
1.1 Motivation . . . 3
1.2 Privacy . . . 4
1.3 Thesis Contributions . . . 5
1.4 Thesis Organisation . . . 6
2 A Human Sensing Platform: Mobile Cellular Networks 9 2.1 Mobile Telephony Networks . . . 10
2.1.1 Multiple Access Techniques . . . 12
2.1.2 Spatial Coverage . . . 13
2.1.3 Mobility Management . . . 16
2.2 Mobile Operator Acquired Data . . . 19
2.4 Discussion . . . 26
3 CDR Feature Extraction 27 3.1 Cell Coverage Regions . . . 33
3.2 Data Cleansing . . . 38
3.3 Spatio-temporal Cell Activity Maps . . . 42
3.4 Mobile Device Trajectories . . . 48
3.5 Spatial Clustering of Cell Towers . . . 54
3.6 Movement Transition Flows . . . 56
3.7 Communication Flow . . . 59
3.8 Subscriber Social Graph . . . 61
3.9 Discussion . . . 62
4 Travel Path Discovery 64 4.1 CDR Journey Trajectories . . . 66
4.2 Kernel Density Estimate (KDE) . . . 67
4.3 Simulating CDR Journey Trajectories . . . 69
4.3.1 Allocating Activity Locations . . . 69
4.3.2 Cell Tower Selection . . . 72
4.4 Path Similarity Measurements . . . 78
4.4.1 Virtual Cell Path . . . 78
4.4.2 Probabilistic Cell Connectivity . . . 80
4.4.3 Hausdorffand Modified HausdorffDistances . . . 81
4.4.4 Dynamic Time Wrapping . . . 81
4.4.5 Longest Common Subsequence . . . 82
4.4.6 Modified LCSS . . . 83
4.5 Comparative Study . . . 83
4.6 Estimating Travel Paths . . . 87
4.6.1 Travel Path Identification . . . 96
4.7 Travel Path Generation . . . 99
5 Population Mobility 104
5.1 Subscriber Transition Intensity . . . 106
5.1.1 Flow Directionality . . . 109
5.2 Markov Chain Mobility Model . . . 111
5.3 Population Density Estimation . . . 117
5.3.1 District Scaling . . . 119
5.3.2 Census Validation . . . 122
5.4 Community Structures . . . 129
5.5 Discussion . . . 132
6 Geographically Located Subscriber Intelligence 133 6.1 High Traffic Regions Of Interest . . . 134
6.2 Event Mobility . . . 135
6.3 Targeted Geographical Marketing . . . 140
6.4 Discussion . . . 143
7 Concluding Summary & Future Work 144 7.1 Concluding Summary . . . 144
7.2 Future Work . . . 147
The following papers have been published based on the work presented in the thesis.
• Doyle, J., Hung, P., Farrell, R. and McLoone, S. (2013). Population Mobility Dynamics Estimated From Mobile Telephony Data, under review, Journal of Urban Technology (JUT).
• Doyle, J., McLoone, S., Hung, P. and R. Farrell (2012). Estimating Movement From
Mobile Telephony Data, Mobile Tartu, 2012.
• Doyle, J., Hung, P., Kelly, D., McLoone, S. and Farrell R. (2011). ”Utilising Mobile Phone Billing Records for Travel Mode Discovery”, Proc. 22th IET Irish Signals and Systems Conference, 2011.
• Kelly, D.,Doyle, J., and Farrell, R. (2011). ”Analysing Ireland’s Social and Transport Networks using Sparse Cellular Network Data”, Proc. 22th IET Irish Signals and Systems Conference, 2011.
• Doyle J., McLoone S., McCarthy T. and Farrell R. (2010). ”Topography of Irish Mobile Telephony Activities: Visualising Human Dynamics on a Macro Scale”, GeoVA(t) -Geospatial Visual Analytics: Focus on Time Workshop, AGILE, 2010.
• Doyle, J., Farrell R., McLoone, S., McCarthy T., Tahir M. and P. Hung (2009). ”Utilising Mobile Phone RSSI Metric for Human Activity Detection”, Proc. 20th IET Irish Signals and Systems Conference, 2009.
• Doyle, J., Farrell R., McLoone, S., McCarthy T. and P. Hung (2009). ”Extracting Localised Mobile Activity Patterns from Cumulative Mobile Spectrum RSSI”, China-Ireland International Conference on Information and Communications Technologies, 2009, pp. 75-82.
2G Second-Generation Wireless Telephone Technology.
3G Third-Generation Wireless Telephone Technology.
4G Forth-Generation Wireless Telephone Technology.
A-GPS Assisted Global Positioning System.
AOA Angle of Arrival.
APN Access Point Name.
BSC Base Station Controllers.
BTS Base Transceiver Station.
CDMA Code Division Multiple Access.
CDR Call detail Record.
CSO Central Statistics Office Ireland.
CSV Comma-separated values.
DTW Dynamic Time Wrapping.
EDGE Enhanced Data rates for GSM Evolution.
eUTRAN Evolved UMTS Terrestrial Radio Access Network.
eNode B Evolved Node B is the eUTRAN equivalent of the UTRAN Node B.
E-OTD Enhanced Observed Time Difference.
ETP Estimating Travel Paths.
FDM Frequency Division Multiplexed.
FDMA Frequency Division Multiple Access.
GERAN GRAN with the addition of EDGE packet radio services.
GPRS General Packet Radio Service.
GPS Global Positioning System.
GRAN GSM Radio Access Network.
GSM Global System for Mobile Communications.
GTP Generated Travel Path.
HLR Home Location Register.
IMSI International Mobile Subscriber Identity.
KDE Kernel Density Estimate.
LAI Location Area Identity.
LBS Location Based Services.
LCSS Longest Common Subsequence.
LOS Line of Sight.
LPCC Longest Common Subsequence modified using PCC.
LVCP Longest Common Subsequence modified using VCP.
MD Mobile Telephony Enabled Devices.
MME Mobility Management Entity.
MPCC Modified Probabilistic Cell Connectivity.
MSC Mobile Switching Centre.
MS Mobile Station.
MVCP Modified Virtual cell Path.
NLOS Non Line of Sight.
Node B UMTS equivalent of a Base Station Transceiver.
NUI National University of Ireland.
OCI Other cell Interference.
OFDMA Orthogonal Frequency Division Multiple Access.
OSI Ordnance Survey Ireland.
OTD Observed Time Difference.
O-TDOA Observed Time difference of Arrival.
PCC Probabilistic Cell Connectivity.
RNC Radio Network Controller.
RSSI Received Signal Strength Indication.
SFTP Secure File Transfer Protocol.
SGSN Serving GPRS Support Node.
SIM Subscriber Identity Module.
SS Signal Strength.
STB Space Time Bead.
STP Space Time Prism.
TA Timing Advance.
TDMA Time Division Multiple Access.
TDOA Time Difference of Arrival.
RFID Radio-frequency Identification
UTMS Universal Mobile Telecommunications System.
UTRAN UMTS Terrestrial Radio Access Network.
VCP Virtual cell Path.
VLR Visitor Location Register.
α A scalar to balance the learnt mobility patterns summarised by a mobility Markov chain with the influence of random transition probabilities
¯
H NormalisedH
¯
hi j Normalisedhi j
¯
Ni The number subscribers living within an individual EDi
ˆ
D Normalised from ofD
Υu The transition intensity matrix of theuth subscriber
A A diagonal matrix used to convertHtoD
ai Is the spatial area ofEDi
D A matrix which relates ED building density to cell coverage regions
H A matrix which relates the number of buildings in each ED to cell coverage regions
hi j The number of homes from EDiassigned to region of interest j
M The number of EDs
Nu The number of subscribers
Nj The number of estimated subscribers living in a region of interest
P A transition probability matrix
Pu The transition probability matrix of theuth subscriber
pi j The conditional probability that a process will transition from stateito state
j
2.1 Simplified structure of a communication flow in a mobile telecommunication
system. . . 10
2.2 Simplified structure of a mobile telecommunication system. . . 11
2.3 Typical cell shapes. A-G refers to the frequency channel used by each individual base station. . . 15
2.4 An example hierarchical cell structure [1] . . . 15
2.5 Observed mobile transmissions through recorded RSSI of mobile spectral energy from detecting sensors. . . 24
2.6 Weighted RSSI, highlighting time periods of high activity. . . 25
2.7 Normal mobile device activity from the student population of NUI Maynooth over consecutive time periods (1.5 hours). . . 25
2.8 Weighted RSSI, highlighting time periods of high activity. . . 25
3.1 The system architecture used to process the CDR. . . 29
3.2 Voronoi diagram of 2G and 3G cell site coverage regions. . . 35
3.3 Restricted 2G and 3G cell site coverage regions. . . 36
3.4 Sectored 2G and 3G cell coverage regions. . . 37
3.5 Depiction of the level of uncertainty associated with the distanced travelled between cellsCiandCj fromtitotj. dmini j shows the shortest distance between the cells whiledi jmaxshow the longest distance between them. . . 39
3.6 Distances travelled within a given time frame as observed through CDR. . . 40
3.7 Distances travelled within a given time frame as observed through CDR with tolerance boundary and infeasible travel speed region superimposed. . . 40
3.8 Distances travelled against the upper bound travel time as observed through CDR with applied filtering. . . 41
3.9 Distances travelled against the minimum travel time as observed through CDR with applied filtering. . . 42
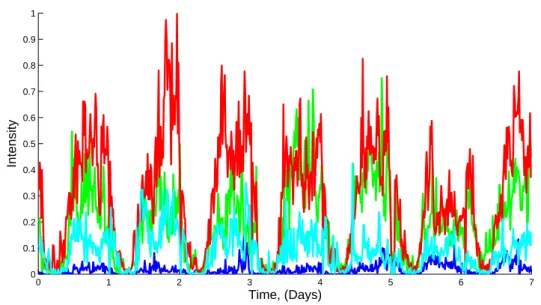
3.10 Temporal activity patterns of four randomly sampled cell towers over a seven-day period. . . 43
3.11 Example of a weighted lattice which corresponds to activity at a single cell tower. Here activity at a cell was set to 1000 and the cell radius is 2500 metres. 44 3.12 Spatial distributions of Data Sessions . . . 45
3.13 Spatial distributions of Call Activity . . . 46
3.14 Spatial distributions of SMS Activity . . . 47
3.15 Space time cube visualisation of 50 user trajectories. . . 48
3.16 Probability density function (pdf) of time intervals between consecutive mobile calls: (a) over the range 0-4500 seconds; (b) over the range 0-120 seconds. . . . 49
3.17 Probability density function (pdf) of time intervals between consecutive mobile SMS: (a) over the range 0-4500 seconds; (b) over the range 0-120 seconds. . . 49
3.18 Probability density function (pdf) of time intervals between consecutive mobile data sessions: (a) over the range 0-4500 seconds; (b) over the range 0-120 seconds. . . 49
3.19 Probability density function (pdf) of the duration of calls. . . 50
3.20 Probability density function (pdf) of the duration data sessions. . . 51
3.21 Proportion of observable user population over a seven-day period. . . 51
3.22 τ distributions observed over a 24-hour period, where each distribution of τ captures the observed times between activities which occurred within a temporal window and the next consecutive activity for individual subscribers. Temporal information is encoded using the colour chart provided. . . 53
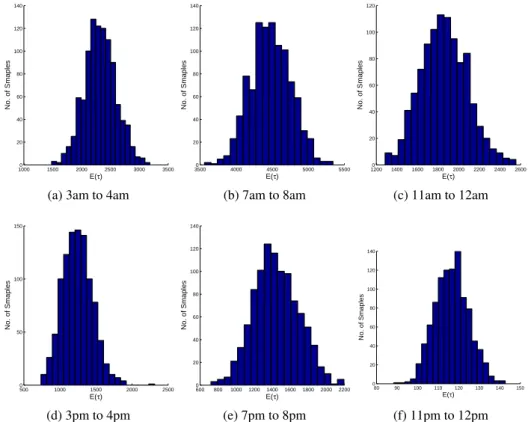
3.23 Distributions of the mean time to the next subscriber activity, where the initial activity occurred at; (a) 3am to 4am; (b) 7am to 8am; (c) 11am to 12am; (d) 3pm to 4pm; (e) 7pm to 8pm; and (f) 11pm to 12pm. . . 53 3.24 The variance in E(τ) over a 24-hour period: (a) E(τ) with 95% confidence
intervals; and (b) the number of activities. . . 54 3.25 Dendrogram of hierarchical cluster tree. Note for visual clarity, the number of
leaf nodes is limited to 200. The full tree has over 10,000 nodes. . . 55 3.26 Regional coverage polygons. . . 56 3.27 The proportional link strengths demonstrating observed transitions between
clustered cell regions. . . 58 3.28 Average daily activity volumes of subscribers moving between clustered
regions covering the towns of Maynooth and Leixlip, in the direction of Maynooth to Leixlip. . . 58 3.29 Average daily activity volumes of subscribers moving between clustered
regions covering the towns of Maynooth and Leixlip, in the direction of Leixlip to Maynooth. . . 59 3.30 Communication flow between clustered cell regions: (a) Calls; and (b) SMS. . . 60 3.31 Sample user connection graph. . . 61 4.1 Methodology used to identify the routes taken by individuals as they travel
between regions of interest. . . 65 4.2 A CDR journey trajectory between two regions of interest,RaandRb. . . 67
4.3 An illustrative example depicting a kernel density estimate for a single journey trajectory as shown in Figure??. . . 68 4.4 Probability density function (pdf) of time intervals between consecutive mobile
phone activities . . . 69 4.5 The number of agents active in each temporal slot given that the time between
each activity is sampled from the distribution of τ, plotted in Figure??. The total number of agents is 1000 and the temporal bin width is 2.1 minutes. . . . 71 4.6 Estimated location of activities (Ax,Ay), indicated by•, along a travel path of
4.7 Distribution of GPS recordings from OpenCellID from devices active on the Meteor Network . . . 73 4.8 Distribution of the observed distances OpenCellID recordings were from
servicing cell site locations. . . 73 4.9 Irregularities (red circle) in OpenCellID recordings . . . 74 4.10 Distribution of the observed distances OpenCellID recordings were from
servicing cell site locations with irregularities removed. . . 75 4.11 Distribution of likelihood of connecting to a cell as a function of the normalised
distance ˆsfrom the cell tower location. . . 75 4.12 Illustration showing the calculation of distanceψand angleθ. . . 76 4.13 The spatial dispersion of connection probability from selected cells: (a) Cell
with a radius of 2 km; and (b) Cell with a radius of 10 km. . . 77 4.14 Simulated CDR trajectories, J, travelling along travel paths of interest, T,
between Dublin City and Cork City: (a) Path following rail line; and (b) Path following motorway. . . 77 4.15 An example of a VCP and selected CDR journey trajectories, where the cells
which construct the VCP for routeT are indicated in green. . . 79 4.16 Quantisation of a trajectory of interest, T, onto a spatial lattice of hexagonal
nodes. . . 80 4.17 Trajectory dataset used to compare the similarity metrics. The simulated
trajectories (Ji) along travel paths T1 and T2 are depicted in (a) and (b),
respectively. . . 84 4.18 Kernel density estimate of simulated activities from misclassified journeys for
(a) VCP; and (b) LCSS. . . 85 4.19 Sample of simulated CDR journey trajectories between regions Ra and Rb
along: (a)T1and (b)T2. . . 86 4.20 Cells located within city boundaries of (a) Dublin City; and (b) Cork City. Cell
site locations are indicated by black dots. . . 88 4.21 Extracted journey trajectories between Dublin City and Cork City from
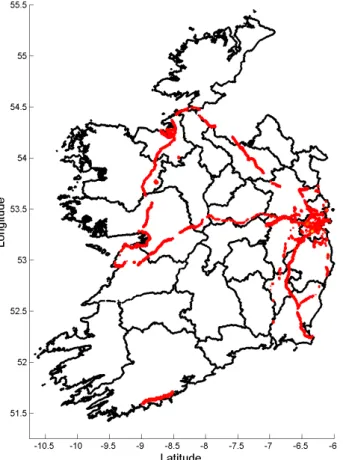
4.22 Travel time distribution of extracted journey trajectories between Dublin City and Cork City. Note a temporal bin width of 1 hour was used. . . 89 4.23 Major transportation links between Dublin City and Cork City. . . 90 4.24 Kernel density estimate of journey trajectories identified as travelling along (a)
road; and (b) rail travel paths. . . 91 4.25 Travel times of journey trajectory identified as travelling along (a) road; and
(b) rail travel paths. . . 91 4.26 Unlabelled points which correspond to the locations of (a) road; and (b) rail
tracks. . . 92 4.27 A sample of a hexagonal lattice which covers road point data; (a) road point
data indicated in red; and (b) nodes containing road point data indicated in green. Note each lattice node width is 2.5 km. . . 93 4.28 Dendrogram illustrating the arrangement of the clusters produced by the
agglomerative hierarchical clustering of travel paths from: (a) road travel paths; and (b) rail travel paths. . . 94 4.29 The selected paths from within each cluster with the lowest travel cost for both
road and rail networks. . . 95 4.30 Kernel density estimate of trajectories assigned to each route on the rail network 97 4.31 Kernel density estimate of trajectories assigned to each route on the road network 98 4.32 Generated travel paths of journeys classified as travelling along (a) rail; and (b)
road transportation link paths. . . 101 5.1 Overview of each population estimation technique. . . 105 5.2 The aggregated flow of subscribers to and from a clustered cell region covering
Dublin city centre from 13/12/2010 to the 19/12/2010. Inward and outward flow intensity is measured using the left hand axis, while the quantity of observed stationary subscribers is measured using the right hand axis. . . 107 5.3 The aggregated flow of individuals to and from the Donnybrook region of
5.4 Comparison of traffic count data and the aggregated bi-directional flow in-tensity of subscribers moving between Kildare town and Monasterevin: (a) Clustered region coverage areas, town locations and traffic counter location; and (b) Observed transition intensity between each town. . . 108 5.5 Average intensity of subscriber transitions between clustered cell regions. . . . 109 5.6 Dublin city regional transition flows in time periods of (a) low; and (b) high
intensity, where the width of the connecting arrow corresponds to directional flow intensity. Note connecting arrows with very low intensity have been removed for visual clarity. . . 110 5.7 A state transition diagram of a particular Markov chain representing the
observed outcome from a series of biased 4-sided die rolls. . . 112 5.8 CDR trajectory state sequence sampling of the output sequence S = {S1,
S1, S3, S3, S4}. Smaller yellow circles represent actual regional transitions
within a sample period and larger yellow circles represent the observed output transition sequence before resampling. The larger white circle represents missing information and is discarded. . . 114 5.9 Visualisation of a subscriber’s transition probability matrix P, where arch
heights correspond to transition probability. Note weights which are asymp-totically zero are removed for visual clarity. . . 115 5.10 Visualisation of aggregated probability matrix, P, characterising the flow of
individuals across the Republic of Ireland, where line colour corresponds to transition probability as shown on colour bar. . . 116 5.11 Visualisation of the fixed row vector, wu, for the modified mobility Markov
chain,Qu, of the subscriber whosePis depicted in Figure??. . . 119
5.12 Population density estimates based on (a) individual home locations as sourced from subscribers; and (b) aggregated mobility model. . . 120 5.13 Sourced from the Central Statistic Office (CSO) Ireland, (a) town locations
across the Republic of Ireland, with (b) corresponding normalized population density. . . 121
5.14 A sample of the spatial distribution of buildings across the Republic of Ireland. Also included is the cell coverage regions in the area (indicated by red lines), and ED boundaries (black lines); (a) Residential locations (blue dots); and (b) Commercial buildings (black dots). . . 122 5.15 Electoral division population estimates across the Republic of Ireland from (a)
maximum weighting; and (b) aggregated vector. . . 123 5.16 Proportional population estimated for the Dublin region from (a) census counts;
(b) maximum weighting; and (c) aggregated vector. . . 124 5.17 The spatial variance of percentage error between census data and estimated
population from (a) maximum weighting; and (b) aggregated vector. note the percentage error is calculated based on normalised population count. . . 125 5.18 Impact of spatial resolution on the correlation between census data and
population density estimates form the aggregated vector approach. . . 128 5.19 Impact of spatial resolution on the MSE between census data and population
density estimates form the aggregated vector approach. . . 128 5.20 Communities identified across the republic of Ireland using the eigenvector of
the second largest eigenvalue for the aggregated mobility Markov chain model. Communities are colour coded based on their corresponding eigenvector weight as shown on colour bar. Omitted cell coverage polygons correspond to cells with incorrect location data. . . 129 5.21 Visualisation of sub-communities which exist within (a) Dublin city; and (b)
Cork city. . . 130 5.22 Identified communities and corresponding region rank weights for two
ran-domly select subscribers, U1 and U2. The communities identified for each subscriber are depicted by (a) and (b), respectively, while the relationship between region rank and second eigenvector weight for each subscriber are depicted by (c) and (d), respectively. . . 131 6.1 Spatial mapping of the combined steady state vector weights from a sample of
6.2 The number of CDR activities at cells whose coverage areas polygon services The O2 Dublin, from 01/12/2010 to 15/01/2011 in 15-minute temporal bins. . . 136 6.3 The accumulated flow of subscribers around the The O2 Dublin, from the
01/12/2010 to the 15/01/2011 using 15-minute temporal bins. . . 136 6.4 Illustration of the plausible region of occupancy estimated using the concept of
Space Time Prisms, given a maximum velocity vmax and connective locating
cell towersC0andC1; (a) Space Time Prisms; (b) Space Time Bead. . . 137 6.5 Kernel density estimates of the changing population density relating to
indi-viduals who were at or in the vicinity of the O2 Dublin during the Deadmau5 concert at The O2 amphitheatre Dublin on the 14thDecember 2010. . . 139 6.6 Illustration of a subscriber’s CDR trajectory with sample semantic data. . . 140 6.7 The relationship between local amenities and the steady state vector weight,w,
for a selected subscriber using (a) accumulative cell weighting; and (b) ranked vector weighting. . . 141 6.8 The catchment area of the Liffey Valley shopping centre, Lucan, Co. Dublin.
Estimated of catchment area is based on the population density of subscribers with a steady state vector weight of (a)≥1%; (b)≥5%; (c)≥10% and (d)≥
3.1 CDR call originating table structure . . . 30 3.2 CDR SMS originating table structure . . . 30 3.3 CDR call terminating table structure . . . 31 3.4 CDR SMS terminating table structure . . . 31 3.5 CDR data session table structure . . . 32 4.1 Processed CDR structure used in the formulation of user CDR trajectories . . . 67 4.2 Trajectory similarity measurement techniques. . . 84 4.3 Accuracy of closed travel path assignment using different similarity
measure-ments. . . 84 4.4 Spatio-temporal trajectory similarity measurement results . . . 87 4.5 Classification of travel path taken by 9490 journey trajectories between Dublin
City and Cork City. . . 91 4.6 Classification of travel path taken by 9490 journey trajectories between Dublin
City and Cork City. . . 96 5.1 A comparison of census data and estimated population density for each county
in the Republic of Ireland, where measurements are the percentage of total population. . . 127 6.1 Events at The O2 Dublin. . . 136
1
Introduction
The ubiquitous nature of technology in modern human civilisation coupled with advancements in data acquisition techniques has resulted in the quantity of data related to human activity rapidly expanding. Typically, information which corresponds to human activity may be characterised as survey based, passive, activity based and device based. The availability of data, accuracy, scalability, cost and information content related to each approach varies dramatically. Survey based approaches gather human activity data, preferences and behavioural data through the information entered by people partaking in a survey. Surveys such as national census [2], household surveys [3, 4] and customer satisfaction surveys [5] play an important roll in formation of government policy [6], regional planning [7] and corporate governance [8]. Studies on travel behaviour [9, 10], marketing [11, 12] and health [13, 14, 15] demonstrate how surveys may be used to gauge public opinion, behaviour and mobility.
Passive sensing approaches infer human activity through static sensors and the loads observed by service networks. Examples of passive sensors include flow counters [16, 17], traffic cameras [18, 19, 20] and sensing devices [21, 22, 23, 24]. The spatial and temporal resolution achieved by using these devices is often dictated by the spatial distribution of the sensors and their respective coverage areas. Mobile device activity [25], WiFi activity [26] and the flow of Bluetooth enabled devices [27] have also been used to measure both the spatial and
temporal dynamics related to human activity. The tracking of bank notes [28], spatial variations in the amount of available public bikes [29], sensor GPS traces [30] and the tracking of travel cards [31] also demonstrated that passive sensing approaches could be used to observe human mobility behaviour.
Activity based approaches record when, where and how people interact with services and applications. Examples of activity based monitoring includes among others the making of phone calls [32, 33], tracking behaviour from retail membership reward cards [34, 35] and the tracking of consumer purchases [36, 37, 38]. The activity data sourced from services such as Twitter, Foursquare and Flicker have also be used to gauge public opinion [39, 40, 41], study human mobility [42, 43, 44, 45] and social connection [46].
The behaviour and location of people may also be recorded by sensing devices [47]. Sensing platforms [48, 49, 50, 51, 52], sensors placed on mobile cellular devices [53, 54], radio-frequency identification (RFID) tags [55, 56], Bluetooth monitors [57] and global positioning system (GPS) logging devices [58, 59, 60, 61] have been used in applications related to among others health, land use, mobility and intelligent transportation.
Each collection methodology has associated uncertainty with respect to the quality of gathered human activity information. For example, the accuracy of survey based approaches may be influenced by the memory of each individual partaking in the survey [62], sensor data is affected by the accuracy of each device [63] and activity based approaches have sampling related issues [64]. As a result, the selection of which collection method to use given accuracy requirements, scalability, associated cost and desired information needs careful consideration. Consideration should also be given to the privacy of monitored individuals, as studies which infringe on this right may face legal reprimand.
Typically, the cost associated with carrying out a survey can be prohibitively expensive. As a result, large surveys such as censuses tend to be carried out infrequently. However, the information which may be gathered can be extremely detailed as people can enter complex information about their preferences, behaviour and relationships. The information which may be extracted from a passive sensing application is dependant on the sensing device used. Large urban and national scale observations are limited by the cost of individual sensors and infrastructure requirements. As a result, passive sensing applications are better suited to monitoring human activity at local scales. Similarly, device based studies rely on the
cooperation of each individual carrying the sensing device to share sensor information, thus limiting the scalability of such studies.
Activity based approaches may be suited to macro scale analysis if the service network or application from which the activity measurement was taken is ubiquitous in society. However, the information which may be gathered is limited by the type of service/application used. For example, WiFi usage patterns do not reveal the gender of the person using that service or their music preferences. Likewise, mobility studies which require both high spatial and temporal sampling might not be suited as temporal sampling resolution is dictated by the activity profile of each individual person and spatial accuracy is limited to the underlying network of the service/application.
1.1
Motivation
Measuring the movement of people is a fundamental activity in modern society. The ability to monitor movement insures that transportation services are able to function, planning authorities can design adequate infrastructure and governments can implement national policies. Personal location data is also the primary data source used in the delivery of mobile telecommunications [65] and location-based services (LBS) [66].
The research presented in this thesis uses human activity data to develop applications related to different aspects of human movement behaviour. The primary data sourced used is anonymised CDR from Meteor, a mobile network operator in the Republic of Ireland. Call detail records (CDR) consist of user information relating to people in connection with the network operators, the nature of the communication activity (voice, SMS, data, etc.), duration of the activity, starting time of the activity and servicing cell identification numbers of both the sender and the receiver when available. As a result, assuming users carry their mobile devices most of the time, it has the potential to be a low cost scalable source of human activity data.
While such activity data has a wide variety of applications, this research focuses on population density estimation, travel path identification and marketing insights through CDR metrics. This is motivated by the host of potential practical applications which include, among others, utility load forecasting and dynamic transportation services. The ability to deliver intelligent geographically located marketing applications to create new revenue streams for
mobile operators is also an attractive proposition for in-dept investigations.
Likewise, dynamic population estimation can supplement tradition national census. Cur-rent population estimation research efforts using mobile generated data often require the estimation of mobile subscriber home locations which can be computationally intensive and may have privacy related issues [67, 68, 69, 70]. As a result, there is a need for different approaches which can provide population density measurements which are both computationally efficient and privacy preserving. Research presented within this thesis addresses such concerns by obtaining a direct measure of population density through the steady state vector of a modified Markov chain mobility model characterising the regional transitions of Meteor’s customers.
The cost associated with transportation surveys motivates the requirement for low cost and scalable alternatives. Exploiting mobile network data is an attractive proposition in this regard [71]. However, due to the lack of trip metadata, spatial uncertainty and temporal sampling issues, it is difficult to relate CDR positional estimates to transportation related features. Addressing these issues, similarity metrics are developed to quantify the resemblance between CDR trajectories and known travel paths between regions of interest.
1.2
Privacy
Over the last decade, the boundaries and content of what is considered private have been the subject of much debate and legal challenge. As defined by Westin [72] “Privacy is the claim of individuals, groups or institutions to determine when, how, and to what extent information about them is communicated to others, and the right to control information about oneself even after divulgating it” [71]. Typically what is considered private differs between various groups and individuals, and is often challenged under the title of “public interest”.
The ubiquitous nature of wireless technologies and their subsequent impact on privacy has directed legislators to devise various laws and regulations which govern how content sourced from such devices may be used and handled [73]. Within the European Union, there are several pieces of legislation which address privacy. Article 7 of the Charter of Fundamental Rights of the European Union (2000/C364/01) [74], states ‘Everyone has the right to respect for his or her private and family life, home and communications’. Directive 95/46/EC [75] of the
European Parliament and of the Council outlines a framework for the protection of individuals with regard to the processing of personal data and on the free movement of such data. Directive 2002/58/EC [76] of the European Parliament and of the Council, concerns the processing of personal data and the protection of privacy in the electronic medium of communications. Directive 2006/24/EC [77] of the European Parliament and of the Council, instructs providers of electronic communications services and networks to keep traffic data record related to telephony communication and emails for a period of six months to two years, depending on the Member State. The traffic data includes the information which is required for identifying the originator and the recipient of phone calls (including Internet telephony), SMS and emails, together with information on the time, date, and duration of these communications [73].
As a result of the aforementioned directives and the commercial interests of service providers, access to such data is difficult to obtain. In the telecommunication sector, access to data governed by Directive 2006/24/EC has typically only been made available to a number of selected research institutions and commercial entities after contractual agreements are put in place which govern its use. Privacy issues stemming from such collaborations customarily arise when the tracking of people or goods transported are addressed [71]. To ensure that telephony data does not breach current regulations on data protection, such information should be received and handled in an aggregate and anonymous manner, which maintains user privacy. Typically, user anonymity is addressed by a hashing of the user’s unique MSISDN code. A MSISDN is a uniquely identifiable code which links to a person’s subscription on a mobile cellular network. Such hashing guarantees that a user’s identity is not directly observable. However, research has shown that through aggregation with external data sources and prior knowledge, a user may still be identified [78, 79, 80]. As a result, techniques have evolved which aim to hide user identity through forms of aggregation [81, 82, 83, 84, 85]. The research detailed within this thesis addresses privacy through a hashing of MSISDN codes and suitable aggregation. Note, no attempt to aggregate the data with external sources has been made or allowed. The details of additional steps taken are outlined in subsequent chapters.
1.3
Thesis Contributions
The general focus throughout this thesis is on the development of applications for large scale mobility estimation through the use of mobile telephony call detail records (CDR). Methodologies are developed which enable applications such as population estimation, travel route discovery and geographical marketing. In this context, the main contributions of the research presented in this thesis are as follows:
• The development of a novel methodology and distance measurements which enables the identification of mobile subscriber travel paths.
• The development of a novel methodology for population density estimation based on significant mobile subscriber regions of interest.
• Insights into how a mobile network operator may use subscriber generated data to help create new revenue streams and improved network performance.
Other minor contributions of this thesis include:
• A methodology for CDR feature extraction, data visualisation and cleansing techniques. • A novel procedure for simulating journey trajectories along known travel paths.
• A novel procedure for constructing Generating Travel Paths (GTP) from CDR journey trajectories, where a GTP represents the likely path taken by a group of similar CDR journey trajectories which move between regions of interest, without prior knowledge of any underling travel routes.
1.4
Thesis Organisation
The remainder of the thesis is organised as follows:
Chapter 2 critiques the use of mobile cellular networks as a suitable sensing platform
for monitoring human activity patterns. It starts by giving the reader a brief overview of modern mobile cellular networks and discusses the various techniques for mobile telephony data procurement, including an overview of current research using such data. It then details
the development of a sensor used for the passive collection of client side mobile phone accumulative RSSI activity. The chapter concludes with a discussion of the evolution of mobile networks and how this might impact on human activity research directions into the future.
Chapter 3 describes the structure of call detail records (CDR) and the system used for data processing in this research. The development of cell coverage area models is also described, along with a suitable technique for mapping multiple cell coverage polygons to a single representative location covering a population centre. Then procedures for the extraction and visualisation of various CDR features are examined. The chapter concludes with a discussion on the taxonomy of possible applications which may be developed from the features extracted.
Chapter 4 details novel distance measurements (VCP and PCC) which enable the
measure-ment of similarity between CDR journey trajectories and travel paths of interest. A comparison of established trajectory distance measurements and each of the proposed techniques is given, and it is demonstrated that both VCP and PCC achieve greater accuracy when classifying which route CDR journey trajectories took. Novel enhancements to the distance measurement Longest Common Subsequence (LCSS) are then given which improve the accuracy of LCSS with respect to CDR trajectory distance calculations. The CDR journey trajectories used in each comparative study, are generated using a novel procedure for simulated journey trajectories along known travel paths. Also detailed is a novel procedure used to construct Generated Travel Paths (GTP) of CDR journey trajectories. A GTP represents the likely path taken by a group of similar CDR journey trajectories which move between regions of interest, without prior knowledge of any underling travel routes. Finally, the chapter is concluded by discussing each of the topics covered.
Chapter 5 presents novel techniques for population estimation based on significant mobile
subscriber regions of interest. The techniques use the steady state vector of a modified Markov chain mobility model which characterises the mobility of individual subscribers and national aggregated mobility, respectively, as a means of identifying the principle location of subscribers, thus providing a proxy for population density. Results show a high correlation between estimated population counts and a national census, which was carried out in 2011. A methodology for visualising the flow of people across the Republic of Ireland is also given,
with insights into how the transition intensity observed may be used for event detection. The chapter is concluded by discussing the limitations and benefits of each technique presented.
Chapter 6 details initial work into the development of geographical marketing applications built on the outputs of previous chapters. This includes methodologies for identifying black spots related to high data rate subscribers, event mobility patterns and the segregation of subscribers based on their perceived links with geographical features of interest. The chapter is concluded by discussing how future research may build upon these initial findings towards the aim of fully commercialised applications.
Chapter 7 concludes the thesis with a summary of the work completed, contributions made
2
A Human Sensing Platform: Mobile Cellular Networks
In the last decade, mobile phones and mobile devices utilising mobile cellular network connections have become ubiquitous in modern society. In several developed world countries, the penetration of such devices has surpassed 100%. They facilitate communication and access to large quantities of data without the requirement of a fixed location or connection. As mobile phones and devices are mostly used by people, their activities and motion are indicative of the mobility pattern and cellular usage of the person using them. As such, the network of mobile phones and devices may be considered as a large scale distributed human activity sensing platform.
In this regard, exploiting the data collection capabilities of mobile devices is an attractive proposition. Over the last few years, various studies have demonstrated that information sourced from mobile device activities can be used to reveal space-time behaviour patterns relating to human mobility [86, 87, 88, 89], social structure [90] and land use [54, 67, 91, 92]. In all cases, it is noted that the type of analysis possible is strongly influenced by the underlying data collection methodology and the quantity of data available. Before actively acquiring such data, it is important to consider the structure and behaviours of a mobile phone network and how it may affect observations. Also, as mobile networks evolve to meet the future requirements of their customers, it is also important to consider how this will impact on future
research directions.
This chapter begins by presenting a brief overview of modern mobile cellular networks. The procurement of mobile telephony data is then discussed in Section 2.2 and Section 2.3. Section 2.2 outlines the data sources available to mobile networks operators, and gives an overview of current research using such data. Section 2.3 follows with a discussion of alternative methods for obtaining mobile telephony data and details the development of a sensor used for the passive collection of client side mobile phone accumulative RSSI activity. Section 2.4 concludes the chapter with a discussion of topics covered and insights into the evolution of mobile networks and how this might impact on future research directions.
2.1
Mobile Telephony Networks
A mobile telephony network is a geographically distributed radio network that enables communication via voice, text or data between two or more devices [1, 93, 94, 95, 65]. At one particular time instance, each device has typically a wireless connection to one fixed-location transceiver, known as a tower. Each tower covers a service area, known as a cell, ranging from several square kilometres in rural areas to several hundred square metres in urban districts. Each device communication flow, including intra-cell communications, passes from the initiating device’s connected transceiver through hierarchical network elements before being routed to the destination cell and subsequent receiving device, as depicted by Figure 2.1.
Mobile Network Initiating Device Receiving Device Transceiver Transceiver
Figure 2.1: Simplified structure of a communication flow in a mobile telecommunication
system.
A typical mobile network consists of a combination of second and third generation wireless telephone technologies (2G/3G), with newer systems employing long term evolution
wireless telephone technology (4G LTE). A simplified hierarchical structure of the combined subsystems is depicted in Figure 2.2. For the purpose of human sensing, a mobile network may be divided into three main sections, namely the mobile subscriber layer, the radio access networks and the core network. The mobile subscriber layer is comprised of mobile telephony enabled devices or mobile stations (MS) which are subscribed to a mobile network. The radio access networks consist of radio transceivers used to transfer data from the MS to the core network. The core network is the central part of the mobile telecommunication network. It provides the services which enables mobility, communication and billing.
Node B Node B Node B Node B Node B Node B Node B Node B Node B Node B Node B Node B UTRAN BTS BTS BTS BTS BTS BTS BTS BTS BTS BTS BTS BTS GRAN / GERAN M o b il e S u b s c ri b e r L a y e r R a d io A c c e s s N e tw o rk s T h e C o re N e tw o rk eNode B eNode B eNode B eNode B eNode B eNode B eNode B eNode B eNode B eNode B eNode B eNode B eUTRAN RNC BSC Serving Gateway MME SGSN Telco External Gateway 4G/LTE 3G/wCDMA 2G/GSM Data Packet switched network Voice circuit switched network MSC
Depending on the mobile communication standard employed, the radio access network types will vary between the 2G, 3G and 4G equivalents. A GSM radio access network (GRAN) consists of base transceiver stations (BTS) and base station controllers (BSC). A UMTS terrestrial radio access network (UTRAN) consists of Node B transceivers and radio network controllers (RNC). An evolved UMTS terrestrial radio access network (eUTRAN) is comprised of evolved Node B (eNode B) and serving gateways. The core network contains elements of the respective 2G, 3G, and 4G telephone technologies which includes among others, a mobile switching centre (MSC), serving GPRS support nodes (SGSN) and mobility management [65].
2.1.1 Multiple Access Techniques
Mobile telephony networks allow the simultaneous transmission and reception of communi-cation between mobile devices, within a finite amount of radio spectrum. This is achieved by utilising several multiple access techniques, with the primary focus of permitting transmitting stations to communicate with receiving stations without any interference [65]. This increases overall network capacity as more communications can be facilitated within a limited amount of radio spectrum. The multiple access strategy employed varies between each generation of mobile telephony system, but each may be generalised by its primary approach, namely frequency, time or code division multiplexing. These strategies also effect network mobility management, a major component of cellular networks, as the locating strategies are often a function of the multiple access technique employed. The main approaches are briefed as follows:
• Frequency Division Multiple Access (FDMA); Here, individual channels or unique
frequency bands are assigned to each mobile station on demand to users who require service. For the duration of the activity, no other device may use that channel.
• Time Division Multiple Access (TDMA);This approach divides the radio spectrum into
time slots. In a similar fashion to FDMA, each time slot is assigned to an individual on an on demand basis, and is allocated to that user for the entire transmission.
• Code Division Multiple Access (CDMA);A spread spectrum technique, CDMA
The spreading signal is a pseudo-noise code sequence that has a chip rate orders of magnitude greater than the data rate of the message signal [93]. Each active mobile device is assigned a spreading code, approximately orthogonal to all other codes, and may transmit simultaneously using the same carrier. For the receiver to be able to recover the original message it must know the spreading code applied. Decoding is achieved through a time correlation operation, where all other codewords appear as noise due to decorrelation [93].
• Orthogonal Frequency Division Multiple Access (OFDMA);This technique uses time
sharing and dynamically assigned orthogonal subcarriers to provide multiple access to users. Users who require high data rates may be assigned a higher number of subcarriers compared to those who require low data rates.
For a comprehensive overview of these techniques see [1], [65] [93] and [94].
2.1.2 Spatial Coverage
As radio access network elements communicate wirelessly to devices present in the mobile subscriber layer, their transmissions suffer an effect known as path loss. Path loss refers to the amount of energy lost between transmission and reception of a signal. Assuming the use of an isotropic antenna for transmission, a propagated signal energy will expand over a spherical wavefront, so the energy received at an antenna a distance d away is inversely proportional to the sphere surface area, 4πd2 [94]. More precisely, the free space path formula, or Friss formula, is given as
Pr =Pt
λ2G
tGr
(4πd)2 (2.1)
wherePrandPt are the received and transmitted powers,λis the wavelength andGr,Gt refer
to the receiver and transmitter gain, respectively.
Due to such effects, it is only possible to reliably communicate over some limited distance, given a maximum allowable transmit power. This allows transmitters to operate on the same frequency at the same time by virtue of being spatially isolated [94]. This effect is the theoretical basis for cellular mobile telephony systems as the overall capacity of a system increases as more simultaneous transmission are allowed to occur [94].
As such, the service area of a mobile telephony system is subdivided into smaller geographical regions. These smaller regions are commonly referred to as cells, and contain a single base station. To avoid interference between neighbouring cells, the transmit power level of each transceiver is regulated such that there is just enough to provide the required signal strength at the cell boundaries. Due to propagation path loss, the frequency channels they operate at may also be reused, as long as cells operating at the same frequency are spatially isolated. However, perfect spatial isolation cannot be achieved in practise, thus the rate of frequency reuse is determined such that the interference between cells is kept to an acceptable level [94]. This interference, which is known as other cell interference (OCI), still significantly impacts the performance of mobile systems. A common technique to reduce its effect is to sectorise cells, where sectorisation is achieved through the use of directional antennas [94]. As such, it is common for a cell to refer to an area covered by one sector, in which case a single base station site may have several associated cells [65].
Typical cell layouts are depicted in Figure 2.3. The hexagonal shape commonly associated with mobile telephony cells (Figure 2.3a), is an idealised depiction of coverage and does not accurately reflect actual cell boundaries. Instead Figure 2.3b more truly reflects their observed non-geometric shape with some areas not having the required signal strength for various reasons [65]. The spatial distribution of such cells is generally dictated by capacity requirements. In general, capacity can be increased by increasing the density of cells. This is achieved by turning down the transmit power to make cells smaller [94]. An operator may also use hierarchical cell structures (Figure 2.4), such as small cells, to increase network coverage or capacity in areas with very dense cellular usage [1].
Due to the fact that each mobile telephony standard is effectively frequency division multiplexed (FDM) in the radio spectrum, network planners design each network coverage layout independently. As a result BTS, Node-B and eNode-B may be mounted on a single tower, with each transceiver servicing the same particular geographical region in space. However, as mobile networks evolve and frequency reuse between standards becomes more prevalent, the layout of each network will be influenced, and sometimes limited, by the capacity requirements of other standards.
F Base Station Coverage Area G B C E G D E G B F A E A1 A2 A3 Sectorised Cells (a) Idealised Uncovered Region (b) Practical
Figure2.3: Typical cell shapes. A-G refers to the frequency channel used by each individual base station. Macro Cells Microcells A directed high-capacity Macrocell covering a motorway Small Cells
2.1.3 Mobility Management
Mobility management is a major function of mobile networks. The aim of mobility management is to track where the MSs are, so that calls, SMS and other cellular services can be seamlessly delivered. In LTE systems, the MME is responsible for mobility management [94], which includes among others, functions such as tracking, handovers, paging and inter-cell interference coordination. There are two types of location registers used by GSM and UTMS networks [1, 93], namely the home location register (HLR) and the visitor location register (VLR). The HLR contains the permanent subscriber database which is registered to the operator’s core network, while the VLR contains both registered subscriber information and details of devices which are roaming on the network. An entry is added to a HLR when a new mobile device or subscriber identity module (SIM) card is registered to the operator’s network and remains static until subscription parameters are updated. Each HLR entry includes among others, the international mobile subscriber number (IMSI), MSISDNs, possible roaming restrictions, location area identity (LAI), MSC number and VLR number. The VLR contains similar information to the HLR, except information in the VLR is stored temporarily and contains the extra information on roaming customers.
To keep register information up to date, network operators require positional estimates of each mobile device. This has led researchers to investigate techniques which can be used to accurately locate mobile devices. The main approaches investigated are as follows:
• Cell Identification;This localisation technique uses the principle of proximity
measure-ment, and involves identifying, communicating and locating the base station to which the mobile phone is connected. The located coordinates of the serving base station is then associated with the mobile device. The accuracy of such spatial information depends upon the physical topology of the mobile network, i.e. the size and coverage area of the cells.
• Cell Identification+Timing Advance (TA);GSM uses a combination of Time Division
Multiple Access (TDMA) and Frequency Division Multiple Access (FDMA) of mobile stations for the efficient use of available spectrum [96]. Here each frequency slot is subdivided into eight time slots. Any one mobile device within a cell is assigned an individual frequency band and corresponding time slot in that band. For this protocol to
work, packets sent by any mobile device must arrive at the base station in its assigned frequency band within its allocated time slot. The time the packet takes to travel from the mobile device to its serving base station will vary with the distance separating both. Base stations dynamically control when each device starts its transmission to try and insure that packets sent will arrive in their assigned window. This variable controlling of transmission start is known as Timing advance. Thus, the distance of a mobile device from a serving base station can be extracted from analysing the duration of the timing advance. However, this method is only used if the mobile user is 550 metres or more away from the serving base station. Adjustments are calculated depending on how many multiples of 500-550 metres the mobile user is from a base station.
• Cell Identification + Signal Strength (SS);in a similar fashion to the dynamic control
of timing advance, the power at which a device may transmit is dynamically controlled by the serving base station. Since the attenuation in power experienced by a signal is a function of the distance travelled, base stations adopt a policy under which devices close are required to transmit with reduced power. This is to minimise the risk of devices close to base stations interfering with weak signals coming from devices further out. A base station implements this policy by monitoring the received signal strength indication (RSSI) of a mobile device. Once gathered, it then relays this information back to the device so that it can appropriately adjust its transmission power. Base stations try to maintain an optimal received signal strength to noise ratio for efficient communication. Thus, analysing the power or signal strength at which a transmitted signal is received allows inference of the distance between the mobile device and its serving base station.
• Time Difference of Arrival (TDOA); This is a triangulation technique, that can be
performed by both mobile devices and mobile networks. Position is determined by triangulating the time needed for a packet to be sent from a device to three finely synchronised base stations and back. Problems exist as all transmitters and receivers in the system have to be precisely synchronised. A time stamp must also be inserted at the transmitting side in order for the measuring unit to discern the distance the signal has travelled.
based on the existing observed time difference (OTD) feature of GSM systems. OTD calculates the time difference between signals travelling from two different BTS to a mobile device. As mentioned above though, TDOA has synchronisation issues. Environmental conditions such as multipath fading and channel characteristics effect the perceived relative positions of such BTS and MS. As a result mobile network operators use location measurement units. Theses units compute the clock differences between base stations and then relay this information back into the network. BTS then transmit synchronisation information to various mobile devices [97]. Once synchronised, handsets equipped with software that locally computes location can calculate time differences and therefore distance from each base station, making triangulation possible.
• Observed Time difference of arrival (O-TDOA); This is a TDOA-based approach
designed to operate over wideband-code division multiple access (WCDMA) networks. Effectively this is a WCDMA version of E-OTD [98].
• Angle of Arrival (AOA); This is a network localisation technique that uses a location
scheme based on the principle of angulation [63]. The underlying principal of this method is a reversal of the concept of beamforming. The direction of a mobile device from a transceiver is determined by the wave incident upon an antenna array. Each antenna in the array makes a unique observation relating to the wave incident upon it, which generally relates to the difference in received phase of that wave. These differences in phase enable AOA to be calculated. A device is located by taking the intersection of vectors projected at angles determined by AOA from two or more transceivers.
• Assisted global positioning system (A-GPS);Here devices use both GPS and terrestrial
cellular network localisation to obtain a geographic position [98].
The implementation of any one of the above techniques depends on the limitations imposed by the underlying mobile network structure. A more complete summary of techniques for both indoor and outdoor mobile device localisation is given by Sun et al. [97], Liu et al. [99], Kaemarungsi et al. [100], Pahlavan et al. [101], Hightower et al. [102], Jami et al. [103] and Sayed et al. [104]. Many of the aforementioned localisation techniques required line-of-sight (LOS) for accurate positioning, and may not be suited to localisation within an
urban environment, where multipath non-line-of-sight (NLOS) communication is prevalent. For these reasons, advanced localisation techniques have been designed which take account for the existence of mixed LOS/NLOS conditions [105]. Such techniques have applied data fusion techniques to merge data from various sources [104], [106], exploited redundant measurements [107], combined analytical models with maps of measurements [108], [109], and used Bayesian methods to estimate a device’s whole trajectory instead of estimating one position at a time [110], [111], [112], [113].
2.2
Mobile Operator Acquired Data
Modern mobile telephony networks routinely collect a wealth of information related to customer interactions in the context of their normal service operations. Functions such as connecting calls, delivering text messages via SMS or providing Internet access generate a huge amount of data which mobile network operators use for customer billing and service delivery.
Operator-based data sources include network bandwidth usage measurement logs which are typically measured in Erlang (in units of person phone use per-hour), handover records, locating area logs and call detail records (CDR). Handover records are recordings of migrations of a user from one servicing cell to another while in the process of an active call. Location updates area logs consist of periodic location updates relating to the set of cell towers which are prepared to service a particular mobile device at any given time. Call detail records (CDR) contain information about all interactions between a mobile phone network and their customers that are required for billing purposes. These contain anonymised user information relating to people in connection with the network operators, the nature of the communication activity (voice, SMS, data, etc.), duration of the activity, starting time of the activity and servicing cell identification numbers of both the sender and the receiver when available.
In typical telecommunication networks, such features are collected at the core network. When a subscriber activity occurs (i.e. customer makes a call, receives a SMS, etc.), their mobile device interfaces with either the BTS or Node B, the choice of which depends on current cell capacity utilisation, the subscriber’s required data load, and their current 2G/3G connectivity. Note, at this stage high resolution user positional estimates may be collected via
location triangulation or angulation, as discussed in Section 2.1.3, but the required information is not routinely stored and thus is typically not available. Instead, several of the activity logs including handover data logs, call detail records, network bandwidth usage measurement and user data quantities are stored at the relevant MSC or SGSN.
Whenever a change of user location area is detected, the MSC will initiate a transition update in either the location register HLR or VLR. This transition update may potentially provide more location-based data reflecting the mobility pattern of users compared to activity-based data. This is because of the generally higher sampling frequency by the nature of its information update. Also from the point of view of human mobility sensing, it does not suffer from the uncertainty associated with activity based updates. For example, in situations where users invoke activities only at starting and ending locations over a long distance journey, it may not be possible to estimate journey trajectories due to the lack of location-based data. Unfortunately, it is usually very difficult to obtain HLR and VLR data from mobile operators due to the lack of incentive for long-term storage. In contrast, mobile operators tend to treat activity-based call detail records with greater importance as it is required for legal compliance [73] and billing purposes. This explains the greater availability of CDR data for human mobility sensing.
Initiatives such as Data for Development [114], the Mobile Data Challenge [115] and CRAWDAD [116] have helped such datasets become more widely available in recent years. This has meant that there has been steady growth in the number of research groups which have gained access to human movement and behavioural data at urban and national scales. Ratti et al. [117, 118], Calabrese et al. [25, 119] and Horanont [120] each focused on the mapping of human activity. Ahas et al. [121] demonstrated that suburban commuter movements, tourist movement dynamics [32, 122, 123] and methods for home and work location estimation and population dynamics [68] could also be extracted from mobile telephony data sources. Tourist movements have also been studied by Kuusiket al.[124, 125], while alternative methods for home and work location estimation and population movement dynamics have been examined by Silmet al.[126], Calabreseet al.[127], Isaacmanet al.[128], Kellyet al.[129] and Ranjanet al.[64].
Areas associated with mass urban activity may also be readily sourced from cell ac-tivity counts, as demonstrated by Reades et al. [67, 91], Andrienko et al. [130, 131],