Estimating Industry Benchmarks
for the Value-Added Tax
Rosario G. Manasan*
Number 55, Volume XXX, No. 1, First Semester 2003
Introduction
The value added tax (VAT) was first adopted in the Philippines in 1988, replacing 12 different kinds of indirect taxes. The indirect taxes it replaced include annual fixed taxes, sales tax on manufacturers/producers, turnover tax on subsequent sellers, advance sales tax/compensating tax on importation of goods, millers’ tax, percentage tax on contractors, lessors of property, lessors/distributors of cinematographic films, excise tax on certain articles. The VAT was initially applicable to domestic sales and importation of goods. Exceptions to this coverage were agricultural, forest and marine products in their original form, certain inputs to agriculture (like fertilizers, seeds, seedlings, animal feeds), petroleum products, printing publication or sale of books, newspaper, magazine, review or bulletin which appears at regular intervals for subscription or sale, and sales of small firms.
In 1996, the VAT’s coverage was expanded to include most types of services like those provided by proprietors and operators of hotels, motels, pension houses, resorts; proprietors and operators of restaurants and other eating places, including caterers; and operators of taxicabs, utility cars for rent or hire driven by lessees, tourist buses, and other common carriers by land, air and sea relative to their transport of goods or cargo. It also included dealers in securities; lending investors; nonlife insurance companies; franchise grantees of telephone, telegraph, radio and TV broadcasting and other franchise grantees; and warehouses. In addition, the 1996 Expanded VAT law extended the coverage of the VAT to the sale/lease of real properties primarily held for sale/lease; intangibles (e.g., patents, copyrights, trademarks, tradenames, other property rights), importation of meat, pesticide, raw cane sugar, specialty animal feed, and importation of books, magazines, periodicals and newspapers.
Exempted from this expanded coverage are educational services, medical, dental, hospital and veterinary services, common carriers for transport of passengers, sale/barter/exchange of shares of stocks listed in the stock exchange, and crop insurance, life insurance and foreign insurance agents. Also exempted are overseas dispatch, messages or communication originating from the Philippines, grantees of radio and television broadcasting franchises with annual gross receipts not exceeding P10 million, grantees of electric, gas or water utility franchises, and sale of low cost housing and lease of residential units subject to Rent Control Law.
The VAT applied in the Philippines is a consumption type VAT (i.e., in determining their tax liability, firms are allowed to deduct all business purchases, including purchases of capital goods, from their sales). By not placing an additional burden on purchases of capital equipment, the VAT does not unduly cause firms to delay modernization and the upgrading of plant and equipment; nor does it discriminate against capital-intensive methods of production. At the same time, it minimizes tax cascading from the turnover tax and is thus neutral with respect to production and distribution methods.
As in most countries that have adopted the VAT, the Philippine VAT is levied on the basis of the destination principle (i.e., goods and services are taxed on the basis of where they are consumed, rather than where they are produced). As such, imports and domestically produced goods are treated symmetrically, thereby, allowing them to compete on an equal footing with each other.
The VAT rate is 10% of the gross selling price in the case of sale of taxable goods, or of gross receipts in case of taxable services.1 Exports are zero rated, which means that exports are allowed to receive credit for the VAT paid on their inputs, even as they pay zero output VAT. Thus, in principle, the VAT helps ensure that exports compete on an even playing field with their counterparts in the international market.
Under the VAT system, tax liability is computed using the tax credit or “invoice” method. Firms are entitled to subtract, from the VAT on their sales or output, the VAT on all their purchases, including that of capital goods from the VAT on sales or output. However, credits are allowed only if they were supported by invoices from their suppliers. The VAT is, thus, said to have a self-policing feature as each firm is required to supply evidence regarding taxes that should have been paid by all its suppliers. However, the advantage gained from this feature can be realized only to the extent that the tax administration bureaucracy is equipped with the computerized system to cross match invoices.
1In the case of taxable imports, the tax base is dutiable value plus customs duties and excise
In general, the Philippine VAT is a more revenue-productive tax than the taxes it replaced. This is indicated by the higher tax effort (i.e., ratio of tax revenues to GDP) for VAT/licenses in 1988-2000 (2.3 percent) than tax effort for sales tax/licenses in 1975-1987 (1.6 percent).2 The domestic VAT– to–GNP ratio rose consistently from 1.6 percent in 1988 to 2.8 percent in 1997.3 Following the Asian financial crisis, the VAT effort ratio for domestic sales has faltered to 2.4 percent in 1998/1999 and 2.4 percent in 2000/2002 (Figure 2).
However, problems in the administration of the VAT persist. There is a big gap between the VAT effort in 1988-2000 (2.3 percent) and the statutory rate (10 percent). Moreover, the efficiency ratio (i.e., the ratio of the VAT effort to the statutory VAT rate in the Philippines) is lower than those of Singapore, South Korea and Thailand (Table 1). Tax evasion remains prevalent, with the VAT evasion rate ranging from 51 percent-63 percent in 1992-2000 (Table 2).
Meanwhile, the Interagency Task Force – VAT Subgroup created by the Commissioner of the Bureau of Internal Revenue in the early part of 2001 noted the following problems in the administration of the VAT: excessive claims of current year input VAT credit and carry-over of excess input VAT, claims of presumptive VAT by firms not entitled to do so under the law, and lack of industry standards against which to validate claims of input VAT. Moreover, scrutiny of micro-level data from tax returns shows many firms registering negative effective VAT rate.
2These ratios refer to VAT on domestic sales only.
3Compare these figures with the ratio of sales tax/licenses revenue to GNP of 1.8 percent in
1987.
Figure 1. Ratio of sales/VAT and licenses to GDP, 1986-2001
0.0 0.5 1.0 1.5 2.0 2.5 3.0 1986 1987 1988 1989 1990 1991 1992 1993 1994 1995 1996 1997 1998 1999 2000 2001 Year
Objective and methodology
Given this perspective, the purpose of this study is to develop industry benchmarks for (1) the ratio of VAT-able purchases to VAT-able sales, and (2) the effective VAT rate (i.e., ratio of VAT liability to the value of output) for various industry groupings. Such benchmarks are envisioned to form part of the toolkit in the selection of VAT returns for audit. They are also useful in providing a diagnosis of the sources of the leakages in the VAT system.
To be credible, industry benchmarking requires that each grouping represent a fairly homogeneous set of firms/taxpayers in terms of key characteristics. Since VAT liability is largely dependent on the input-output
Table 1. Statutory VAT rates, sales tax/VAT effort, and efficiency ratio in selected Asian countries, 1991-1998
Sources of basic data: Author’s estimates using revenue data (VAT includes VAT on domestic sales and VAT on imports) from the Government Finance Statistics; GDP data from the International Finance Statistics; statutory rates are from Yoingco 1996.
auses 1997 data
Table 2. Level of tax evasion from VAT, 1992-2000
Year RevenueActual PotentialRevenue RevenueEvaded CollectionRate EvasionRate
1992 1993 1994 1995 1996 1997 1998 1999 2000 18112.85 22750.93 25457.84 29574.48 40926.59 47273.10 47538.83 55150.19 55269.20 30995.58 28569.58 28769.91 34683.34 59793.61 56568.90 51140.56 58380.41 69809.90 49108.43 51320.51 54227.75 64257.82 100720.20 103842.00 198679.39 113530.60 125079.10 36.88 44.33 46.95 46.02 40.63 45.54 48.18 48.58 44.19 63.12 55.67 53.05 53.98 59.37 54.48 51.82 51.42 55.81 Source: Author’s estimate, ratio of marginal firms from NIA estimate of unorganized sector (new)
VAT Effort Efficiency Ratio Statutory VAT Rates 1991 1994 1998 1991 1994 1998 Indonesia Malaysia Philippines Singapore Thailand South Korea 10 0 10 3 7 10 3.92 2.13 2.85 4.05 3.83 4.80 2.17 3.33 1.49 3.15 4.04 2.96 2.08a 3.78 1.56a 4.28 4.30a 0.39 0.29 0.58 0.38 0.48 0.33 0.50 0.45 0.40 0.30 0.38 0.52 0.61 0.43 a
structure of firms, this study makes use of the effective VAT rate for each industry group that is derived from the 230 x 230 transactions table of the 1994 Input-Output (IO) Tables as industry benchmarks. Implicitly, this approach assumes that the cost structure of the various industries has remained invariant over time.
Admittedly the latest available I-O table is rather dated. However, a comparison of the 1988 and 1994 I-O tables indicates that the difference in the ratio of intermediate inputs to total output in the different VAT-able sectors for these years varies from 1 to 20 percent, but is clustered around 5 to 10 percent. This suggests a margin of error of 20 percent at the maximum.
In addition, this study compares the estimates of the effective VAT rate thus derived from the input-output table with data from 1999-2001 VAT returns of VAT-able firms in the Large Taxpayer Unit of the BIR. This exercise revealed large discrepancies in the ratio of VAT-able purchases to VAT-able sales of large VAT-payers and the benchmark value for this ratio that is derived from the I-O table.
It should be noted that, at present, the Bureau of Internal Revenue (BIR) classifies firms according to 38 major sectors only, corresponding largely with 17 major divisions of the Philippine Industrial Classification (PSIC) but with some finer disaggregation of the manufacturing sector. Thus, it was necessary for the present study to reclassify the firms under in the Large Taxpayer Unit in accordance with the PSIC so as to make the industrial groupings in the two data sets consistent and comparable.
Industry benchmarks from the 1994 input-output table
Conceptually, the amount of VAT due is equal to the output VAT less input VAT so that the VAT base is akin to gross value added (GVA) in the VAT-liable sector. In practice, however, some sectors are VAT-exempt. Thus, firms are not allowed to get credit for the taxes on purchased inputs from VAT-exempt sectors because no VAT is paid on the same to begin with. In effect, the tax liability of the VAT-liable firm is equal to 10 percent of its GVA plus the value of its VAT-exempt inputs.
The 230 x 230 Input-Output Tables have 62 VAT-exempt sectors and 168 VAT-liable sectors. Given this, it is important for this nuance to be taken into account in the computation of the effective VAT rate from the input-output table. The list of VAT-exempt sectors in the 230 x 230 I-O Table for the EVAT law is given in Appendix Table 1. On the other hand, the ratio of the value of VAT-able purchases to the value of output as well as the effective tax rate (or the ratio of VAT liability to the value of output) in the various VAT-able sectors in the 230 x 230 I-O TVAT-able are given in TVAT-able 3. It shows that the average ratio of VAT-able purchases to the value of output for all VAT-able
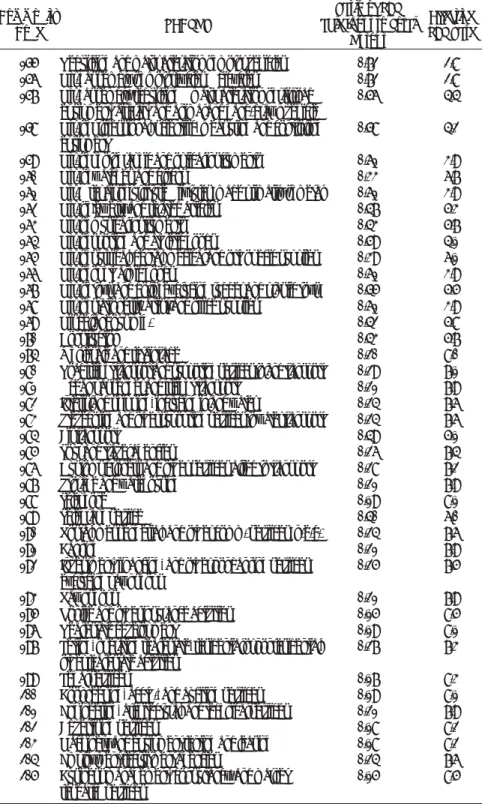
Table 3. Ratio of VAT-able input to total output and effective VAT rate: Industry benchmark based on 1994 I-O table 230 x 230
Effective VAT Rate Ratio of VAT
able Input to Total Output Commodity Code SECTOR 028 029 030 031 032 033 034 035 037 039 040 041 042 043 044 045 047 048 049 051 052 053 054 055 056 057 058 060 061 062 063 064 065 066 067 068 069 070 071 072 073
Gold and silver mining Copper mining Nickel mining Chromite mining Other metal mining Coal mining
Crude petroleum and natural gas Stone quarrying, clay, and sandpits Other nonmetallic mining and quarrying Meat & meat products processing Milk processing
Butter and cheese manufacturing Ice cream, sherbets, and other flavored ices
Other dairy products
Canning and preserving of fruits and vegetables Fish canning
Prod’n. of crude, coconut oil, copra cake, and meal Other crude vegetable oil, excluding coconut oil, fish, and other marine oils and fats
Manufacture of refined coconut and vegetable oil Flour, cassava, and other grains milling Mfr. of bakery prods., excluding noodles Noodles mfg.
Sugar milling and refining
Mfr. of cocoa, chocolate, and sugar confectionery Mfr. of desiccated coconut
Mfr. of ice, excluding dry ice Coffee roasting and processing Mfr. of starch and starch prods.
Mfr. of flavoring extracts, mayonnaise, and food-coloring products
Miscellaneous food products Alcoholic liquors and wine Malt and malt liquors
Soft drinks and carbonated water Cigarette mfg.
Cigar, chewing, and smoking tobacco Tobacco leaf flue-curing and redrying
Textile, spinning, weaving, texturizing, and finishing Fabric knitting mills
Hosiery, underwear, and outerwear knitting Mfr. of made-up textile goods exc. wearing apparel Mfr. of carpets and rugs
0.33 0.32 0.36 0.28 0.24 0.38 0.28 0.29 0.23 0.17 0.73 0.68 0.53 0.50 0.10 0.16 0.14 0.17 0.41 0.17 0.51 0.39 0.13 0.60 0.12 0.09 0.21 0.14 0.42 0.30 0.48 0.30 0.48 0.49 0.39 0.06 0.61 0.62 0.61 0.65 0.63 6.7 6.8 6.4 7.2 7.6 6.2 7.2 7.1 7.7 8.3 2.7 3.2 4.7 5.0 9.0 8.4 8.6 8.3 5.9 8.3 4.9 6.1 8.7 4.0 8.8 9.1 7.9 8.6 5.8 7.0 5.2 7.0 5.2 5.1 6.1 9.4 3.9 3.8 3.9 3.5 3.7
Table 3 Con’t.
Effective VAT Rate Ratio of VAT
able Input to Total Output Commodity Code SECTOR 074 075 076 077 078 079 080 081 082 083 084 085 086 087 088 089 090 091 092 093 094 095 096 097 098 101 102 104 105 106 107 108 109 110 113 114 115 116 117 118 119 120
Cordage, rope, twine, and net mfg. Mfr. of articles made of native materials
Mfr. of artificial leather and impregnated & coated fabrics Mfr. of fiber batting, padding, upholstery fillings including coir, linoleum and other hard floor coverings
Custom tailorings and dressmaking shops Mfr. of ready-made clothing
Embroidery establishments
Mfr. of other wearing apparel, excluding footwear Tanneries and leather finishing
Mfr. of leather products and leather substitutes, excluding footwear and wearing apparel Mfr. of leather footwear & footwear parts Sawmills and planing mills
Mfr. of veneer and plywood Mfr. of hardboard and particle board Wood drying and preserving plants Millwork plants
Mfr. of wooden and cane containers and small cane wares Mfr. of wood carvings
Mfr. of miscellaneous wood, cork, and cane products Mfr. and repair of wooden furniture, including upholstery Mfr. and repair of rattan furniture, including upholstery Mfr. and repair of other furniture and fixture, n.e.c. Pulp, paper, and paperboard
Paper and paperboard containers Mfr. of articles of paper and paperboard
Commercial and job printing, and other allied industries Mfr. of basic, ind’l chemicals
Mfr. of synthetic resins, plastic, materials and other manmade fibers, excluding glass
Mfr. of pesticides, insecticides, etc. Mfr. of paints, varnish, and lacquers Mfr. of drugs and medicines Mfr. of soap and detergents
Mfr. of perfumes, cosmetics, and other toilet preparations Mfr. of misc. chemical products
Rubber tire and tube mfg. Mfr. of rubber footwear
Mfr. of other rubber products, n.e.c.
Mfr. of plastic furniture, plastic footwear, and other fabricated plastic products
Mfr. of pottery, china, and earthenware Mfr. of flat glass
Mfr. of glass container
Mfr. of other glass and glass products
0.21 0.35 0.59 0.38 0.39 0.64 0.51 0.47 0.58 0.62 0.54 0.17 0.20 0.50 0.53 0.53 0.45 0.48 0.34 0.47 0.32 0.60 0.53 0.67 0.66 0.66 0.43 0.51 0.67 0.70 0.55 040 0.54 0.51 0.42 0.52 0.46 0.60 0.35 0.35 0.49 0.56 7.9 6.5 4.1 6.2 6.1 3.6 4.9 5.3 4.2 3.8 4.6 8.3 8.0 5.0 4.7 4.7 5.5 5.2 6.6 5.3 6.8 4.0 4.7 3.3 3.4 3.4 5.7 4.9 3.3 3.0 4.5 6.0 4.6 4.9 5.8 4.8 5.4 4.0 6.5 6.5 5.1 4.4
Table 3 Con’t.
Effective VAT Rate Ratio of VAT
able Input to Total Output Commodity Code SECTOR 121 122 123 124 125 126 127 128 129 130 131 132 133 134 135 136 137 138 139 140 141 142 143 144 145 146 147 148 149 150 151 152 153 154 Cement mfr.
Mfr. of structural clay products Mfr. of structural concrete products
Mfr. of other non-metallic mineral prods, n.e.c. Blast furnace and steel making furnace, steel works, and rolling mills
Iron and steel foundries
Nonferrous smelting and refining plants, rolling, drawing, and extrusion mills
Nonferrous foundries
Cutlery, hand tools, general hardware Structural metal prods
Mfr. of metal containers
Metal stamping, coating, engraving mills Mfr. of wire nails
Mfr. of other fabricated wire & cable prods., excluding insulated wire and cable
Mfr. of non-electric lighting and heating fixtures Mfr. of fabricated metal prods, excluding machinery and equipment
Mfr. of agricultural machinery and equipment Mfr. of metal and wood-working machinery Mfr. of engines and turbines, excluding transport equipment and special ind’l. machinery and equipment Mfr. assembly and repair of office, computing and acctg. machines
Mfr. of pumps, compressors, blowers, and airconditioners Machine shops & mfr. of non-electrical machinery and equipment, n.e.c.
Mfr. of electric ind’l machinery and apparatus
Mfr. of radio and TV receiving sets, sound recording, and reproducing equipment, including records and tapes Mfr. of communication and detection equipment Mfr. of parts and supplies for radio, TV, and communication (semiconductors)
Mfr. of appliances and housewares Mfr. of primary cells and batteries and electric accumulators
Insulated wires and cables
Mfr. of current-carrying wiring devices, conduits and fittings
Mfr. of electrical lamps, fluorescent tubes, and other electrical apparatus and supplies, n.e.c.
Shipyards and boatyards
Mfr. and assembly of motor vehicles Mfr. and assembly of motor vehicles
0.33 0.37 0.66 0.40 0.70 0.68 0.62 0.58 0.48 0.64 0.67 0.66 0.74 0.69 0.61 0.47 0.58 0.52 0.52 0.69 0.51 0.50 0.59 0.72 0.74 0.73 0.63 0.61 0.75 0.63 0.60 0.56 0.83 0.66 6.7 6.3 3.4 6.0 3.0 3.2 3.8 4.2 5.2 3.6 3.3 3.4 2.6 3.1 3.9 5.3 4.2 4.8 4.8 3.1 4.9 5.0 4.1 2.8 2.6 2.7 3.7 3.9 2.5 3.7 4.0 4.4 1.7 3.4
Table 3 Con’t.
Effective VAT Rate Ratio of VAT
able Input to Total Output Commodity Code SECTOR 155 156 157 158 159 160 161 162 163 164 165 166 167 168 169 170 174 180 181 182 183 184 185 186 187 188 189 190 191 192 193 195 196 197 199 200 201 202 203 204 205
Rebuilding and major alteration of motor vehicles Mfr., assembly of motorcycles & bicycles
Mfr., assembly, rebuilding & major alteration of railroad equipment, aircraft, and animal and hand-drawn vehicle Mfr. of professional, scientific, measuring and controlling equipment
Mfr. of photographic and optical instruments Mfr. of watches and clocks
Mfr. & repair of furniture & fixtures, made primarily of metal Mfr. of jewelry and related articles
Mfr. of musical instruments Mfr. of sporting and athletic goods
Mfr. of surgical, dental, medical and orthopedic supplies Mfr. of ophthalmic goods
Mfr. of toys and dolls, excluding rubber and plastic toys Mfr. of stationers’, artist’ and office supplies
Miscellaneous mfg. Construction
Wholesale and retail trade
Road freight transport and supporting services to land transport Ocean passenger and freight transport
Interisland shipping, including inland water
Stevedoring and other supoprting services to water transport Air transport
Tour and travel agencies
Customs brokers and other services allied to transport Storage and warehousing
Telephone Telegraph service
Postal, messengerial, and other comm. services, n.e.c. Banking
Investment, financing, and other nonbanking services, excluding pawnshops
Pawnshops
Nonlife and other insurance activities Real estate development
Letting, operating real estate, residential or nonresidential, other real estate activities
Legal services
Bookkeeping, acctg., and auditing services Engineering, architectural, and technical services Advertising services
Machinery and equipment renting and leasing Employment/recruitment agencies
Business management, consultancy, and market research services 0.72 0.72 0.56 0.58 0.61 0.33 0.61 0.47 0.43 0.59 0.39 0.61 0.45 0.61 0.42 0.43 0.20 0.29 0.21 0.24 0.24 0.49 0.26 0.28 0.21 0.19 0.40 0.24 0.21 0.25 0.21 0.15 0.19 0.27 0.17 0.19 0.21 0.18 0.18 0.24 0.15 2.8 2.8 4.4 4.2 3.9 6.7 3.9 5.3 5.7 4.1 6.1 3.9 5.5 3.9 5.8 5.7 8.0 7.1 7.9 7.6 7.6 5.1 7.4 7.2 7.9 8.1 6.0 7.6 7.9 7.5 7.9 8.5 8.1 7.3 8.3 8.1 7.9 8.2 8.2 7.6 8.5
sectors is 0.383, varying from a low of 0.063 for tobacco leaf flue-curing and redrying (I-O sector 68) to a high of 0.830 for manufacture and assembly of motor vehicles (I-O sector 153). In turn, the mean effective VAT rate for all VAT-able sectors is 6.2 percent, ranging from a low of 1.7 percent for the latter to a high of 8.7 percent for the former.
Validation with VAT data from large taxpayer unit
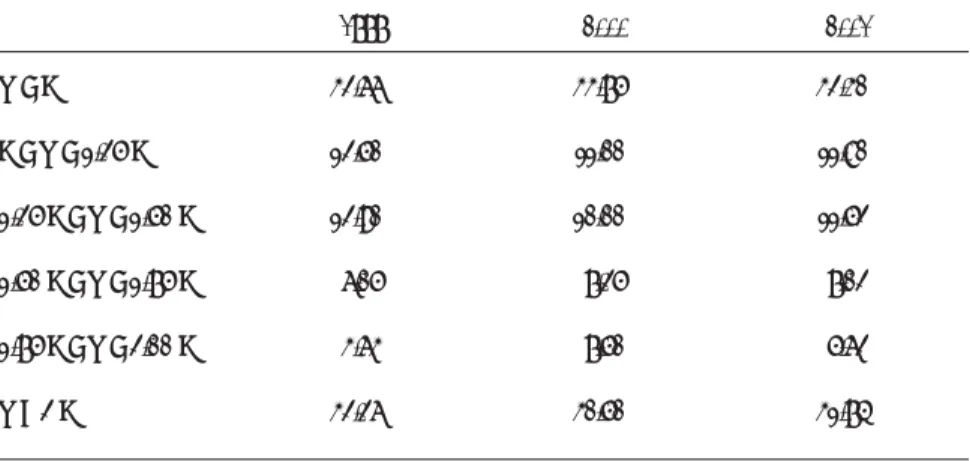
Closer scrutiny of the data from VAT returns of firms included in the Large Taxpayer Unit of the BIR for the years 1999-2001 and a comparison of the key ratios derived from there with the corresponding ratios based on the I-O Table underscore the importance of using independent source of information for deriving industry benchmarks for VAT administration. It also highlights the sources of the leakage in the collection of the VAT. First, while VAT-able purchases of these large firms are less than their total output in the current year in the aggregate, there is some evidence that firms do claim excessive input VAT credits. The average ratio of the value of VAT-able purchases to VAT-able sales for all of these firms was consistently higher than that derived from the I-O Table: 52 percent in 1999, 48 percent in 2000 and 47 percent in 2001 compared to 38 percent from the I-O Table (Table 4).
Table 3 Con’t.
Effective VAT Rate Ratio of VAT
able Input to Total Output Commodity Code SECTOR 206 207 208 212 214 216 217 218 219 220 221 222 223 224 225 226
Detective and protective services Other business services, n.e.c. Sanitary and similar services
Other social and related community services Motion picture distribution and projection Theatrical production and entertainment Other recreational and cultural services Repair shops for motor vehicles Other repair shops, n.e.c.
Laundry, dry cleaning, and dyeing plants Barber and beauty shops
Photographic studios, including commercial photography and related services
Other personal services, n.e.c.
Restaurants, cafes, and other eating and drinking places Hotels and motels
Other lodging places
0.22 0.19 0.31 0.24 0.13 0.28 0.25 0.35 0.29 0.32 0.24 0.36 0.25 0.29 0.33 0.16 0.38 7.8 8.1 6.9 7.6 8.7 7.2 7.5 6.5 7.1 6.8 7.6 6.4 7.5 7.1 6.7 8.4 6.2 Average for all VAT-able sectors
Table 4. Selected indicators from VAT returns of large taxpayers, all sectors, 1999-2001
1999 2000 2001 All Sectors
(In percent)
Zero-Rated Sales/Total Sales Exempt Sales/Total Sales Output Tax/Total Sales
VAT-able Purchases/VAT-able Sales
Presumptive Input Tax/Total Available Input Tax (w/carry over) Domestic Input Tax/Total Available Input (w/carry over) Imported Input Tax/Total Available Input Tax (w/carry over) Domestic Purchases/Total Purchases
Importation of Goods/Total Purchases
Total Available Input Tax/Output Tax (w/carry over) VAT Due/Taxable Sales (based on AIT, w/carry over) VAT Due/Taxable Sales (based on AIT, w/o carry over)
VAT Due/Taxable Sales (w/carry over)** VAT Due/Taxable Sales (w/o carry over)** Output Tax/Taxable Sales
(In million pesos)a
Total Negative VAT Due** (with carryover) Total Positive VAT Due** (with carryover) VAT Due**
Total Excess Input Tax Carried Over from the Previous Period 26.82 2.96 8.57 52.01 2.76 70.75 20.49 79.31 20.69 82.40 2.15 2.75 2.84 3.44 12.20 (3,828.02) 5,070.65) 11,242.63) 2,387.56) 26.17 4.59 7.33 47.56 0.05 63.73 21.54 73.71 26.29 4.32 0.60 2.07 0.60 2.07 10.60 (13,148.61) 17,438.11) 4,289.50) 10,440.48) 26.54 3.72 7.53 46.93 2.17 52.94 22.49 69.42 30.58 101.04 -0.11 2.33 0.20 2.64 10.79 (12,858.16) 13,951.27) 1,093.11) 13,397.47) aEntries in the four rows at the bottom of the table are not directly comparable because some firms have
missing data for some quarters of 199. Note:
*Vat Due = Output Tax - AIT (Available Input Tax)
** Vat Due = Ouput Tax - Net Creditable Tax (w/adjustment for refund, actual) Net Creditable Tax - AIT-Vat Refund-Excess Tax carried
Moreover, the ratio of the value of total purchases to total sales for these large VAT payers exceed the I-O based benchmarks in 66 to 68 percent of the cases (Table 5). In addition, some 42 to 44 percent of these firms exceed the benchmark by at least 50 percent. In particular, the ratio of VAT-able purchases to total output of the large firms in the following I-O sectors are more than twice as high as the corresponding I-O benchmark: canning and preserving of fruits, fish canning, sugar milling and refining, miscellaneous food manufacturing, cigarette manufacturing, manufacture of basic industrial
chemicals, cement manufacturing, wholesale and retail trade, telephone, postal, and messengerial and other communication services (Table 6).
However, because it is not possible to distinguish purchases of capital equipment and plants from purchases of intermediate inputs on the basis of the information from the VAT return, data from the VAT returns would tend to show a higher ratio of VAT-able purchases to VAT-able output compared to what might be expected from the I-O table. Thus, if the I-O cost structure is used to establish industry benchmarks, the first order of business would be to check whether firms which exhibit a higher ratio of VAT-able purchases to total output did, in fact, make investments in physical capital during the period under consideration.
Second, closer examination of the firm level data show that some 30-35 large VAT-payers generated excess input VAT credits in the current year (i.e., input VAT credit for purchases in the current year is in excess of taxable sales) in 1999-2001. Specifically, the VAT-able purchases of 12.7 percent of the firms under study in 1999, 7.5 percent in 2000, and 8.4 percent in 2001 were larger than their taxable sales. The excess input tax credit generated in the current year from this source amounted to P1.8 billion (4.5 percent of the output VAT) in 1999, P3.7 billion (5.2 percent of the output VAT) in 2000 and P4.6 billion (8.4 percent of the output VAT) in 2001. In 2001, these firms may be found in the following I-O sectors: sugar milling and refining, cigarette manufacturing, manufacture and repair of wooden furniture, manufacture of articles of paper and paperboard, manufacture of structural concrete products, manufacture of communication and detection equipment, telephone, telegraph, and investment, financing and other nonbanking institutions.
Table 5. Comparison of the ratio of VAT-able purchases to total sales of large VAT payers (R) with I-O benchmark (B), (percent of total number of large VAT payers) 1999 2000 2001 R < B B < R < 1.25 B 1.25 B < R < 1.50 B 1.50 B < R < 1.75 B 1.75 B < R < 2.00 B R > 2 B 32.66 12.50 12.90 6.05 3.63 32.26 33.75 11.00 10.00 7.25 7.50 30.50 32.30 11.80 11.52 7.02 5.62 31.74
Ta
ble 6. Ratio of V
AT
-able purchases to total output: Comparison of data from large taxpayers unit and I-O table
I-O Code
I-O Classification
026 034 039 040 041 044 045 047 051 052 053 054 055 058 059 061 062 065 AVERAGE Aquaculture and other fishery activities Crude petroleum and natural gas Meat and meat products processing Milk processing Butter and cheese manufacturing Canning and preserving of fruits and vegetables Fish canning Production of crude coconut oil, copra, cake, and meal Flour
, cassava, and other grain milling
Mfr
. of bakery prods except noodles
Noodles manufacturing Sugar milling and refining Mfr. of cocoa, chocolate, and sugar confectionery Coffee roasting and processing Manufacture of animal feeds Mfr. of flavoring extracts, mayonnaise, and food-coloring products Miscellaneous food products Soft drinks and carbonated water 1.26 0.68 0.00 2.71 0.57 1.12 3.05 4.64 0.73 0.69 1.26 1.10 8.92 0.89 0.00 0.91 1.20 2.34 1.18 1.24 5.84 0.00 2.93 0.79 0.82 4.17 4.67 2.53 0.62 1.29 1.55 16.94 1.10 0.00 0.58 1.21 2.49 1.57 1.37 25.13 0.00 2.07 0.91 0.79 2.56 3.72 0.00 0.93 1.05 0.00 9.39 0.69 0.00 0.61 0.00 2.59 1.78 0.38 0.06 0.28 0.17 0.73 0.68 0.10 0.16 0.14 0.17 0.51 0.39 0.13 0.60 0.21 0.14 0.42 0.30 0.48 0.48 0.04 0.00 0.47 0.42 0.77 0.31 0.76 0.10 0.12 0.64 0.43 1.20 0.54 0.00 0.12 0.50 0.69 0.56 0.47 0.34 0.00 0.51 0.57 0.56 0.42 0.77 0.35 10.1 0.66 0.60 2.28 0.66 0.00 0.08 0.50 0.74 0.75 0.52 1.46 0.00 0.36 0.67 0.54 0.26 0.61 0.00 0.16 0.54 0.00 1.26 0.41 0.00 0.08 0.00 0.77 0.85 VA T-able Purchases/V AT -able Sales 1999 (1) 2000 2001 (2) (3) VA
T-able Input/ Total Output Based on I-O
(1)/(2)
1999
2000
Table 6 Con’t.
I-O Code
I-O Classification
066 068 070 072 079 081 093 096 097 098 099 100 101 102 103 104 105 107 108
Cigarette manufacturing Tobacco leaf flue-curing and redrying Fabric knitting mills Mfr. of made-up textile goods except wearing apparel Mfr. of readymade clothing Mfr. of other wearing apparel except footwear Mfr. and repair of wooden furniture, including upholstery Pulp, paper
, and paperboard
Paper and paperboard containers Mfr. of articles of paper and paperboard Newspapers and periodicals Printing and publishing of books and pamphlets Commercial and job printing and other allied industries Mfr
. of basic, including chemicals
Mfr
. of fertilizers
Mfr
. of synthetic resins, plastic materials, and other manmade fibers except glass
Mfr
. of pesticides, insecticides, etc.
Mfr
. of drugs and medicines
Mfr
. of soap and detergents
2.01 0.00 1.02 1.31 1.27 1.93 1.92 1.08 0.78 1.09 1.24 1.46 0.72 4.46 2.08 1.17 0.00 1.16 1.61 2.07 0.00 1.53 1.28 1.06 1.88 5.51 1.41 1.27 1.69 1.11 0.88 0.69 1.18 0.82 0.88 1.11 1.68 1.59 1.97 0.00 0.90 1.38 0.00 1.95 0.00 1.22 0.87 0.77 0.84 1.50 0.00 6.66 0.00 1.36 1.09 1.22 1.82 0.49 0.06 0.62 0.65 0.64 0.47 0.47 0.53 0.67 0.66 0.64 0.55 0.66 0.43 0.61 0.51 0.67 0.55 0.40 0.99 0.00 0.63 0.85 0.82 0.91 0.91 0.57 0.52 0.71 0.79 0.80 0.48 1.93 1.26 0.60 0.64 0.64 1.02 0.00 0.94 0.83 0.68 0.88 2.62 0.74 0.86 11.1 0.71 0.48 0.46 0.51 0.50 0.45 0.75 0.92 0.63 0.97 0.00 0.55 0.90 0.00 0.92 0.00 0.64 0.58 0.51 0.53 0.83 2.88 0.00 0.70 0.73 0.67 0.72 VA T-able Purchases/V AT -able Sales 1999 (1) 2000 2001 (2) (3) VA
T-able Input/ Total Output Based on I-O
(1)/(2)
1999
2000
Table 6 Con’t.
I-O Code
I-O Classification
109 110 111 113 114 116 117 118 119 121 122 123 125 126 128 129 130 134
Mfr
. of perfumes, cosmetics, and other toilet preparations
Mfr
. of miscellaneous chemical products
Petroleum refineries Rubber tire and tube manufacturing Mfr. of rubber footwear Mfr. of plastic furniture, plastic footwear
, and other fabricated plastic
products Mfr. of pottery , china earthenware Mfr . of flat glass Mfr . of glass containers
Cement manufacturing Mfr. of structural clay products Mfr. of structural concrete prods Blast furnace and steel-making furnace, steel works, and rolling mills Iron and steel foundries Nonferrous foundries Cutlery
, hand tools, general hardware
Structural metal products Mfr. of other fabricated wire cable products, excluding insulated wire cable 1.30 1.34 0.00 1.10 1.50 1.46 0.96 1.40 0.79 28.22 1.85 1.02 -0.47 0.48 0.00 1.42 0.70 0.00 1.32 1.17 0.00 1.16 1.02 1.35 1.57 1.74 0.76 0.61 1.84 1.70 0.80 0.25 0.00 1.30 0.50 0.00 1.29 0.94 0.00 1.66 1.49 1.18 0.00 1.07 0.68 5.30 1.91 0.00 0.92 0.34 0.00 1.57 1.37 0.00 0.54 0.51 0.64 0.42 0.52 0.60 0.35 0.35 0.49 0.33 0.37 0.66 0.68 0.62 0.58 0.48 0.64 0.69 0.70 0.69 0.00 0.46 0.78 0.88 0.34 0.50 0.39 9.26 0.69 0.67 -0.32 0.30 0.00 0.68 0.45 0.00 0.71 060 0.00 0.49 0.53 0.81 0.55 0.62 0.37 0.20 0.68 1.11 0.54 0.16 0.00 0.62 0.32 0.00 0.69 0.48 0.00 0.70 0.78 0.71 0.00 0.38 0.33 1.74 0.71 0.00 0.63 0.21 0.00 0.75 0.88 0.00 VA T-able Purchases/V AT -able Sales 1999 (1) 2000 2001 (2) (3) VA
T-able Input/ Total Output Based on I-O
(1)/(2)
1999
2000
Table 6 Con’t.
I-O Code
I-O Classification
142 143 144 145 146 147 148 149 151 153 155 156
Machine shops and mfr
. of nonelectrical machinery and equipment,
n.e.c. Mfr. of electrical industrial machinery and apparatus Mfr. of radio and
TV receiving sets sound recording and reproducing
equipment, including records and tapes Mfr. of communication and detection equipment Mfr. of parts and supplies for radio
TV and communication
(semiconductors) Mfr. of appliances and housewares Mfr. of primary cells and batteries and electric accumulators Insulated wires and cables Mfr. of electrical lamps, fluorescent tubes, and other electrical apparatus and supplies, n.e.c. Mfr
. and assembly of motor vehicles
Mfr
. of motor vehicles parts and accessories
Mfr
. and assembly of motorcycles and bicycles
0.07 0.95 0.75 0.72 0.22 1.26 1.16 0.71 0.67 0.87 1.08 1.08 0.13 0.57 0.79 2.17 0.62 1.08 1.15 0.11 0.89 1.06 0.99 0.85 0.00 0.36 0.68 0.54 0.17 1.22 1.11 0.08 0.65 0.75 1.17 0.90 0.50 0.59 0.72 0.74 0.73 0.63 0.61 0.75 0.60 0.83 0.72 0.72 0.03 0.56 0.54 0.54 0.16 0.79 0.71 0.53 0.40 0.72 0.78 0.78 0.06 0.33 0.57 1.61 0.45 0.68 0.70 0.08 0.53 0.88 0.72 0.62 0.00 021 0.49 0.40 0.12 0.77 0.68 0.06 0.39 0.62 0.84 0.65 VA T-able Purchases/V AT -able Sales 1999 (1) 2000 2001 (2) (3) VA
T-able Input/ Total Output Based on I-O
(1)/(2)
1999
2000
Table 6 Con’t. I-O Code I-O Classification 157 158 169 170 171 172 173 174 175 176 180 181 183 184 186 188 189 197 Mfr . assembly
, rebuilding and major alteration of railroad equipment,
aircraft, and animal and hand-drawn vehicle Mfr. of professional, scientific, measuring, and controlling equipment Miscellaneous mfg. Construction Electricity Gas Water Wholesale trade and retail trade Railway transport services Bus operators Road freight transport-supporting services to land transport Ocean passenger and freight transport Stevedoring and other supporting services Air transport Customs brokers and other services allied to transport Telephone Telegraph service Letting, operating real estate, residential or nonresidential; other real estate activities 0.21 1.59 1.29 0.95 0.81 3.50 0.00 3.71 0.00 0.00 2.57 2.04 0.00 2.66 0.91 3.89 4.36 2.12 0.23 1.25 0.96 1.67 1.87 1.24 0.00 3.54 8.43 0.00 0.00 1.71 0.00 0.91 1.62 5.46 3.63 2.07 0.14 1.08 2.30 1.24 1.36 1.09 0.00 3.56 0.00 0.00 10.07 1.42 0.00 0.43 1.37 2.30 2.59 2.00 0.56 0.58 0.42 0.43 0.11 0.08 0.14 0.20 0.27 0.35 0.29 0.21 0.24 0.49 0.28 0.19 0.40 0.27 0.12 0.92 0.54 0.41 0.09 0.28 0.00 0.76 0.00 0.00 0.75 0.42 0.00 1.29 0.25 0.72 1.77 0.57 0.13 0.72 0.40 0.72 0.21 0.10 0.00 0.72 2.25 0.00 0.00 0.35 0.00 0.44 0.45 1.01 1.47 0.55 0.08 0.63 0.96 0.53 0.15 0.09 0.00 0.73 0.00 0.00 2.95 0.29 0.00 0.21 0.38 0.43 1.05 0.53 VA T-able Purchases/V AT -able Sales 1999 (1) 2000 2001 (2) (3) VA
T-able Input/ Total Output Based on I-O
(1)/(2)
1999
2000
Table 6 Con’t.
I-O Code
I-O Classification
199 200 201 202 203 204 205 207 209 210 212 213 214 215 217 222 224 225 229
Legal services Bookkeeping, acctg. and auditing services Engineering, architectural technical services Advertising services Machinery and equipment renting and leasing Employment/recruitment agencies Business management and accountancy and marketing research services Other business services Private education services Private hospitals, sanitaria, similar institutions Other social and related community services Motion picture production Motion picture distribution and projection Radio and TV programming Other recreational and cultural services Photographic studios including commercial photography and related services Restaurants, cafes, and other eating and drinking places Hotels and motels Public administration and defense 0.00 0.00 17.47 0.84 3.91 1.49 2.34 2.62 0.00 1.41 1.51 0.47 7.09 1.49 0.00 2.74 2.03 0.79 0.00 0.00 0.00 3.80 0.89 2.92 0.91 2.64 3.15 0.93 12.1 11.94 0.58 5.19 1.68 1.25 2.28 2.02 0.89 0.00 0.00 0.00 2.14 0.96 3.66 0.04 1.63 0.00 0.00 2.30 0.00 0.42 8.19 1.54 0.00 2.42 2.23 0.87 0.00 0.17 0.19 0.21 0.18 0.18 0.24 0.15 0.19 0.21 0.40 0.24 0.35 0.13 0.13 0.25 0.36 0.29 0.33 0.27 0.00 0.00 3.63 0.15 0.72 0.36 0.36 0.49 0.00 0.56 0.35 0.16 0.93 0.19 0.00 1.00 0.58 0.26 0.00 0.00 0.00 0.79 0.16 0.54 0.22 0.40 0.59 0.20 0.84 2.81 0.20 0.68 0.22 0.32 0.83 0.58 0.30 0.00 0.00 0.00 0.44 0.17 0.67 0.01 0.25 0.00 0.00 0.91 0.00 0.15 1.07 0.20 0.00 0.88 0.64 0.29 0.00 VA T-able Purchases/V AT -able Sales 1999 (1) 2000 2001 (2) (3) VA
T-able Input/ Total Output Based on I-O
(1)/(2)
1999
2000
Moreover, it appears that many of the firms whose total VAT-able purchases were in excess of their total output in 1999-2001 are quite persistent in exhibiting this characteristic. Thus, 23 out of 373 firms (or 6 percent) of the large firms for which there is data for at least 2 years were generating excess input tax credits in 2 or more years out of 2-3 years. While it is possible that firms which are expanding (i.e., investing in new plant and capital equipment) will have VAT-able purchases that are in larger than their total output in the capital year, not many firms would be in such an expansionary mode over several years. Thus, such an occurrence should trigger an audit. Third, actual VAT due from VAT-able firms is further reduced by the availability of excess input tax carried over (ITCO) from one period to the next. Thus, the ratio of available input tax to output tax was 0.8240 in 1999, 0.9432 in 2000 and 1.0104 in 2001 and is significantly higher than the ratio of VAT-able purchases to VAT-able sales (Table 4).4 This result is primarily due to the large excess ITCO in each of these years. Note that the presumptive input tax accounted for less than 3 percent of the available input VAT in 1999-2001 while the share of the excess ITCO to the available input VAT was 6 percent in 1999, 15 percent in 2000 and 23 percent in 2001.
Consequently, the average effective VAT rate applicable to large firms is extremely low: 2.8 percent in 1999, 0.6 percent in 2000 and 0.2 percent in 2001 (Table 4) compared to a an effective VAT rate of 6.2 percent in the aggregate based on the I-O table. However, this dismal performance is masked by the carry- over of negative VAT due from the current year to the succeeding year.
Conclusion
Various indicators (e.g., VAT-to-GDP ratio and VAT evasion rate) suggest that problems in VAT administration have not only persisted during the 1990s but also appear to have worsened. The large discrepancy in the ratio of value of VAT-able purchases to VAT-able sales of large VAT-payers to the benchmark value for this ratio that is derived from the I-O table tends to show that excessive claims for VAT credit for input VAT is a major source of the leakage in VAT collection.
While the VAT-able purchases of the firms under the Large Taxpayer Unit of the BIR are less than their total output, in the aggregate, in the current year, it appears that many of these firms do claim excessive input VAT credits. Thus, the ratio of the value of total purchases to total sales is higher than the corresponding I-O based benchmark in some 68 percent of large
4The available input tax is equal to the sum of VAT-able purchases, the presumptive tax, and
VAT-payers. Moreover, some 42 to 45 percent of these firms exceed benchmark by at least 50 percent while some 31 to 32 percent exceed benchmark by at least 100%. In this regard, the use of industry benchmarking to automatically trigger audit would help reduce the leakage in VAT collection. To start with, the audit should focus on industries/sectors whose ratio of VAT-able purchases to taxable sales exhibit the greatest variance relative the I-O benchmark. Such a targeting mechanism should help maximize the use of time of tax examiners in the Large Taxpayer Unit.
In addition, the large overhang of excess input tax credit that is carried over from one year to the next (amounting to P13 billion in 2001) suggests the need for a good monitoring system as lapses in tracking the utilization of said tax credits could be a another source of leakage in the system.
Finally, it should be stressed that, for industry benchmarking to be credible, each grouping represent a fairly homogeneous set of firms/ taxpayers in terms of key characteristics. In this regard, the 38 major sectors currently being used by the BIR in classifying firms appears to be inadequate. Prospectively, the BIR should move towards a finer level of classification approaching at the minimum the I-O level of disaggregation.