http://www.ejournalofbusiness.org
Identifying Financial Distress Firms: A Case Study of Malaysia’s
Government Linked Companies (GLC)
1
Ahmad Khaliq, 2 Basheer Hussein Motawe Altarturi, 3 Hassanudin Mohd Thas Thaker,
4
Md Yousuf Harun, 5 Nurun Nahar
1 MSc. Finance, International Islamic University Malaysia (IIUM), Academic Trainee (IIUM). Correspondence author: 2 MSc. Finance, International Islamic University Malaysia (IIUM)
3 MSc. Finance, International Islamic University Malaysia (IIUM), Lecturer, Department of Accounting and Finance, Faculty of Business, Economics and Accounting, HELP University.
4 MSc. Finance, International Islamic University, Malaysia (IIUM), Former Investment Analyst at IDLC Investments Ltd in Bangladesh 5 MSc. Finance, International Islamic University Malaysia (IIUM), Former Operation Assistant at Dhaka Bank Limited, Bangladesh
ABSTRACT
The unhealthy financial state can be a massive and can cause long term distress which can result to restrictions of investments activities, capital flows and performance of firms. Thus it is vital for organizations to identify the reasoning that may lead to a corporate failure and take measures accordingly to refrain from such condition. Thus, this present study addresses the financial distress measurement among 30 GLC’s listed companies in Bursa Malaysia over the period of five years (2008 until 2012). This paper asses the financial distress determinant measured by Z score statistics model. Further on, determinant such as current ratio and debt ratio were identified. Results show that there is significant relationship between both variables and Z – Scores that determine financial distressed of the GLC.
Keywords:Financial Distress, GLC, Z score
1.
INTRODUCTION
Financial distress is the situation when a company cannot meet or face difficulty to pay off its financial obligations to the creditors. The chances of causing financial distress increases when a firm’s fixed costs are high, assets are illiquid, or revenues that are too sensitive to economic recessions. A company which is in financial distress can experience costs linked to the situation, such as more exclusive financing, opportunity costs of projects and less dynamic employees. The cost of borrowing additional capital of the firm will generally increase, increasing the much desired funds to make it extra challenging and costly. To fulfill short-term obligations, management might run the longer-term profitable projects. The employees of a financial distressed firm usually have lower confidence and higher stress because of increasing the chance of bankruptcy, for which they will be out of their jobs. Under such a burden, the workers can be less productive.
Moreover, when a company is deemed to be under financial distress and does not take necessary actions in improving its performance or when the situation is not handled well, the company may experience bankruptcy or be forced into liquidating its company in the worst case scenario. In addition to that financial distressed may brings bad reputation for the company because investors would see the company as an incompetent firm. Due to this, the company may face a disaster whereby will experience a dramatic drop in its
market value of equity as investors will shun away from buying the company’s share and if there is no action are taken, the ownership of the company itself as its weak condition calls out potential buyers to place their names on the company.
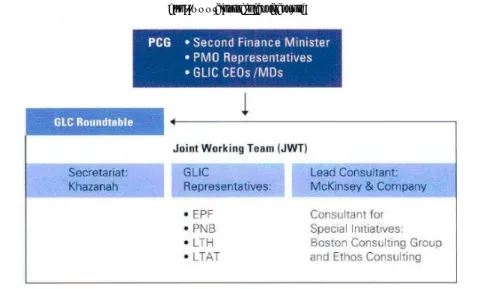
The study analyzes on the financial health of Malaysian GLCs and investigates the relationship between the current ratio and debt ratio to Altman Z score statistics. In Malaysia, corporation with commercial objective plus of which government having direct stake control in it are define as GLCs. Government have the ability to commence alteration in the corporation, or also known as controlling stake are applied upon appointment of board members, senior managers and other major decision such as contract awards, restructuring and financing for GLCs directly or either through the involvement of Government Linked Investment Companies (GLICs). Under the management of Putrajaya Committee for GLC High Performance (PCG) formed in January 2005, it comprises of MOF II, representative from PMO, GLICs chief executive officers or managing directors, Malaysian government directly controls them through Khazanah, Ministry Of Finance, KWSP and other Federal Government linked agencies (Abdullah, 2007). Figure below shows the structure of Putrajaya Committee on GLC (PCG). From here we may see that all these companies report to second finance minister regarding their operation, management, and other business related activities (Putrajaya Committee, 2010):
http://www.ejournalofbusiness.org
Fig 1: The structure of Putrajaya Committee on GLC (PCG)
There are several issues with regard to the current development of GLCs. Between the year 1997 and 1998 a lot of major economies were affected gravely including Indonesia, Korea, Thailand and Malaysia. Although different countries had different causes, the crisis struck them concurrently significantly affecting their economies and financial markets.
The crisis in Malaysia was triggered by a private corporate debt of companies listed in the Bursa Malaysia,
Malaysian’s Stock Exchange, that caused distress in the banking and financial sector. Many companies at the time failed to meet their obligations to repay their loans. In the mid-1997, the Central bank of Malaysia declared that it could no longer defend the Ringgit. Consequently, the value of the Ringgit devaluated to almost 50% over a period of six month span until December 1997 (Approx.). This was accompanied by the decline in the stock market which fell to almost 54% during the period. A number of Malaysian companies, hence, had to go through a structuring process after the Asian financial crisis of the 1997.
This paper is meant to report the main focus on financial distress in 30 GLC’s companies from various sectors in Malaysia. A comparative analysis on how capable the firms are to manage their long term and short term financial obligations. Studies made by Tam and Kiang (1992) have reasoned that the most important factor in the decision making process is the prediction of any probable financial distress. The financial statement on the contrary does not contact sufficient data that can be used as a judicious factor determining the probability of a failure in case of large organizations. The failures contribute to extended expenses from the associated companies, general investors and the national economy (Ahn et al., 2000). On the other hand, analytical studies are almost lacking in the case of Malaysian companies. Thus, this is the main reasons why we have intended to do this research by employing Altman Z-score and financial ratio to measure the financial distress.
Moreover, the idea to conduct this research was initiated by recent sub - prime which was happened in 2006 – 2007. As all of us aware, this crisis has terribly impacted many of sectors in the industry. Some company went bankruptcy, unable to pay back debt, declared insolvent and so on. Therefore, in this study, we analyze the current financial position of the GLC’s companies in Malaysia after the crisis.
To achieve the purpose of this study, the main research objectives are:
To examine the differences between the financial ratios, (Current ratio and Debt ratio) and Altman's Z score 1968 in determining the financial situation.
To determine whether all 30 GLC’s Companies listed in Kuala Lumpur Stock Exchange are financial failure Companies.
To determine the situation of financial performance of companies those are listed in the GLC’s companies listed on Kuala Lumpur Stock Exchange.
2.
LITERATURE REVIEW
As we know that, prediction of corporate financial distress and bankruptcy has long been a great interest of research initiating in the late 1960s. Broadly speaking, in order to identify distressed or bankruptcy, financial analyst and investors or to measure uses financial ratios to evaluate it. These ratios include profitability, liquidity and solvency, as well as the efficiency of management in the design and implementation of funding policies and investment (Mohammed, 1997). Financial ratio can illustrate the past, present and future performance of firm financial position and it is a very useful indicators. Most of the financial ratio can be calculated from financial statement. According to the Mohammad et al., (2009) the importance of using financial ratios in financial analysis and its role and its importance in the performance of
http://www.ejournalofbusiness.org
evaluation of companies and also in calculating the financial failure of companies through the practical application of a number of companies as well as use the graph to display the results, in order to avoid failure and face global financial crisis. The researchers found significant results, including convergence of results between the value of the financial performance of companies and the value of financial failure of companies, and the possibility of the use and presentation of results in the financial markets, to take advantage of them (Mahmood et al., 2009).
In our study, we are going to concentrate on liquidity ratio and long term debt paying ability. Liquidity ratios are used to assess the status of credit facility. They usually reflect the extent of their ability and meet their obligations in the short term that are optimized. Current ratio is a financial liquidity indicator that measures whether or not a firm has enough resources to pay its debts over the next 12 months, and it compares a firm's current assets to its current liabilities. In order to lessen risk consumption, short term creditors prefer high current ratio.
In contrast, lower current ratios which can further utilize firm’s assets to grow the business are preferable to shareholders. Of course, the values for the current ratio will vary between firms and in industry. For instance, cyclical industries firms may prefer to maintain higher current ratio in order to remain solvent during downturns as Current Assets/ Current Liabilities (Ali, 2008; Mahmood et al., 2009).
Leverage ratio for a firm is meant to measure the status of company in meeting its financial obligations. Debt ratio is defined as ratio of total debt over its total assets which can also be interpreted as the proportion of a company’s assets that are financed by debt. The higher the ratio, simply mean the company is highly leveraged and posses high financial risk. A company indulges to capital-intensive business such as utilities and pipelines usually possess higher debt ratios in compare to companies venturing in technology industries.
By looking at the literature review, the first footstep in the advancement of the quantitative firm failure prediction model was taken by Beaver (1966), who established a dichotomous classification assessment grounded on a simple t-test in a univariate context. Using 79 companies (failed and non-failed) financial ratios that were harmonized by industry and assets size in 1954 to 1964 and revealed a particular financial ratio; Cash flow/Total Debt as the best predictor of corporate bankruptcy.
Beaver’s study was then followed by Altman (1968), who used a Multivariate Discriminant Analysis (MDA). He used 66 companies, among them 33 were bankrupt companies and the other 33 were non-bankrupt companies over the period 1946 – 1964 and identified five variables were most pertinent in calculating
bankruptcy. The variables were: Working Capital to Total Assets, Retained Earnings to Total Assets, Earnings before Interest and Taxes to Total Assets, Market Value of Equity to Book Value of Total Debt and Sales to Total Assets. However, Ohlson (1980) and Jones (1987) mentioned some shortfalls in MDA with respect to the norms of normality and group dispersion. They stated the above assumptions were often underrated in MDA model which might lead to biased result. Ohlson (1980), made the Logit analysis model popular among the researchers for measuring the financial distress issue. Using data of 105 bankrupt and 2058 non-bankrupt companies from the time he found that size, current liquidity, performance and financial structure (Total Liabilities to Total Assets) were the most vital elements of bankruptcy.
In another study, Abdullah et al. (2008) did a comparative analysis of the three methodologies (MDA, logistic regression and hazard model) of tracking financially distressed companies in Malaysia. They used a sample of 52 distressed and non-distressed firms with a holdout sample of 20 companies and found that the estimates of hazard model were the most accurate among the 3 methods (94.9% accuracy). But interestingly when the holdout sample has been taken into consideration the MDA came to be the most accurate i.e. 85% accuracy in
estimating financial distress. However, similar study has been conducted earlier by Low et al. (2001), Mohamed &
Sanda (2001).
By looking at the empirical the study by Theodossiou et al. (1996) also conducted research on
different factors like company's profitability, its size, financial leverage, growth and managerial effectiveness and results shows these factors are highly involved in financial distress. Closer study conducted by (Zulkarnain, 2009) to assess corporate financial distress on Malaysian economy using Altman's Z-score model. The results showed that only 5 companies out of 64 fell in distress area and model was very significant in discriminating distress and non-distress companies.
For example in Malaysia, Steven et al. (2011)
carried out a study using the Z-score method to determine performance of companies after facing an environment of financial stress. The study determines the reasons for the downfalls and recommends that an effective restructuring plan must be enforced focusing on all issues that caused the downfall of the firm along with introducing new ideas to drive the company to newer heights. On the other hand, Study on determining relationship between financial distress and financial performance during financial crisis by (Tan, 2012) was carried out and the results reaffirm that firms having low level of leverage tend to perform better than those highly leveraged. Additionally, the crisis augments the negative relationship between financial distress and financial performance which merely indicate that high leverage firm experience worse performance during the crisis. The result was consistent in (Andrade & Kaplan, 1998).
http://www.ejournalofbusiness.org
Moreover, by applying financial ratios, Malik (2013) assess on determinants of financial distress of non-financial companies of Karachi Stock exchange from 2003-2010 using Z-score model. Determinants like current ratio, profitability efficiency, solvency and leverage were identified. The results indicate that current ratio, profitability, solvency and leverage are negatively correlated while efficiency is positively correlated. This simply point out that consumption of high level of gearing will contribute to greater efficiency if the optimal level is not convene.
On the other hand, interesting question was raised by Kaveri (1980) whereby he has addresses the question: could a few ratios be empirically selected to indicate improvement or deterioration in its financial health of a borrowing company? By employing MDA model to analyze 22 financial ratios of a sample of 520 small industrial firms in India. Kaveri reports five ratios as being significant in discriminating between the three categories of firms. The ratios are: (i) Current ratio; (ii) stock/cost of goods sold; (iii) current assets/ net sales; (iv) net profit over total capital employed; and (v) net worth/ total outside liabilities. These five ratio categories: working capital, turnover, assets usage, profitability and financial stability. Kaveri’s model had a lower accuracy rate than that of Altman. When he used 16 ratios some of which were not significant, the accuracy rate was low -61.67. The accuracy rate of the model improved when five ratios were selected based upon their significance and used for prediction purposes. As found in the earlier studies, the accuracy rate diminished as time period before the event increased. For example, when the data for one year before event was used, the prediction accuracy rate was 76%. The two and three years before the event, the accuracy rate declined to 69 and 66.67%. This empirical evidenced consistent with Blum (1969) whereby he has the accuracy developed a theoretical model to discriminate between failed and non fail companies. He has used about 115 samples of companies from various sectors and employed 12 financial ratios. His result showed that the accuracy rate is between 93 to 95 percent. But he identified that a decline in accuracy rate to 80 percent when the model was used for prediction three years to bankruptcy.
In addition to that Shamser et al. (2001) tried to
identify the general characteristics of failed firms that were listed on the Bursa Malaysia. They result shows that the liquidity, profitability and cash flows of the failed firms showed a gradual deterioration, while the leverage of the companies showed a gradual increase. The most significant deterioration in these ratios occurred one year before failure and in the failure year. They findings indicates that that a consistent trend in the changes of the selected financial ratios would provide an early warning on potential failures/ financial problem and these ratios could be used to construct prediction models in Malaysia. Zulkarnain et al. (2001) tried to analysed
Malaysian industrial sector companies listed in the main
board. Similar to the study by Shamser et al. (2001), their
sample was the listed companies that requested protection under Section 176 of the Companies Act 1965. About 24 samples of failed companies were chosen for the period of 1980 to 1996. By utilized MDA model they’ve found the model accurately and significantly classified 91.1% and 89.3% of the failed and non-failed companies respectively. The model could predict failure up to four years before the actual events. There were four variables that could significantly discriminate between failed and non-failed companies. The variables were percentage of total liabilities, current asset turnover, market value to debts, and cash to current liabilities. Form the discriminating power, they‘ve further concluded that the most important variables was percentage of total liabilities whereas the least important variable was cash to current liabilities.
Following their work in 2001, Zulkarnain et al.
(2002) continued their study by included one more variable that is market value of share variable, which they then classified as the market-based model. Based on their results, comparing accounting versus market-based models they found six significant determinants of corporate success and failure namely; (i) total liabilities to total assets, (ii) asset turnover, inventory to total assets, (iii) sales to inventory, (iv) market value to debts, and (v) cash to total assets ratios. Total liabilities to total assets discriminated the most and cash to total assets discriminated the least among the six variables. It appears the market-based model accurately classified 86.2% of the companies while the accounting based-model accurately classified 88.1% of the companies tested. When a new sample of failed firms in the year 1998 was taken, both models could correctly classify failed firms up to four years before the failure occurred.
3.
METHODOLOGY
This study will explore either the financial position of the GLC are undergo expansion stage right now. In this paper, the quantitative research methodology will be used with empirical study. Quantitative research “is used to answer questions about relationships among measured variables with the purpose of explaining, predicting, and controlling phenomena” (Leedy & Ormrod, 2001). In addition, when researcher wants to identify the relations between two or more variables, correlation design is a proper option. To determine if the variables are related or not, based on data gathered from individuals on two or more variables, correlation design illustrate the two variables vary directly (positive correlation) or inversely (negative correlation) (Ary, et.al, 2010).
In this paper, the developed multiple discriminant analysis (MDA) model by Altman (1968) was chosen as the appropriate statistical technique. MDA is a statistical technique used to classify an observation into one of several a priori groupings dependent upon the observation's individual characteristics. The model can provide some ideas about the financial soundness of the
http://www.ejournalofbusiness.org
selected listed GLC in Bursa Malaysia, which is Malaysian's stock exchange. Altman developed the following equation for judging the financial soundness of an enterprise.
where: X1 = Working Capital / Total Assets
X2 = Retained Earnings / Total assets
X3 = Earnings before Interest and Taxes / Total
Assets
X4 = Market Value of Equity / Book Value of
Total Liabilities X5 = Sales / Total Assets
Z = Overall Index Details of the variables as follows:
3.1 X1, Working Capital / Total Assets
This is a liquidity ratio that measuring the net liquid assets (the difference between current assets and current liabilities) of a company over the company’s total capital.
3.2 X2, Retained Earnings / Total assets
This variable measure the leverage of the company whereby the formula analyzes how much of its assets are financed by the company’s own funds. ‘Retained earnings’ is the account whereby surplus earnings are accumulated and recorded hence the larger the ratio of the retained earnings of a company in relative to the total assets in hand, the less debt utilized by the company due to the retention of profits.
3.3 X3, Earnings Before Interest and Taxes / Total
Assets
It measures the ‘true productivity’ of the company (Altman, 2000) as it disregards the existence of tax and leverage factors affecting the actual earnings of the company. According to Altman (2000), this ratio outperforms other profitability ratio including the cash flow ratio and is very useful in measuring corporate failure as the reason for a company’s existence is the earning power of the company’s owned assets.
3.4 X4, Market Value of Equity / Book Value of Total
Liabilities
This is a solvency ratio whereby the maximum fall in a company’s equity value before the company falls under the ‘insolvent’ category is tabulated. The market value of equity is calculated as the sum of all shares, both
common and preferred stock whereas the total liabilities include both long term and sort term liabilities stated in the annual report.
3.5 X5, Sales / Total Assets
This will describes the ability of the company’s assets in producing sales. The Altman Z - scores is actually shows the figures that can be used to categorize a company into the financial distressed and non – financial distressed company. The descriptions of the categories are as follows;
Table 1: Description of Z-score
No. Range of Z –
Score Interpretation
1. Above than 2.99
The financial institution is in good position and safe from financial problem
2. Between 2.99
and 1.81 Warning Sign! It is considered as gray area as the financial institution have chances to faces bankruptcy problem
3. Less than 1.81 Bad Indication! The financial institution is most likely to be heading towards bankruptcy problem. Necessary actions are needed to avoid from the worst situation.
In addition to that, we will test the relationship of financial distressed with the liquidity ratio and long term debt ability ratio namely current ratio and debt ratio. Thus the regression equation for this study is as follows:
Where: Zi = Financial Distressed Cost as measured by Altman Z scores
CRi = Current Ratio DRi = Debt Ratio Єt= Error Term
3.6 Theoretical Framework
Researchers have employed the below framework to conduct the research whereby the dependent variable is financial distressed cost as measured by Altman Z-scores whereas the independent variables is current ratio and debt ratio.
http://www.ejournalofbusiness.org
3.7 Hypothesis Designing
The hypotheses were developed to justify empirically are as follows:
H1: There is a significant relationship between the
uses of current ratio and also Altman Z-score to determine financial distressed of the GLC.
H2: There is a significant relationship between the
uses of debt ratio and also Altman Z-score to determine financial distressed of the GLC.
H3: There is financial distress GLC that are listed in
the Bursa Malaysia.
Table 2: Research’s Selected GLC
No Company Name Code No Company Name Code
1 Gamuda Bhd. 5398.KL 16 Tenaga Nasional Bhd. 5347.KL 2 Ho Hup Bhd. 5169.KL 17 Telekom Malaysia Bhd. 4863.KL 3 Zelan Bhd. 2283.KL 18 Airasia Bhd. 5099.KL 4 Lebtech Bhd. 9628.KL 19 MMC Corporation Bhd. 2194.KL
5 MRCB 1651.KL 20 KPS Bhd. 5843.KL
6 AZRB 7078.KL 21 Boustead Holdings Bhd. 2771.KL 7 Ijm Plantations Bhd. 2216.KL 22 Tanjung Offshore Bhd. 7228.KL 8 Kulim Malaysia Bhd. 2003.KL 23 Sime Darby Bhd. 4197KL 9 Glomac Bhd. 5020.KL 24 KUB Malaysia Bhd. 6874.KL 10 Ijm Land Bhd. 5215.KL 25 KPJ Healthcare Bhd. 5878.KL 11 Damansara Realty Bhd. 3484.KL 26 Gas Malaysia Bhd. 5209.KL 12 Sapura Resources Bhd. 4596.KL 27 Media Prima Bhd. 4502.KL 13 UEM Sunrise Bhd. 5148.KL 28 Edaran Bhd. 5036.KL 14 Amcorp Properties Bhd. 1007.KL 29 MAHB 5014.KL 15 S P Setia Bhd. 8664.KL 30 Carriers Bhd. 7242.KL
4.
EMPIRICAL FINDINGS
Altman Z-score model (Altman, 1968) take into consider five independent variables, and each of them represent the financial ratios. A score under 1.81 shows that the company is heading towards unhealthy financial position. Scores above 2.99 indicate that the company are in good financial health and in between simply indicate they are in grey area (average).
Current ratio refers to liquidity ratio that measure a company’s ability to pay short term obligations (debt and payables). The higher the current ratio, the more capable the company is of paying its obligations. A ratio under 1 advises that the company would be incapable to pay off its commitments if they came due at that point. While this shows the company is not in
adequate financial health, it does not necessarily mean that it will go bankrupt - as there are many ways to access financing - but it is definitely not a good indicator.
Debt ratio measure the extent of a company’s consumer’s leverage which can also be interpreted as the proportion of a company’s asset that are financed by debt. The higher these ratios indicate the more leveraged are the company and the greater its financial risk.
Table 3 indicate the threshold value differentiating a financial distressed and non-financial distressed GLC’s companies using Current Ratio, Debt Ratio and Altman Z score.
http://www.ejournalofbusiness.org
Table 3: Threshold of Current Ratio, Debt Ratio and Altman Z –Score
Financial Situation Altman Z – Score
Value
Current Ratio
Debt Ratio
Financial Distressed GLC’s Company <1.81 <1.1 >1 Non – Financial Distressed GLC’s Company >2.99 =/>1.1 <1 Table 4 below discussed the comparison of
current ratio and debt ratio with Altman Z score using t-test analysis for the period 2008 until 2012.
Table 4: Comparison of Current Ratio and Debt Ratio with Altman Z - Score Using T - Test in
SPSS from 2008 – 2012
No Variables Compared N Mean T Significant Level
1 Current Ratio and Altman Z-Score 30 1.69797 9.08 0.0001 2 Debt Ratio and Altman Z- Score 30 2.94268 15.011 0.0000 From the table above, we can see that the mean
for variables compared between current ratio and Altman Z score are 1.69797 with the significant level of p>0.0001. It is shows that there is strong relationship between Z – Score and Current ratio. This is consistent with Muhammad Suleiman (2001) whereby current ratio is expected to have positive relationship with financial distressed. This is because, as current ratio increases, the firm ability to pay short term debt obligation is high and vice versa. In this case, there will be less financial distressed faced by firm. Therefore, in this case, null hypothesis is accepted.
In addition, variable comparison among debt ratio and Altman Z score shows a mean of 2.94268 with the significant level of p>0.000. In this case, the amount
of debt borrowed by GLC’s firm associated with the financial distressed. The greater the value of this ratio, the weaker will be the company financial health. This may subject firm to face financial distress. This finding appears to back up those of Altman (1968), Beaver (1970), Ewert (1968) and Blum (1969), who explained that normally debt ratios had significant predictive ability. Therefore, this study emphasizes that the importance of debt ratio as a predictor of failure. The implication of this that the non – financial distress companies normally will keep their debt at reasonable low levels while the distressed companies will keep their debt level at high or unable to do so. Hence, the null hypothesis is accepted. Both ratios shows that the comparison are significant as it giving value less than p>0.05.
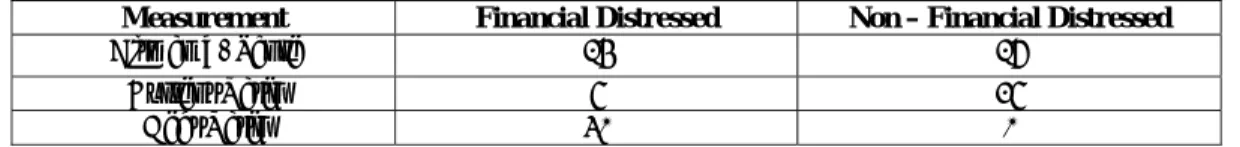
Table 5: Financial Condition of Companies Studied based on Altman Z –Score
Measurement Financial Distressed Non – Financial Distressed
Altman Z- Score 14 16
Current Ratio 5 25
Debt Ratio 30 0
Table 5 tabulates the profile of all 30 GLC’s listed companies categorized under financially distressed and non-financially distressed. Results shows that from year 2008 until 2012 period, 14 companies lies under financial distressed bunch using Altman z score measurement, 5 companies using current ratio and 30 companies using debt ratio measurement. On the other hand, 16 companies using Altman Z score, and 25 companies using current ratio are clustered as non-financially distressed. The Table 3 further support our hypothesis whereby there are financial distressed listed GLC’s in Bursa Malaysia.
5.
CONCLUSION AND
RECOMMENDATION
Financial distress is a famous topic nowadays in finance and financial health of firms are very crucial indicator of the company’s performance to investors as
well as managements. Investors prefer to devote their capital to those companies which are financially healthy as risk of default is minimized for them. These studies are also important for management cluster as they will be able to identify the causes of financial distress and may take precautionary measurement to control it.
The objective of this study was to determine financial distress measurement among 30 GLC’s listed companies in Bursa Malaysia over the period of five years (2008 until 2012). Further on, determinant such as current ratio and debt ratio were identified. It shows that there is strong relationship between Z – Score and Current ratio which is consistent with Muhammad Suleiman (2001) whereby current ratio is expected to have positive relationship with financial distressed. Debt ratio also do indicate its significant relationship to z score which found that amount of debt borrowed by GLC’s
http://www.ejournalofbusiness.org
firms are associated with the financial distressed. Results of this study indicate that there is existence of significant relationship between both variables and Z – Scores that determine financial distressed of the GLC. Few GLCs do signpost their position falls under financially distress cluster.
Future studies are needed toward updating the coefficient values connected to each ratio in Z-score model as per the inputs from the studied industries. In addition, further research may be opting to compare among different industries to come up with robust significant result. Future research should more focuses on different model to analyze the distressed prediction of the firms. In present the models that are widely used are Multi – Discriminant Analysis (MDA). In future, researchers may opt to use different models such as Logit analysis and artificial neutral networks (ANNs). In future, researchers may extend the time period to get more comprehensive results and also researcher should have study bankruptcy cost or financial distressed cost among small firm where the incidence of business failure is greater than larger corporations.
REFERENCES
[1] Abdullah, N.A.H, A. Halim, H. Ahmad and R. M. Rus (2008), “Predicting Corporate Failure of Malaysia’s Listed Companies: Comparing Multiple Discriminant Analysis, Logistic regression and the Hazard Model.”, International Research Journal of Finance and Economics, 15, EuroJournals Publishing Inc.
[2] Ahn, B.S. Cho, S.S. and Kim, C.Y., 2000. The integrated methodology of rough set theory and artificial neural network for business failure prediction. Expert Systems with Applications, 18(2), pp. 65-74.
[3] Aggarwal, R., Kyaw, N. A., & Zhao, X. (2008). Leverage and Firm Value: A Global Perspective.
http://www.i-jibe.org/achive/2011fall/2011_12%282%29_1.pdf [4] Ali, K. A. (2008). Financial Analysis and Its Uses
to Control the Performance and Detect Deviations, Arab Open Academy in Denmark College, Master’s Thesis.
[5] Altman, E. I. (1968). Financial Ratios, Discriminant Analysis and the Prediction of Corporate Bankruptcy. The Journal of Finance, Vol. 23, No. 4 , pp. 589-609.
[6] Almeida, H., & Philippon, T. (2000). The Risk-Adjusted Cost of Financial Distress.
[7] Andrade, G., & Kaplan, S. N. (1997). How Costly is Financial (Not Economic) Distress? Evidence from Highly Leveraged Transactions That Became
Distressed. Journal of Finance. http://citeseerx.ist.psu.edu/viewdoc/download?doi =10.1.1.155.1551&rep=rep1&type=pdf
[8] Andrade, G., & Kaplan, S. (1998). How Costly is Financial (Not Economic) Financial Distress-Evidence from Highly Leveraged Transactions that Became Distressed. Journal of Finance , 1443-1493.
[9] Ary, D. J. (2006). Research Method. Nigeria: National Open University of Nigeria.
[10] Beaver, W. (1966), "Financial ratios as predictors of failure", Journal of Accounting Research (Supplement), 4, pp. 71-102.
[11] Blum, M. (1974). Falling Company Discriminant Analysis. Journal of Accounting Research 12 (Spring), pp. 1- 25
[12] Cao Y., Guangyu W., & Fuqiang W. (2011). Predicting Financial Distress of Chinese Listed Companies Using Rough Set Theory and Support Vector Machine. Asia-Pacific Journal of
Operational Research http://www.worldscientific.com/doi/abs/10.1142/S
0217595911003077?journalCode=apjor
[13] Claessens, S., Djankov, S., & Mody, A. (2001). Resolution of Financial Distress: An Overview.
World Bank. http://www.amody.com/pdf/ResFinDistressEd2.pd
f
[14] Edith S. Hotchkiss, Kose John, Karin S. Thorburn and Robert M. Mooradian (2008) Bankruptcy and the Resolution of Financial Distress
[15] Ewert, D. (1968). Trade Credit Management: Selection of Accounts Receivable Using Statistical Model. Stanford University. Unpublished PhD Thesis.
[16] Graham, J. R. (2000). How Big Are the Tax Benefits of Debt? Journal of Finance. Vol. LV, No.
5 • Oct. 2000. https://faculty.fuqua.duke.edu/~jgraham/HowBigFi
nalJF.pdf
[17] Jensen.,& Meckling. (1976). Theory of the Firm: Managerial Behavior, Agency Costs and Ownership Structure. Journal of Financial Economics. V. 3, No. 4, pp. 305-360. http://www.sfu.ca/~wainwrig/Econ400/jensen-meckling.pdf
[18] Jensen, M. C. (1989). Eclipse of the Public Corporation. Harvard Business Review.
http://www.ejournalofbusiness.org
http://citeseerx.ist.psu.edu/viewdoc/download?doi =10.1.1.201.9573&rep=rep1&type=pdf
[19] John Y. Campbell, Jens Hilscher, and Jan Szilagyi (2013); Predicting Financial Distress and the Performance of Distressed Stocks
[20] Jones, F.L. (1987), "Current techniques in bankruptcy prediction", Journal of Accounting Literature, 6, pp. 131-164.
[21] Kaveri, S.P.(1980). Financial Ratios as Predictors of Borrowers, Health Sulth Chand & Sons, New Delhi.
[22] Koyuncugil, A. S.and N. Ozgulbas (2007), “Detecting financial early warning signs in Istanbul Stock Exchange by data mining”, International Journal of Business Research
[23] Leedy, P., & Ormrod, J. E. (2001). Practical Research: Planning and Design.7th ed. USA: Upper Saddle River, NJ: Prentice Hall.
[24] Low, S., M.N. Fauzias and A. Z. Ariffin, (2001), “Predicting corporate distress using logit model: The case of Malaysia”, Asian Academy of Management Journal, 6(1), pp. 49-62.
[25] Mahmood, J. A. & Talal, A. (2009). Research presented to the Seventh International Scientific Conference of Zarqa Private University.
[26] Malik, R. K. (2013). Determinants of Financial Distress Evidence from KSE 100 Index. Business Review - Volume 8 Number 1 , 7-19.
[27] Miller, M. H. (1988). The Modigilani-Miller Propositions after Thirty Years. Journal of Economic Perspectives. http://www- personal.umich.edu/~kathrynd/JEP.Modigliani-Miller.pdf
[28] Modigliani, F., & H, M. M. (1958). The Cost of Capital, Corporation Finance and The [29] Theory of Investment. The American Economic
Review.
[30] http://www.aeaweb.org/aer/top20/48.3.261-297.pdf
[31] Mohamed, S., A.J. Li, and A.U. Sanda (2001), “Predicting corporate failure in Malaysia: An application of the Logit Model to financial ratio analysis” Asian Academy of Management Journal, 6(1), pp. 99-118.
[32] Mohammed, M. (1997). Financial analysis, Amman, Jordan, Institute of banking studies. Book.
[33] Mohd Sulaiman ., Ang Jili & Ahmadu Umaru Sanda., (2001). Predicting Corporate Failure in Malaysia: An Application of the Logit Model to Financial Ratio Analysis. Asian Academy of Management Journal. Vol .6(1): pp. 99 -118 [34] Myers, S. (1977). Determinants of Corporate
Borrowing. Journal of Financial Economics.https://www2.bc.edu/~chemmanu/phdf incorp/MF891%20papers/Myers%201977.pdf [35] Nam, C.W., T.S. Kim, N.J. Park and H.K. Lee
(2008),“Bankruptcy prediction using a Discrete-Time Duration Model Incoprorating Temporal and Macroeconomic dependencies”, Journal of Forecasting, 27, pp. 493-506.
[36] Ohlson, J. A. (1980), "Financial ratios and the probabilistic prediction of bankruptcy", Journal of Accounting Research, 18, pp. 109-131.
[37] Optler, T. C., & Titman, S. (1994). Financial Distress and Corporate Performance. Journal of Finance. Vol 1(3). Pp 45 -56. http://www.jstor.org/discover/10.2307/2329214?ui d=18431632&uid=3738672&uid=2&uid=3&uid=6 7&uid=16739016&uid=62&sid=21102694891901 [38] Rosmi Abdullah (2007). Productivity Performance
of Malaysian Government Linked Companies (GLCs) in Plantation Sector. Pp 45-83.
[39] Shamsher, M., Zulkarnain, M. S. & Mohamad Ali, A. H. (2001). Why companies fail? An analysis of corporate failures. Akaiintan Nasioizal, pg 5-8. [40] Steven Liew Woon Choy, Jayaraman Munusamy,
Shankar Chelliah and Ally Mandari (2011) Effects of Financial Distress Condition on the Company Performance: A Malaysian Perspective. Review of Economics & Finance.
[41] Tajirian, A. (1997). Leverage. http://www.morevalue.com/i-reader/ftp/Ch14.PDF [42] Tam, K. Y. & M. Y. Kiang. (1992): Managerial
applications of neural networks: The case of bank failure predictions. Management Science (July): 926-947.
[43] Tan, T. K. (2012). Financial Distress and Firm Performance: Evidence from the Asian Financial Crisis. Journal of Finance & Accountancy, Vol. 11, 10p , 36-45.
http://www.ejournalofbusiness.org
[44] Theodossiou,P., and E. Kahya,(1996). Non Stationarities in Financial Variables and the prediction of Business Failures” Proceedings of the Business and economic statistics section, American Statistical Association, pp.130-133.
[45] Zulkarnain, M. S., Mohamad Ali, A. H., Annuar, M. N. & Zainal Abidin, M. (2001). Forecasting corporate failure in Malaysian industrialsector firms. Asian Academy of Marzagenzeilit Journal, 6(1), 15-30.
[46] Zulkarnain, M. S., Shamsher, M., Mohamad Ali, A. H. & Annuar, M. N. (2002). Determinants of corporate success and failure: The Malaysian case. Akmrztan Nasioizal, pg 23.
[47] Zulkarnain. (2009). Prediction of Corporate Financial Distress: Evidence from Malaysian Listed Firms during the Asian Financial Crisis.
APPENDIX
No Stock code Stock name Sector Current
Ratio Debt Ratio Z-Score 1 5398.KL Gamuda Bhd. Construction 2.02 2.38 3.08 2 5169.KL Ho Hup Bhd. Construction 0.33 5.65 -1.64 3 2283.KL Zelan Bhd. Construction 0.94 2.94 0.15 4 9628.KL Lebtech Bhd. Construction 2.40 1.88 2.83 5 1651.KL Malaysian Res. Bhd. Construction 1.64 3.74 1.47 6 7078.KL Ahmad Zaki Res. Bhd Construction 1.33 3.59 1.32 7 2216.KL IJM Plantations Bhd. Plantation 1.75 6.28 176.6 8 2003.KL Kulim Malaysia Bhd Plantation 1.12 1.96 2.08 9 5020.KL Glomac Bhd. Properties 1.48 2.60 1.28 10 5215.KL IJM Land Bhd Properties 1.24 3.37 0.90 11 3484.KL Damansara Realty Bhd. Properties 1.02 3.17 2.77 12 4596.KL Sapura Resources Bhd. Properties 1.15 2.61 1.69 13 5148.KL UEM Sunrise Bhd. Properties 3.59 1.77 3.21 14 1007.KL Amcorp Properties Bhd. Properties 2.20 1.98 112.3 15 8664.KL S P Setia Bhd. Properties 2.75 2.34 2.16 16 5347.KL Tenaga Nasional Bhd. Trading/Service 1.67 3.22 1.35 17 4863.KL Telekom Malaysia Bhd. Trading/Service 1.67 3.14 1.45 18 5099.KL Airasia Bhd. Trading/Service 1.37 3.68 0.79 19 2194.KL MMC Corporation Bhd. Trading/Service 1.53 3.69 0.69 20 5843.KL Kumpulan Perangsang
Selangor Bhd. Trading/Service 5.53 3.29 0.86
21 2771.KL Boustead Holdings Bhd. Trading/Service 0.59 2.85 1.35 22 7228.KL Tanjung Offshore Bhd. Trading/Service 1.73 2.06 2.10 23 4197KL Sime Darby Bhd. Trading/Service 1.24 2.06 3.81 24 6874.KL KUB Malaysia Bhd. Trading/Service 1.39 2.61 1.87 25 5878.KL KPJ Healthcare Bhd. Trading/Service 1.10 1.10 2.73 26 5209.KL Gas Malaysia Bhd. Trading/Service 0.97 1.45 1.05 27 4502.KL Media Prima Bhd. Trading/Service 1.55 2.27 2.16 28 5036.KL Edaran Bhd. Trading/Service 2.26 1.67 1.22 29 5014.KL Malaysia Airport Bhd Trading/Service 1.89 2.28 2.06 30 7242.KL Carriers Bhd. Trading/Service 1.69 2.77 2.10