Date of publication xxxx 00, 0000, date of current version 2019 08, 0000. Digital Object Identifier 10.1109/ACCESS.2019.DOI
Design and implementation of a
convolutional neural network on an edge
computing smartphone for human
activity recognition
TAHMINA ZEBIN1, PATRICIA J. SCULLY2, (Member, IEEE), NIELS PEEK3, ALEXANDER J.
CASSON4, (Senior Member, IEEE), and KRIKOR B. OZANYAN4, (Senior Member, IEEE)
1School of Computing Sciences, University of East Anglia, Norwich, UK (e-mail: [email protected]) 2School of Physics, NUI Galway, Ireland (e-mail: [email protected])
3Health eResearch Center, University of Manchester, UK (e-mail:[email protected])
4Department of Electrical and Electronic Engineering, University of Manchester, UK (e-mail:alex.casson, [email protected])
Corresponding author: Tahmina Zebin (e-mail: t.zebin@ uea.ac.uk).
ABSTRACT Edge computing aims to integrate computing into everyday settings, enabling the system to be context-aware and private to the user. With the increasing success and popularity of deep learning methods, there is an increased demand to leverage these techniques in mobile and wearable computing scenarios. In this paper, we present an assessment of a deep human activity recognition system’s memory and execution time requirements, when implemented on a mid-range smartphone class hardware and the memory implications for embedded hardware. This paper presents the design of a convolutional neural network (CNN) in the context of human activity recognition scenario. Here, layers of CNN automate the feature learning and the influence of various hyper-parameters such as the number of filters and filter size on the performance of CNN. The proposed CNN showed increased robustness with better capability of detecting activities with temporal dependence compared to models using statistical machine learning techniques. The model obtained an accuracy of 96.4% in a five-class static and dynamic activity recognition scenario. We calculated the proposed model memory consumption and execution time requirements needed for using it on a mid-range smartphone. Per-channel quantization of weights and per-layer quantization of activation to 8-bits of precision post-training produces classification accuracy within 2% of floating-point networks for dense, convolutional neural network architecture. Almost all the size and execution time reduction in the optimized model was achieved due to weight quantization. We achieved more than four times reduction in model size when optimized to 8-bit, which ensured a feasible model capable of fast on-device inference.
INDEX TERMS Convolutional Neural Networks, Edge Computing, TensorFlow Lite, Activity Recogni-tion, Deep Learning.
I. INTRODUCTION
D
EEP learning techniques have been applied to a va-riety of fields and proved their usefulness in many applications such as speech recognition, language modelling and video processing. Models such as Convolutional Neural Networks (CNN), and Recurrent Neural Networks (RNN) employ a data-driven approach to learning discriminating features from raw sensor data to infer complex, sequential, and contextual information in a hierarchical manner [1]. They are highly suited for exploiting temporal correlations in datasets that makes them suitable for applications such as human activity recognition (HAR) classification, where potentially a large amount of data is available; human movements are encoded in a sequence of successive samples in time; and the current activity is not defined by one small window of data alone. In recent years machine learning methods used in the literature for HAR have effectively analyzed human activities for domains such as ambient assisted living (AAL), elder care support, smart rehabilitation in sports, and cognitive disorder recognition systems in smart healthcare [1], [2].
Despite significant research efforts over the past few decades, activity recognition remains a challenging problem. Sensor embodiment and low accuracy of activity recognition is one of the challenges that affect the adoption of these systems in clinical settings [3]. Other than that, many of the state-of-the-art learning methods ( e.g. support vector machines (SVM), decision trees, k-nearest neighbour algorithms, and advanced ensemble classifiers) need extensive pre-processing and domain knowledge to handcraft and calculate discrim-inating features to be used by a classifier [4]. However, deep learning remains under-explored as a research field in terms of raw time-series processing of inertial sensor data for activity recognition [5].
In this paper, we devise a feature-less activity recognition system with a novel multi-channel 1-D convolutional neural network architecture and substituted the manually designed feature extraction procedure in HAR by an automated fea-ture learning engine. Compared to deep architecfea-tures such as recurrent neural networks and long short term memory networks, CNNs have the most straight-forward training process. In addition, some of the current edge development boards such as SparkFun Apollo3 [6] chip has support for CNN acceleration for edge use. For our design, we exploit the fact that CNN can discover intricacies in the data char-acteristics with its convolution (which computes a mixture of nearby sensor readings), and pooling operation (which makes the representation invariant to small translations of the input). The implemented architecture in this paper is novel in its use for time series data analysis and its use of batch normalization for HAR with the CNN architecture when compared to ones reported in the literature. We then extend the trained models implementation on a smartphone to provide a proof of concept of transferring the capability of deep learning models on edge devices. We also consider the memory footprint optimization for the network to run on a mobile and embedded wearable device.
The remaining sections of this paper are organized as follows. In Section II we review current sensor-based activity recognition using deep learning methods. Design insights are derived from the review of the related work and we provide a description of the dataset for the implemented network in this section. Section III gives details on the proposed CNN algorithm, and discusses the necessary background concepts for understanding the design of the CNN model. The in-fluence of important hyper-parameters such as the number of convolutional layers, filter size and number of filters are explored in Section IV using a grid search method. Based on the performance of the proposed CNN model, the optimal pa-rameters for the final design are selected. Section V presents the challenges, model graph analysis for memory require-ment, and quantization approach applied on the trained deep model for its implementation on an edge device. Finally, the quantized model performance is evaluated as a smartphone app implementation for activity recognition in Section VI.
II. BACKGROUND
In traditional machine learning models based on static and shallow features, several authors [7], [8] provided a broad summary of HAR, highlighting the capabilities and limi-tations of a number of statistical machine learning models such as Support Vector Machines (SVMs), Gaussian Mixture Models (GMMs) or Hidden Markov Models (HMMs) [4], [9]. One of the main shortcomings the developers faced was that they had to decide adequate features for the task by trial and error. To overcome this handcrafting, researchers have moved towards deep learning models where the feature extraction process is included in its modelling.
A. RELATED DEEP LEARNING WORKS
Convolutional networks comprised of one or more convo-lutional and pooling layers followed by one or more fully-connected layers, have gained popularity due to their ability to learn unique representations from images or speeches, cap-turing local dependency and distortion invariance [10]. CNN has recently been applied to the problem of activity recog-nition in a number of research papers. In order to provide an automated activity recognition system with a novel multi-channel 1-D convolutional neural network architecture with high accuracy; this section reviews a number of recent studies employing deep learning models such as convolutional and recurrent neural networks to classify activities using data from one or more wearable inertial sensors.
Ordonez and Roggen [9] proposed an activity recognition classifier using Deep CNN and long short-term memory (LSTM) and two open datasets collected by seven inertial measurement units and 12 triaxial accelerometer wearable sensors. The authors classified 27 hand gestures (opening door, washing dishes, cleaning table etc.), and five move-ments (standing, walking, sitting, lying, and nulling) using a combination of CNN and LSTM after converting the sensory data into sensor signal graphs. Simulation results showed that F1 score of 0.93 and 0.958 was achieved. F1 score is the harmonic mean of precision and recall performance (formu-lation provided in equation (4)). Ronao et al. [10] first at-tempted the design of CNN with convolutional layers applied along the time axis and overall the sensors simultaneously, called temporal convolution layers. They used two or three of these layers followed by a pooling layer and a softmax classi-fier. We have previously developed a context-aware algorithm using multi-layer LSTM [11] which achieved an overall accuracy of 92% for static and dynamic daily life activities, however, for edge implementation, the network has quite high computational cost and memory requirement. Though the use of batch normalization accelerated the computation to an extent, it would require further acceleration before it is used for real-time predictions. Reuda et al. [12] com-pared several concurrent methods that implemented a CNN based architecture, showing better performance compared to shallower or handcrafted methods using Linear Discriminant Analysis (LDA), Quadratic Discriminant Analysis (QDA), K-Nearest Neighbor (KNN), SVMs. A detailed review of few
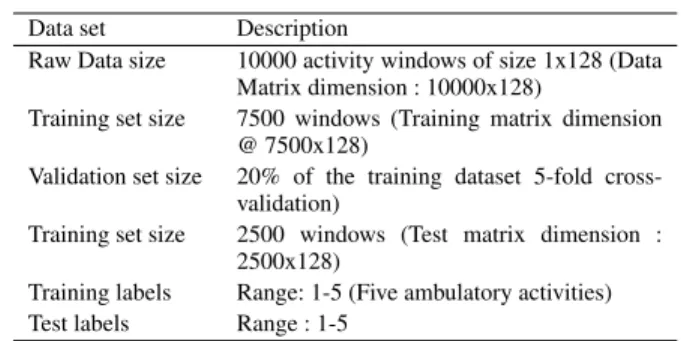
TABLE 1. Division of the dataset.
Data set Description
Raw Data size 10000 activity windows of size 1x128 (Data Matrix dimension : 10000x128)
Training set size 7500 windows (Training matrix dimension @ 7500x128)
Validation set size 20% of the training dataset 5-fold cross-validation)
Training set size 2500 windows (Test matrix dimension : 2500x128)
Training labels Range: 1-5 (Five ambulatory activities) Test labels Range : 1-5
other deep learning methods are available in [1], [13], [14]. It is noted that evaluation of most of the architecture described so far is performed on publicly available datasets such as the Opportunity [15], Pamap2 [16], and UCI HAR dataset [17]. One major issue is that some of these datasets contain too many sensors combined with overtly variant activities, that lacks a balanced number of support instances in each category to be efficiently detected by any deep learning algorithms. Hammarela et al. [18] used CNNs to classify activities using data from multiple inertial sensors on the body. This performed well, and was optimized for low-power devices, but reintroduced the extraction of handcrafted fea-tures by using a spectrogram of the input data, and it requires multiple sensor devices (whereas in a real-life scenario, we base our work on the assumption that people would wear just one unit at any time).
In this paper, we aim to derive a sensor independent deep learning method that is highly accurate and fast in its decision making. For that, we designed and discussed through the methodological steps for implementing a robust model on a balanced dataset, and then moved towards the edge imple-mentation.
B. DATASET DESCRIPTION
As the dataset, we processed the time series data from a waist mounted inertial sensor containing both accelerometer and gyroscope measurements. Data from 20 subjects were used, further details on this can be found in ref [4]. The dataset is grouped together to classify five everyday activities: 1: walk on a level surface; 2: walk upstairs; 3: walk downstairs; 4: sedentary (stand+ sit); 5: sleep (lying). We used a custom wearable setup with MPU-9150 sensor [19] and captured 3-axial linear acceleration and 3-axial angular velocity at a constant rate of 50Hz. We sampled the data from 14 volunteers, with approximately 7500 labelled activities as training data, and data from an additional 6 volunteers, 2500 labelled activities, as a test dataset (summary presented in Table 1). The test set was separated entirely from the training dataset during our experiments. In addition, to avoid over-fitting the model, 20% of the training dataset was held back for validation.
C. DATA PRE-PROCESSING STAGES
With wearable inertial sensor being our data source, the raw dataset contains values with different units and ranges with
accelerometer recorded inm/s2and gyroscope data recorded
inrad/s. The sensor signals (accelerometer and gyroscope) were pre-processed by applying a Butterworth low-pass fil-ter with 0.3 Hz cutoff frequency to remove low frequency gravity component from the acceleration. We performed the following pre-processing on our training and test datasets: 1) Scaling and Normalization
To avoid any kind of training bias due to the direct use of large values from any of the six channels, we applied scaling across the channels. This converted all the channel values to a range between 0 and 1, by application of a min-max normalization function from the python sklearn library for this purpose. To be noted, as we maintained a consistent location for sensor placement during our data collection, the model provides accurate prediction for that sensor location (e.g. wrist or pelvis) only. However, the model is adaptable to reasonable amount of displacements since the scaling and normalization stage takes care of the amplitude variation. Additionally, the algorithm can deal with any change in sensor orientation due to raw time series processing from each channel.
2) Segmentation
Once the scaling on the raw data is performed, the six-channel input time series is segmented as 1x128 windows so that the convolutional filters could explore any temporal rela-tionship between the samples within an activity. Our choice on the optimum window size was made in an adaptive and empirical manner [20], [21] to produce good segmentation for all the activities under consideration.
3) Class relabeling and One-Hot encoding
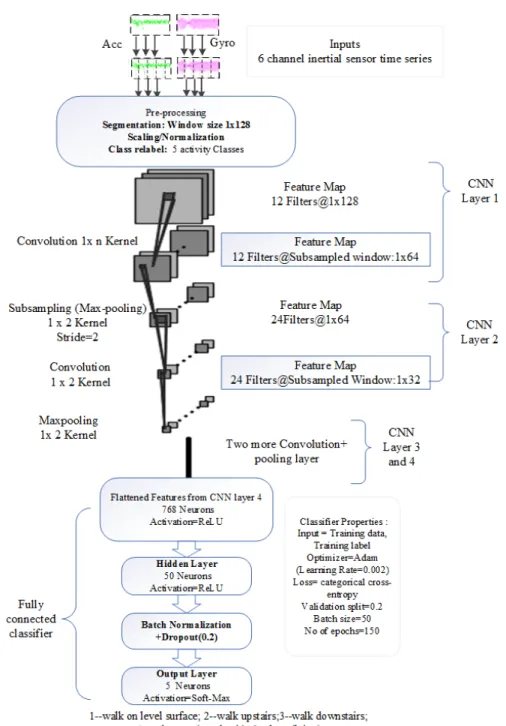
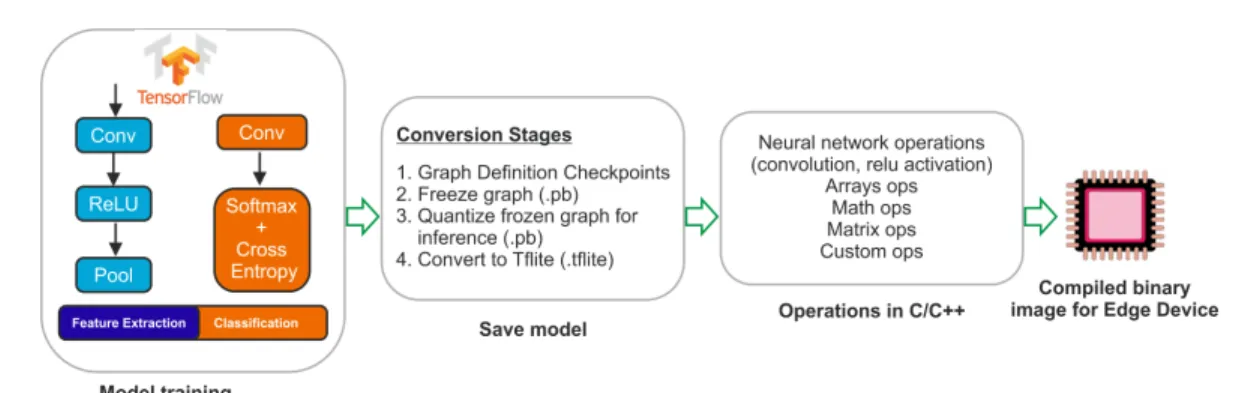
We also converted the output activity labels to One-Hot encoded labels. We encoded our activity windows to five unique labels as discussed previously in the dataset descrip-tion secdescrip-tion. These pre-processing stages is also summarized in the preprocessing stage of Fig. 1.
III. THE PROPOSED HAR CLASSIFICATION MODEL BASED ON CNN ARCHITECTURE
A schematic diagram of our four-layer stacked CNN archi-tecture used for multi-class HAR classification is presented in Fig. 1. We selected the CNN architecture due to its capability to process raw time-series data, error handling with backpropagation, and high model accuracy.
A. MODEL IMPLEMENTATION
We stacked a total of four convolution and pooling layers in the proposed model, to obtain more detailed features than obtained by a previous layer. In our design, we doubled the number of filters after each convolution and pooling layer. The feature map extracted by the filters of the final CNN layer wass then flattened out to be used as an automatically extracted feature set by any other classifier. The six-channel input time-series (segmented as 128 samples/window for
FIGURE 1. Layer-wise specification of the CNN architecture used for multi-class HAR classification. each channel) from 3-axis accelerometer and 3-axis
gyro-scope were processed by a number of convolution filters. These filters create a non-linear, distributed representation of the input and are of variable filter size. These are then be applied over the entire input time series with a specific stride length. Then a max-pooling layer is used to down-sample the temporal features (such as slopes/changes in the time series signal) that the convolution layer has just extracted. For a given training dataset, our objective is to find the optimal parameters to minimize the difference between input and reconstructed output over the whole training set. To apply CNN to human activity recognition, there is a need for several design adjustments for 1-D adaptation for processing the
sensor data such as input adaptation, pooling, and weight-sharing. The subsections below discuss several adaptations and processing stages of the proposed convolutional neural networks for the activity classification task in hand.
B. CNN FEATURE EXTRACTION
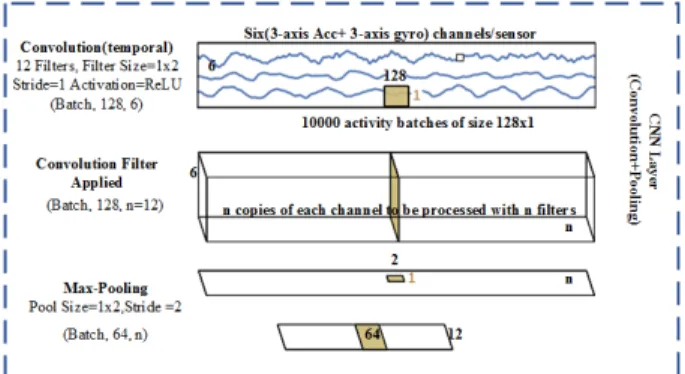
In the CNN architecture, the internal representation of the input is implicitly learned by the convolutional kernels. The convolution and a sub-sampling or pooling operations inher-ently enable CNN to perform as a good feature predictor. As mentioned previously section III-A, we have used a four-layer stacked convolution and pooling for extracting features from the raw wearable sensor data. In Fig. 2, an elaboration
of the convolution and subsampling (i.e. max-pooling) oper-ation on the time series data is illustrated. In the convolution layer, multiple non-linear transformations (ntransformations for n filters) are applied on the input, each one creating a different output map. In a sub-sampling layer with specific pool size (e.g, 1x2), each of the outputs of the previous layer is down-sampled by a procedure of striding over on non-overlapping regions of the input. This procedure is usually an averaging or maxing of each region that creates a single output. Since each point of the output is created by a region of the input and these regions don’t overlap, a down-sampling occurs.
Every layer gets an input (1-D array), and all operations are performed in segments and windows of this input. This procedure exploits the prior idea that data points that carry related or similar information will be grouped by a specific filter or kernel. There are shared weights in each layer, that are identically applied to all parts of the input. This defines the functionality of CNN, since the 1-D input is convolved
with a small matrix of weights to produce the output of the layer, acting as a filter. In this context, convolution extracts features, while pooling recombines the extracted information in a more meaningful way. Together they extract specific features over the whole input window. This operation exploits the assumption that a filter that is useful in one part of the signal is probably useful in other parts of it. This design choice vastly decreases the number of trainable parameters and contributes to the high accuracy during the training of the network. Because of the consecutive pooling procedures in each layer, the output becomes increasingly sensitive to small variations of the input, which eventually help identify unique time domain events for activity classification. A further level of abstraction can be achieved by stacking up a couple of these layers. To be noted, the model was implemented using the Keras open source library in Python [22] with tensorflow back-end. We utilized the sequential model and the dense, conv1D, maxooling1D, dropout, and batch normalization layers for our implementation.
IV. ABLATION STUDY: HYPER-PARAMETER TUNING AND CLASSIFICATION PERFORMANCE
We present the influence of important hyper-parameters such as the number of convolutional layers, number of convolu-tional kernels (i.e. filters), and filter size in this section. We evaluated the model performance by varying a number of model parameters and observed their effect on the detection speed and accuracy. Based on this ablation study on the proposed architecture, the optimal parameters for the final design are selected.
A. HYPER-PARAMETER TUNING
The hyper-parameters of a convolutional layer are its filter size, depth, stride, and padding. These parameters must be chosen carefully in order to generate a highly accurate and fast output. The hyper-parameters of the pooling layer are its stride and pooling size. Since they have to be chosen in
FIGURE 2. Elaboration of convolution and sub-sampling (max-pooling) for time series data in a typical CNN layer.
TABLE 2. Effect of increasing number of convolution and pooling layers.
Model constants CNN layers Time to train (s) Accuracy on valida-tion set (%) Filter size=1x2, 1 47.930 82% No. of filters=12, 2 74.399 88.1% Epoch=120. 3 104.021 90% 4 144.733 93% 5 178.790 94.9%
accordance with each other, we systematically presented the effect of these hyper-parameters in the following sections. 1) Effect of number of layers
In a CNN, the successive layers of convolution and sub-sampling (e.g. max-pooling) functionality aims to learn pro-gressively more complex and specific features, with the last layer representing the output activity classes. An increased number of layers contributes to the depth of the network. We varied the number of layers in our proposed model from 1 to 5. With an increasing number of layers, the accuracy of the model increases beginning with 82% accuracy with a single layered network and going up to 94.9% with five layers (shown in Table 2). However, as can be seen in Fig. 3 and Table 2, the complexity and execution time of the network increases because of the increasing number of parameters as the number of layers go higher.
2) Effect of number of filters and kernel size of the filter The number of filters (i.e. convolutional kernels,nin Fig. 2) of each successive layer increases due to down-sampling.
FIGURE 3. Change in the number of model parameters and training time with increased number of layers in the CNN model.
FIGURE 4. Effect of convolutional kernel size in CNN activity classification.
TABLE 3. Effect of increasing number of filters on convolution layer.
Model Constants Number of filters No. of Fea-tures Accuracy(%) 4 Layer CNN, 6 384 89% filter size=1x2, 12 768 90% pooling size=1x2 20 1440 92% (stride=2) 25 1600 95% 50 3200 96.4%
The deeper the layer, the bigger the segment or window of the original input that affects the value of a data points in that layer. Table 3 summarizes the model constants with a varying number of filters and, lists the time needed to train and the model’s performance accuracy. An increased number of convolutional filters manifested higher accuracy due to the added temporal scaling in features obtained by the additional filters. The size of the filter (expressed as1×min Fig. 2) captures the temporal correspondence between neighbouring data points within the filter. The effects of filter size on models accuracy and execution time has been summarized in Fig. 4 with model constants provided in the first column. As can be seen from Fig. 4, our experiments indicate higher model accuracy with increasing filter size until the filter size reached (1x12) in a (1x128) activity window. The model accuracy deteriorates with wider filter size such as (1x15) and (1x18), since it starts to lose the temporal context of the activity. To be noted, all the time measurement were performed on a conventional computer with an Intel core i7 CPU (2.4 GHZ), and 3 GB memory.
3) Effect of dropout and batch normalization
Table 4 shows the effect of Dropout and Batch Normalization (BN) on models overall performance accuracy. The batch normalized CNN (CN N +Dropout+BN) consistently outperforms the generic CNN model an increase 4% from TABLE 4. Quantitative comparison of SVM, fully connected Dense Neural Network and Versions of CNN for HAR classifications.
Learning method Input Overall
Accu-racy(%) Prediction time (ms) SVM (quadratic) [4] handcrafted features 93.4% 10.6 Fully connected MLP [4] handcrafted feature 91% 6.7
Generic CNN raw time series 92 % 12.6
CNN+Dropout raw time series 94 % 6.1
CNN+Dropout+BN raw time series 96.4% 3.53
FIGURE 5. Average training set accuracy over 150 epochs for the proposed model. Thebatch normalizedCNN is more stable in terms of accuracy than the generic CNN.
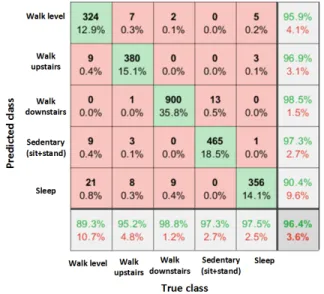
FIGURE 6. Confusion matrix for the proposed CNN on the test dataset. the generic CNN without BN. In addition, for an increased number of training epochs, the CN N +Dropout+BN
achieves 95% training set accuracy four times faster (using 15 epochs) than the generic CNN (50 epochs). This is also true for the validation data set. The reduction in training epochs required is substantial and will be of vital importance while dealing with bigger datasets such as [23]. Fig. 5 shows the training set accuracy over 150 epochs for the proposed model and the Batch Normalized CNN (seen in purple) is more stable in terms of accuracy than the generic CNN.
B. TEST SET CLASSIFICATION PERFORMANCE
To evaluate the performance of the model, we inputted the data from 6 volunteers as the test dataset. The test set was separated entirely from the training dataset. In addition, to avoid over-fitting the model with training data, 20% of the training dataset was held back as a validation set in our experiments.
To put our model performance in context, we presented the confusion matrix plot in Fig. 6 for the test data set
when predictions are done with the test dataset. The rows in the confusion matrix correspond to the predicted class (Output Class) and the columns correspond to the true class (Target Class). The rightmost column of the confusion matrix presented in Fig. 6 corresponds to the class-wise precision performance and the bottom row correspond to the recall performance. The diagonal cells in the confusion matrix correspond to observations that are correctly classified (TP
and TN’s). For our test dataset, there are 324 instances of
correctly classified as walk level activity. The off-diagonal cells correspond to incorrectly classified observations (FP
andFN’s). For instances where the model predicted
incor-rectly, in the first column of the confusion matrix, there were 9 instances where the model predicted walk level activity to be walk upstairs, for 9 instances the predicted class was sedentary and for 21 instances it was classified as sleep category which contributed to a 10.7% false negative instances for this class. Similarly, if we go across the row, there are some instances where the model flagged up the false positives (4.1%) for this category. We have also shown in each cell the number of observations for an activity category, and the percentage in terms of total observations available in the full test set. From the confusion matrix, the overall accuracy, precision and recall performance of the model can be calculated using the following equations:
Overall Accuracy= TP +TN TP+TN+FP+FN . (1) Precision= TP TP+FP . (2)
Recall or True positive rate= TP
TP +FN
. (3) The class-wise performance when the trained model was exposed to a test set containing approximately 2500 new activities and it achieved 96.4% overall accuracy when tested with the proposed model. To show class-wise precision per-formance, we presented the ratio of correctly predicted pos-itive observations to the total predicted pospos-itive observations as high precision relates to the low false positive rate. In our case, we achieved 95.9%, 96.9% and 98.5% precision perfor-mance for dynamic ambulatory activities as walk level, walk upstairs and downstairs respectively. For sedentary (stand and sit) and sleep activities the precision performance was found to be 97.3% and 90.4% respectively.
While measuring the recall performance, ratio of correctly predicted positive observations to all observations in the actual/true class is calculated and the class-wise recall per-formances for the five class scenario was 89.3%, 95.2% and 98.8%, 97.3% and 97.5% respectively. The highest precision and recall score was obtained for the walk downstairs cate-gory where higher data ratio provided higher confidence in its decision making. In cases of uneven recall and precision performance which is the case for some of our classes such as walk level and sleep activity, an F1 score is usually more
useful indicator of performance than accuracy as this score takes both false positives and false negatives into account and is defined as follows:
F1 Score=2×Precision×Recall
Precision+Recall (4)
Our reported F1 score for the walk level, walk upstairs, walk downstairs, sedentary, and sleep activities with the proposed model are 92.47%, 96.04% and 98.64%, 97.3%, and 93.5% respectively.
V. PRE-TRAINED MODEL TRANSFER ON EDGE DEVICE
The implementation of pre-trained deep learning models for mobile computing is of special interest and has enabled numerous applications such as smart activity tracking, in-telligent personal assistant, real-time language translation on smartphones and smartwatches. Recent implementations and approaches used point-wise group convolution and channel shuffle to effectively run on resource constrained devices [24], several authors have proposed and implemented deep learning models on smartphones for facial expressions de-tection using camera data [25] or human activity detec-tion using accelerometers built-in to smartphones [10], [26]. Commercial human activity monitoring devices, relying on inertial sensors such as Fitbit have gained popularity for daily activity tracking. However, the accuracy of these devices was not satisfactory for applications such as gait analysis or step counting for slow walking [27]. The type of the activity might affect the accuracy as well [28], [29]. Along with the accuracy reduction issue, models size would be another factor to be considered seriously since very large neural networks can be hundreds of megabytes and would be difficult to store on device. Thus we need to minimize the model before considering an edge implementation. In the following subsection, we discussed the challenges of implementing deep models on edge devices and presented our analysis of the neural network after applying quantization of the trained model to fit it efficiently on a smartphone.
A. CHALLENGES ON EDGE DEVICES
Most wearables have low computation power compared to a typical smartphone due to their small form factors and heat dissipation restrictions. Wearables also have very limited energy constraints due to their limited battery capacity. On the other hand, deep learning models usually require heavy computation, regardless of their types (Dense, convolutional, or recurrent neural networks). As a neural network model could consist of hundreds of connected layers, each of which can have a collection of processing elements (i.e., neurons) executing a non-trivial function, it requires consid-erable computation and energy resources in particular during streamed data processing (e.g., continuous speech translation or inertial sensor data processing), the implementation steps need to be re-visited in order to load them on edge devices [30]. In this section, we aim to find out the computational re-quirements for it to use resource-heavy modeling techniques on a smartphone or smartwatch level hardware.
FIGURE 7. Steps for embedded adaptation of TensroFlow based deep learning models.
TABLE 5. Memory consumption and execution time summary by node type.
Node type Count Memory
(KB)
Avg. execution time (ms)
Conv1Dweights 72 5869.953 244.813 BiasAdd 73 5869.953 244.813 ReLU 72 5869.953 5.700 MaxPool 18 358.848 5.700 Concat 1 892.096 1.081 MatMul 1 4.032 0.660 Softmax 1 4.032 0.660 Reshape 1 0 1.081
B. TOOLBOX REQUIREMENT FOR PROOF OF CONCEPT
In our work, we have successfully enabled the inference stage of a four layer CNN model using pre-trained and optimized deep learning models on mobile devices using the TensorFlow lite (TFlite) [31] library. TFlite is an advanced and lightweight version of the TensorFlow library including the basic operations and functionality necessary in layer-wise neural network based computation and is made use of here as the base deep learning library. Currently, TFlite supports a set of core operations in both floating-point (float32) and quan-tized (uint8) precisions, for which the latter has been tuned for mobile platforms. Since the set of operations supported in TFlite is limited, not every model that is trained using TensorFlow is convertible to TFlite [32]. TFlite works on flat buffers, where TensorFlow uses protocol buffers which are efficient for a cross-platform serialization library but not suitable for embedded implementations [33], [34].
We presented the required stages in the workflow in Fig. 7 where the first block corresponds to training stage of the deep learning model on TensorFlow and the second block encompasses the steps required to get the graph representa-tion inference ready on an embedded platform. The rest of the stages are required for optimization before the model can be deployed on an edge device.
VI. MODEL ANALYSIS FOR OPTIMIZATION
A. MODEL SIZE AND SPEED OF OPERATIONS
For edge computing, only the inference stage of a complex deep learning model needs to be performed on devices with with limited on-board memory, computational power and battery run time. For this reason, we conducted an investi-gation on whether our models could be contained in an edge
computing device’s memory and the total number of floating point operations that are required to execute the frozen graph of the model. Table 5 lists the memory allocation analysis based on the number of node types available on the imple-mented model. The CNN model consumed about 16 MB of memory when transformed and saved in TensorFlow’s protocol buffer (.pb) format. The memory consumption anal-ysis presented in Table 5, indicates the number of operations (ops), and the time consumed to complete these ops. These values provide a decision point at which we can optimize the architecture or select for alternative models to reduce these numbers according to the resource availability on an edge device. The trained models were then optimized and made graph ready to convert to TFlite. We have used TensorFlow’s graph_transforms and summarize_graph to freeze the model and conduct the analysis on the model’s profile and types of operation necessary for inference. Additionally, we have utilized tensorboard’s visualization to evaluate the graph after each step and to identify any unsupported layer that needs custom implementation.
B. MODEL TESTING ON SMARTPHONE
Fig. 8(a) shows ascreenshot of the implemented Android app driven by the optimized deep model on the back-end. Fig. 8(b) shows the absolute power consumption of the implementation. We used Trepn Profiler [35] for these mea-surements. The average absolute power consumption when the app is running in the inference mode is approximately 40 mW. In comparison, the same value measured for YouTube is around 116 mW, which suggests that our HAR android app is relatively low power and computationally effective. For implementing model inference stage on device, we further reduced the model size by compressing weights and/or quan-tize both weights and activations for faster inference, without re-training the model.
C. OPTIMIZATION THROUGH QUANTIZATION
In this section, multiple approaches for model quantization are discussed to demonstrate the performance impact for each of these approaches. All these experimental scenarios were simulated on a conventional computer with a 2.4GHZ CPU and 32GB memory and the quantized model were tested fur-ther on a Samsung A5 2017 smartphone (1.2 GHz quad-core
FIGURE 8. (a) Screen-shot and (b) power profile of the HAR Android app running on a Samsung A5 smartphone.
FIGURE 9. (a) Weight and activation quantization scheme, (b) Memory footprint of various deep learning models in terms of weight and activation.
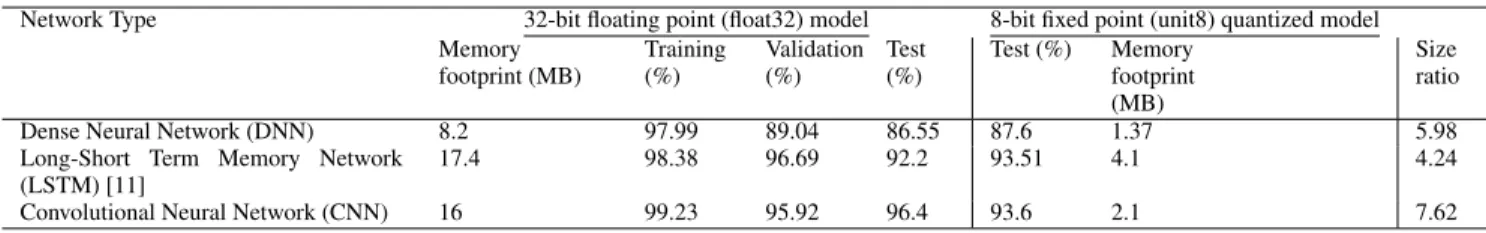
TABLE 6. Change of model accuracy due to quantization, 32-bit floating point model accuracy and 8-bit quantized model accuracy.
Network Type 32-bit floating point (float32) model 8-bit fixed point (unit8) quantized model Memory footprint (MB) Training (%) Validation (%) Test (%) Test (%) Memory footprint (MB) Size ratio
Dense Neural Network (DNN) 8.2 97.99 89.04 86.55 87.6 1.37 5.98
Long-Short Term Memory Network (LSTM) [11]
17.4 98.38 96.69 92.2 93.51 4.1 4.24
Convolutional Neural Network (CNN) 16 99.23 95.92 96.4 93.6 2.1 7.62
CPU with 3GB memory) for its functionality on an activity recognition app using the TFlite library. In a conventional neural network layer implemented in TensorFlow or keras with a floating-point representation, there are a number of weight tensors that are constant and variable input tensors stored as floating point numbers. The forward pass function which operates on the weights and inputs, using floating point arithmetic, storing the output in output tensors as a float. Post-training quantization techniques are simpler to use and allow for quantization with limited data [32], [36]. In this work, we explore the impact of quantizing the weights and activation functions separately. The results for the weight and activation quantization experiments are shown in Fig. 9(b) and Table 6. Moving from 32-bits float to fixed-point 8-bits leads to 4×reduction in memory. Fig. 9(b) shows the actual memory footprint of various learning models such as the dense neural network (DNN), CNN and an LSTM model built using the same dataset. As can be seen from the bar
diagram in Fig. 9(a) and from the memory footprint column in Table 6, the CNN model was 7.62 times smaller in size when post training quantization is applied on the weights and activation of the model. This version would also be more suitable for low-end microprocessors that do not support floating-point arithmetic. Our experiments suggested that we can variably quantize (i.e. discretize) the range to only record some values with float32 that have more significant contribution on the model accuracy and round off the rest to unit8 values to still take advantage of the optimized model. In Table 6, we also observed a slight increase in prediction accuracy for the test dataset for DNN and LSTM models because of the salient and less noisy weight values available in the saved model for activity prediction. The inference time for the optimized and fine-tuned CNN was 0.23 seconds on an average for the detection of a typical activity window. The table also suggests that the minimization of model parameters may not necessarily lead to the optimal network in terms of
performance. This means a selective quantization approach (e.g. using k-means clustering) can make the process more efficient than straight linear quantization.
VII. CONCLUSION
We have presented a deep convolutional neural network model for the classification of five daily-life activities us-ing raw accelerometer and gyroscope data of a wearable sensor as the input. Our experimental results demonstrate how these characteristics can be efficiently extracted by auto-mated feature engine in CNNs. The presented model obtained an accuracy of 96.4% in a five-class static and dynamic activity recognition scenario with a 20 volunteer custom dataset available at the GitHub repository for this research [37]. The proposed model showed increased robustness and has a better capability of detecting activities with temporal dependence compared to models using statistical machine learning techniques. Additionally, the batch normalized im-plementation made the network achieve stable training per-formance in almost four times fewer iterations. The proposed model has further been empirically analyzed for the memory requirement and execution time for its operations with the objective of deploying the model in edge devices such as smartphones and wearables. We observed that most of the size and execution time reduction in the optimized model are due to weight quantization, potentially allowing them to be quantized differently to the activations and allowing further optimizations. In future, we would like to amend and develop time-series counterpart of models with new and efficient architecture similar to shufflenet [24] facilitating pointwise group convolution and channel shuffle, to further reduce computation cost while maintaining accuracy. The proposed model has been validated and successfully implemented on a smartphone. The implementation on the smartphone is utilizing the real-time sensor data to predict the activity, a current limitation of this pre-trained model is that the classification accuracy decreases during activity transition and in case of sensor displacement. In the future, we will drive this implementation on programmable devices such as an ARM Cortex M-series [38] systems and Sparkfun apollo3 edge platforms [6], with further development of the C++ API in TensorFlow Lite framework [31]. The smartphone imple-mentation presented this study could be useful for making smart wearables and devices that are stand alone from the cloud, potentially improving the user privacy.
ACKNOWLEDGMENT
This work was carried out at the University of Manchester and was supported by the UK Engineering and Physical Sciences Research Council grant number EP/P010148/1.
REFERENCES
[1] J. Wang, Y. Chen, S. Hao, X. Peng, and L. Hu, “Deep learning for sensor-based activity recognition: A survey,” arXiv preprint, 2017, 1707.03502. [2] F. Gu, K. Khoshelham, S. Valaee, J. Shang, and R. Zhang, “Locomotion
activity recognition using stacked denoising autoencoders,” IEEE Internet of Things Journal, pp. 1–9, 2018.
[3] C. A. Ronao and S.-B. Cho, “Deep convolutional neural networks for human activity recognition with smartphone sensors,” in International Conference on Neural Information Processing. Springer, 2015, pp. 46– 53.
[4] T. Zebin, P. J. Scully, and K. B. Ozanyan, “Evaluation of supervised clas-sification algorithms for human activity recognition with inertial sensors,” in IEEE Sensors conf., Glasgow, November 2017.
[5] N. Twomey, T. Diethe, I. Craddock, and P. Flach, “Unsupervised learning of sensor topologies for improving activity recognition in smart environ-ments,” Neurocomputing, vol. 234, pp. 93–106, 2017.
[6] “Sparkfun edge development board-apollo3 blue,” 2019. [On-line]. Available: https://learn.sparkfun.com/tutorials/using-sparkfun-edge-board-with-ambiq-apollo3-sdk/all
[7] M. Zeng, L. T. Nguyen, B. Yu, O. J. Mengshoel, J. Zhu, P. Wu, and J. Zhang, “Convolutional neural networks for human activity recognition using mobile sensors,” in Mobile Computing, Applications and Services (MobiCASE), 2014 6th International Conference on. IEEE, 2014, pp. 197–205.
[8] A. Bulling, U. Blanke, and B. Schiele, “A tutorial on human activity recog-nition using body-worn inertial sensors,” ACM Comput. Surv., vol. 46, no. 3, pp. 1–33, 2014.
[9] F. J. Ordonez and D. Roggen, “Deep convolutional and LSTM recurrent neural networks for multimodal wearable activity recognition,” Sensors, vol. 16, no. 1, p. 115, 2016.
[10] C. A. Ronao and S.-B. Cho, “Human activity recognition with smartphone sensors using deep learning neural networks,” Expert Systems with Appli-cations, vol. 59, pp. 235 – 244, 2016.
[11] T. Zebin, M. Sperrin, N. Peek, and A. J. Casson, “Human activity recog-nition from inertial sensor time-series using batch normalized deep lstm recurrent networks,” in 2018 40th Annual International Conference of the IEEE Engineering in Medicine and Biology Society (EMBC). IEEE, 2018, pp. 1–4.
[12] F. Moya Rueda, R. Grzeszick, G. A. Fink, S. Feldhorst, and M. ten Hompel, “Convolutional neural networks for human activity recognition using body-worn sensors,” Informatics, vol. 5, no. 2, 2018.
[13] M. Gochoo, T. H. Tan, S. H. Liu, F. R. Jean, F. Alnajjar, and S. C. Huang, “Unobtrusive activity recognition of elderly people living alone using anonymous binary sensors and dcnn,” IEEE J Biomed Health Inform, 2018.
[14] D. Ravi, C. Wong, B. Lo, G. Z. Yang, and Ieee, Deep Learning for Hu-man Activity Recognition: A Resource Efficient Implementation on Low-Power Devices, ser. International Conference on Wearable and Implantable Body Sensor Networks, 2016, pp. 71–76.
[15] R. Chavarriaga, H. Sagha, A. Calatroni, S. T. Digumarti, G. Troster, J. del R. Millan, and D. Roggen, “The opportunity challenge: A benchmark database for on-body sensor-based activity recognition,” Pattern Recognit. Lett., vol. 34, no. 15, pp. 2033–2042, 2013.
[16] A. Reiss and D. Stricker, “Introducing a new benchmarked dataset for activity monitoring,” in 2012 16th International Symposium on Wearable Computers, June 2012, pp. 108–109.
[17] M. Lichman et al., “Uci har machine learning repository,” 2013. [Online]. Available: https://archive.ics.uci.edu/ml/machine-learning-databases/00240/
[18] N. Y. Hammerla, S. Halloran, and T. Plotz, “Deep, convolutional, and recurrent models for human activity recognition using wearables,” in ACM IJCAI, New York, July 2016.
[19] “MPU-9150 product specification, Invensence Inc, CA, USA,” 2012. [20] O. Banos, J.-M. Galvez, M. Damas, H. Pomares, and I. Rojas, “Window
size impact in human activity recognition,” Sensors, vol. 14, no. 4, pp. 6474–6499, 2014.
[21] J. Liono, A. K. Qin, and F. D. Salim, “Optimal time window for temporal segmentation of sensor streams in multi-activity recognition,” in Pro-ceedings of the 13th International Conference on Mobile and Ubiquitous Systems: Computing, Networking and Services. ACM, 2016, pp. 10–19. [22] F. Chollet. (2013) Keras: The python deep learning library. [Online].
Available: https://keras.io/
[23] A. Doherty, D. Jackson, N. Hammerla, T. Plotz, P. Olivier, M. H. Granat, T. White, V. T. van Hees, M. I. Trenell, C. G. Owen, S. J. Preece, R. Gillions, S. Sheard, T. Peakman, S. Brage, and N. J. Wareham, “Large scale population assessment of physical activity using wrist worn accelerometers: The UK biobank study,” PLoS One, vol. 12, no. 2, 2017. [24] X. Zhang, X. Zhou, M. Lin, and J. Sun, “Shufflenet: An extremely efficient
convolutional neural network for mobile devices,” in Proceedings of the IEEE Conference on Computer Vision and Pattern Recognition, 2018, pp.
6848–6856.
[25] I. Song, H. Kim, and P. B. Jeon, “Deep learning for real-time robust facial expression recognition on a smartphone,” in 2014 IEEE International Conference on Consumer Electronics (ICCE), 2014, pp. 564–567. [26] A. Ignatov, “Real-time human activity recognition from accelerometer
data using convolutional neural networks,” Applied Soft Computing, vol. 62, pp. 915 – 922, 2018.
[27] C. K. Wong, H. M. Mentis, and R. Kuber, “The bit doesnt fit: Evaluation of a commercial activity-tracker at slower walking speeds,” Gait Posture, vol. 59, pp. 177 – 181, 2018.
[28] Y. Huang, J. Xu, B. Yu, and P. B. Shull, “Validity of fitbit, jawbone up, nike+ and other wearable devices for level and stair walking,” Gait Posture, vol. 48, pp. 36 – 41, 2016.
[29] J. Huang, S. Lin, N. Wang, G. Dai, Y. Xie, and J. Zhou, “TSE-CNN: A two-stage end-to-end cnn for human activity recognition,” IEEE Journal of Biomedical and Health Informatics, 2019.
[30] E. Grolman, A. Finkelshtein, R. Puzis, A. Shabtai, G. Celniker, Z. Katzir, and L. Rosenfeld, “Transfer learning for user action identication in mobile apps via encrypted traffic analysis,” IEEE Intelligent Systems, vol. 33, no. 2, pp. 40–53, Mar 2018.
[31] “Tensorflow lite for mobile and embedded learning,” 2019. [Online]. Available: https://www.tensorflow.org/lite/microcontrollers/overview [32] R. Krishnamoorthi, “Quantizing deep convolutional networks for efficient
inference: A whitepaper,” arXiv preprint arXiv:1806.08342, 2018. [33] J. Hanhirova, T. Kämäräinen, S. Seppälä, M. Siekkinen, V. Hirvisalo, and
A. Ylä-Jääski, “Latency and throughput characterization of convolutional neural networks for mobile computer vision,” CoRR, vol. abs/1803.09492, 2018.
[34] A. Ignatov, R. Timofte, W. Chou, K. Wang, M. Wu, T. Hartley, and L. Van Gool, “Ai benchmark: Running deep neural networks on android smartphones,” in Proceedings of the European Conference on Computer Vision (ECCV), 2018.
[35] “Trepn power profiler, qualcomm developer network,” 2019. [Online]. Available: https://developer.qualcomm.com/software/trepn-power-profiler [36] B. Moons, K. Goetschalckx, N. Van Berckelaer, and M. Verhelst, “Mini-mum energy quantized neural networks,” in 51st Asilomar Conference on Signals, Systems, and Computers, 2017. IEEE, 2017, pp. 1921–1925. [37] T. Zebin, “Deep learning demo,”
https://github.com/TZebin/Thesis-Supporting-Files/tree/master/Deep Learning Demo, 2018.
[38] “ARM cortex-m series processors,” 2019. [Online]. Available: https://developer.arm.com/ip-products/processors/cortex-m
TAHMINA ZEBINreceived her first degree and a MS in Applied Physics, Electronics and Commu-nication Engineering from University of Dhaka, Bangladesh. She also completed a M.Sc. in Digital Image and Signal Processing from the Univer-sity of Manchester in 2012 and she has been the recipient of the Presidents Doctoral Scholarship (2013-2016) for conducting her PhD in Electrical and Electronic Engineering. Before Joining as a Lecturer at the University of East Anglia, Tahmina was employed as a postdoctoral research associate on the EPSRC funded project Wearable Clinic: Self, Help and Care at the University of Manchester and was a Research Fellow in Health Innovation Ecosystem at the University of Westminster. Her current research interests include Advanced image and signal processing, Human Activity Recognition, Risk prediction modelling from Electronic Health Records using various statistical and deep learning techniques.
PATRICIA J. SCULLYreceived her PhD degree in Engineering from the University of Liverpool, Liverpool, U.K., in 1992, and reached Reader po-sition with Liverpool John Moores University in 2000. She moved to the University of Manchester as a Senior Lecturer/Associate Professor in Sensor Instrumentation with the University of Manchester in 2002 before moving to NUI Galway, Ireland in 2018. She is experienced in leading industrial and research council/government funded research projects at national and international levels, and has research interests in sensors and monitoring for industrial processes, including optical fibre technology and photonic materials for sensors and devices, ranging from functional chemically sensitive optical coatings, to laser inscribed photonic and conducting structures in transparent materials that affect the properties of light.
NIELS PEEK received MSc degrees in Com-puter Science and Artificial Intelligence in 1994, and a PhD in Computer Science in 2000, from Utrecht University. He is currently Professor of Health Informatics at the University of Manch-ester. His research focuses on data-driven methods for health research, healthcare quality improve-ment, and computerised decision support. He has co-authored more than 200 peer-reviewed scien-tific publications. From 2013 to 2017 he was the President of the Society for Artificial Intelligence in Medicine. In 2018 he was elected fellow of the American College of Medical Informatics and memory consumption and execution time fellow of the Alan Turing Institute, the UK’s National institute for Data Science and Artificial Intelligence.
ALEXANDER J. CASSONreceived the masters degree in engineering science from the Univer-sity of Oxford, Oxford, U.K., in 2006, and the Ph.D. degree in electronic engineering from Im-perial College London, London, U.K., in 2010. Since 2013, he has been a Faculty Member with The University of Manchester, Manchester, U.K., where he leads a research team focusing on next generation wearable devices and their integration and use in the healthcare system. He has published over 100 papers on these topics. He is the Vice-Chair of the IET Healthcare Technologies Network, and a Lead of the Manchester Bioelectronics Net-work.
KRIKOR B. OZANYANreceived the M.Sc. de-gree in engineering physics (semiconductors) and the PhD degree in solid-state physics in 1980 and 1989, respectively. He has more than 300 publications in the areas of devices, materials and systems for sensing and imaging. He is currently Director of Research at the School of EEE, at the University of Manchester, U.K. He is a Fellow of the Institute of Engineering and Technology, U.K, and the Institute of Physics, U.K. He was a Distinguished Lecturer of the IEEE Sensors Council and was Editor-in-Chief of the IEEE SENSORS Journal and General Co-Chair of the IEEE SENSORS Conferences in the last few years.