University of Massachusetts Amherst
ScholarWorks@UMass Amherst
Communication Department Faculty PublicationSeries Communication
2018
Network Visualization and Problem-Solving
Support: A Cognitive Fit Study
Brooke Foucault Welles Weiai Xu
PREPRINT: Welles, B. F., & Xu, W. (2018). Network visualization and problem-solving support: A cognitive fit study. Social Networks, 54, 162-167.
Network Visualization and Problem-Solving Support: A Cognitive Fit Study
Brooke Foucault Welles1 and Weiai Xu2
1Northeastern University 360 Huntington Avenue 204 Lake Hall Boston, MA 02115 USA Phone: (617) 373-7043 email: [email protected] (corresponding author)
2University of Massachusetts at Amherst
N308 Integrative Learning Center 650 N. Pleasant Street Amherst, MA 01003-1100 USA Phone: (413) 545-3519 email: [email protected] Acknowledgements
We would like to thank Alexandra Johnson for her assistance in developing and administering the research study described in this paper. This research was sponsored by the Army Research Laboratory under Cooperative Agreement Number W911NF-09-2-0053. The views and
conclusions contained in this document are those of the authors and should not be interpreted as representing the official policies, either expressed or implied, of the Army Research Laboratory or the U.S. Government.
PREPRINT: Welles, B. F., & Xu, W. (2018). Network visualization and problem-solving support: A cognitive fit study. Social Networks, 54, 162-167.
Abstract
This study examines the relative effectiveness of four different social network
representations for improving human problem-solving accuracy and speed: node-link diagrams, adjacency matrices, tables, and text. Results suggest that visual network representations improve problem solving accuracy and speed, compared with text. Among the visual representations, tables produced superior problem-solving outcomes for symbolic tasks and link-node diagrams produced superior problem-solving outcomes for spatial tasks. These results partially support a cognitive fit model of problem solving support. There is not “one best way” to represent network data. Instead, it is important to match network representations and problem-solving tasks.
PREPRINT: Welles, B. F., & Xu, W. (2018). Network visualization and problem-solving support: A cognitive fit study. Social Networks, 54, 162-167.
Network Visualization and Problem-Solving Support: A Cognitive Fit Study
Network visualizations are used to present complex information to researchers, practitioners, and – increasingly – the general public (Author, 2014). These network
visualizations could, theoretically, enhance a whole host of problem-solving tasks that people face, from the mundane, such as whom to invite to a dinner party, to the consequential, such as whom to reach out to for help in a crisis. However, very little is known about how people interpret network visualizations, nor whether or when network visualizations enhance human problem-solving quality and/or efficiency. In this study, we compare the relative effectiveness of four different network representations – node-link diagrams, adjacency matrices, tables, and text descriptions - for aiding human problem solving. Drawing on the theoretical framework of
cognitive fit, we test whether matching network representations to problem-solving tasks enhances problem-solving quality when people consider relational information.
Network Visualizations
There are a number of ways networks can be represented including, node-link diagrams, matrices, or summary tables. Here, we focus on a specific subset of social networks, where network nodes are people connected by various types of relationships (friends, family,
co-workers, classmates, etc.). These networks are endemic to everyday life, and are often implicated in problem-solving tasks. For instance, if someone is looking for a job, they might interact with a picture of their LinkedIn network to identify contacts in target companies or industries. Or, a military analyst might consult a network matrix to determine if a detainee is affiliated with a terrorist organization.
PREPRINT: Welles, B. F., & Xu, W. (2018). Network visualization and problem-solving support: A cognitive fit study. Social Networks, 54, 162-167.
There is a large mathematical literature on how to visualize social networks (e.g. Battista, Eades, Tamassia, & Tollis, 1998), including studies how network layouts or aesthetics can facilitate accurate interpretations of network graphs (e.g. Dunne & Shneiderman, 2009; H. Purchase, 1997; H. C. Purchase, 1998). However, few studies examine how visualization choices influence interpretations of the context or relational qualities that network visualizations are designed to represent. A series of studies by McGrath and colleagues (Blythe, McGrath, & Krackhardt, 1996; McGrath, Blythe, & Krackhardt, 1996, 1997) are among the limited few that explore how variations in network graphs influence inferences about the social contexts graphs are meant to illustrate. For example, Blythe, McGrath and Krackhardt (1996) investigated how various graph layouts depicting the same professional network influenced students’ inferences about social grouping and the importance of various actors within the network. Even among these relatively knowledgeable students who just finished a graduate course in organizational theory that emphasized network structure, manipulating graph layouts significantly influenced the students’ inferences about importance and connectivity of individual actors and the graph as a whole. Although Blythe and colleagues did not test resulting effects on problem-solving, it follows that any judgments stemming from different inferences drawn from various graph layouts would likewise be influenced.
Cognitive Fit Theory
Despite evidence that graph layout may influence solutions derived from relational data, we know little about precisely how various graph visualizations influence problem-solving outcomes, and less still about how alternate presentations of relational data (such as text or matrices, both common representations of relational data) compare to network graphs as
PREPRINT: Welles, B. F., & Xu, W. (2018). Network visualization and problem-solving support: A cognitive fit study. Social Networks, 54, 162-167.
on Paivio’s (1991) theory of dual coding, which suggests that verbal (words) and non-verbal (images) information are understood through distinct, albeit interrelated, processes. A large body of work has explored the consequences of the words/images divide, much of which focuses on the problem-solving consequences of data represented in tables (words) or graphs (images), with few consistent results (Vessey, 1991).
Frustrated by the lack of consistency in studies of information representation and human problem solving, Vessey (1991) proposed the theory of cognitive fit, which suggests that neither words nor images are inherently better at facilitating problem solving, but rather a good fit
between the problem-solving task and the information representation is most important. That is, according to cognitive fit theory, problem solving is enhanced when the problem-solving task
and the problem representation are aligned. Focusing on comparisons of graphical versus tabular information representations, Vessey argues that data can usually be represented by either a graph or a table, each of which emphasizes different informational features,
“Graphs are spatial problem representations since they present spatially related
information. … they emphasize information about relationships in the data. Tables are symbolic data representations since they present information that is symbolic in nature. Tables represent discrete data values,” (Vessey, 1991, p. 225)
Zhu and Watts (2010) extended this distinction between graphical and tabular
information to include network representations, arguing that network graphs (node-link graphs) are consistent with Vessey’s definition of graphical (spatial) information representations, while matrices and table representations of relational data are consistent with tabular (symbolic) information representations.
PREPRINT: Welles, B. F., & Xu, W. (2018). Network visualization and problem-solving support: A cognitive fit study. Social Networks, 54, 162-167.
Classifying information representations as either graphical or tabular (spatial or symbolic, respectively) is useful, not because one representation is inherently better than the other, but because problem-solving tasks can similarly be classified as spatial or symbolic. Spatial tasks
require observers to make inferences about relationships within data, making comparisons, observing trends, and/or detecting patterns or deviations from patterns. In contrast, symbolic tasks require observers to extract specific values from the data, either through direct observation or carrying out computations on discrete values observed within the data.
Cognitive fit expects that problem solving often includes both spatial and symbolic tasks, and predicts that problem solving will be optimized when problem representations are matched to problem-solving tasks (Vessey, 1991). That is, problems that require judgments about the relationships or patterns within data will be solved quickest and most accurately when data are represented in graphs, while problems that require judgments about discrete values within data will be solved quickest and most accurately when data are represented in tables. Cognitive fit theory is illustrated by the following diagram depicting the problem-solving process:
Fig 1. Illustration of Vessey’s (1991) Cognitive Fit Theory Information
Representation Problem-Solving Task
Mental Representation
PREPRINT: Welles, B. F., & Xu, W. (2018). Network visualization and problem-solving support: A cognitive fit study. Social Networks, 54, 162-167.
Cognitive fit theory predicts that this process will be optimized when the information
representation and problem-solving task are aligned. Extending to Zhu and Watts’ (2010) work on network information representations, cognitive fit theory suggests that node-link graphs may be most effective for problems involving an explicit assessment of relationships, while data tables, may be more effective for problems that involve extracting discrete values from networked data.
The present study aims to empirically test cognitive fit theory using two network data representations: node-link graphs, tables, adjacency matrices, and text, and two types of
problem-solving tasks: spatial and symbolic. Based on the theory of cognitive fit, we expect the following:
H1. For symbolic tasks, problem solving speed and accuracy will be superior when networks are represented as data tables.
H2. For spatial tasks, problem solving speed and accuracy will be superior when networks are represented as node-link graphs.
In addition, because prior research neither explores the effectiveness of two other common relational data representations – adjacency matrices and text – nor classifies them as spatial or symbolic, we propose the following research questions:
RQ1:How effective are adjacency matrices for supporting spatial and symbolic problem-solving tasks?
RQ2: How effective are text descriptions for supporting spatial and symbolic problem-solving tasks?
PREPRINT: Welles, B. F., & Xu, W. (2018). Network visualization and problem-solving support: A cognitive fit study. Social Networks, 54, 162-167.
Methods
Platform
To test the proposed hypotheses and research question, we designed an online experiment called NetIQ. The NetIQ experiment was hosted on Volunteer Science (volunteerscience.com).
Volunteer Science is an integrated website and development platform for deploying web-based single-user and multi-user behavioral experiments. Volunteer Science is a scalable, open, and flexible platform for conducting online experiments (Radford et al., 2015). It has been validated as scientifically and technically accurate for tasks similar to the NetIQ study (Radford et al., 2016). The site is built on top of free open source development tools, including Django, Bootstrap, HTML5, and JavaScript, enabling it to work on any device with modern
web-browsing technologies. It uses Amazon Web Services to provide high-performance and scalable on-demand hosting, and seamlessly ties into Amazon’s Mechanical Turk for participant
recruitment and compensation.
Participants and Procedure
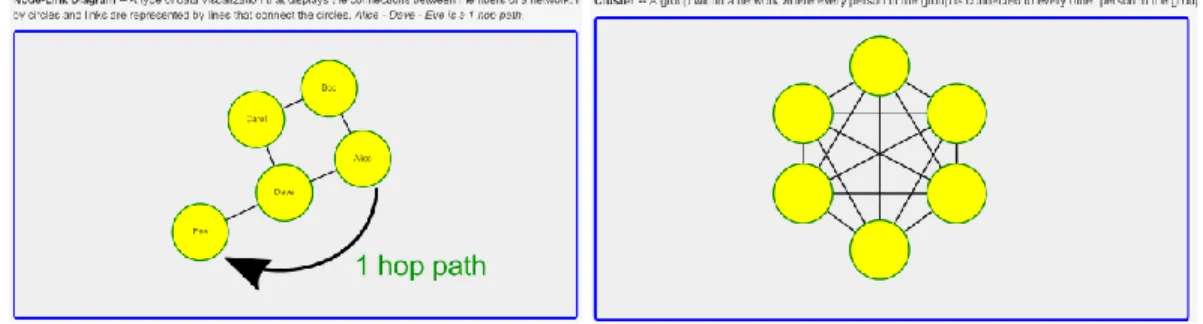
We recruited 223 unique participants via Mechanical Turk and directed them to the Volunteer Science website where they consented to participate in research prior to beginning any research activities1. After consenting to participate, we directed participants to a page that
introduced basic network concepts such as nodes, links, hops, and clusters using appropriate visualizations (see Fig. 2).
1 All research protocols and platforms were reviewed and approved by the IRB at [university name omitted for blind
PREPRINT: Welles, B. F., & Xu, W. (2018). Network visualization and problem-solving support: A cognitive fit study. Social Networks, 54, 162-167.
Fig 2. Instructions for the NetIQ study, illustrating network hops (l) and clusters (r).
Participants were then randomly assigned to one of the four conditions, corresponding to four network representations:
The TABLE condition represented features of network data in a tabular format, similar to Vessey’s (1991) original conceptualization of symbolic data. See Table 1 for a sample.
Table 1. TABLE condition (truncated) in the NetIQ experiment. Network Characteristics
Number of Nodes 15
Number of Links 38
Distinct Groups of 3 or More 2
Node Characteristics
Name Direct Connections Count
Ibrahim Ahmed Lionel Ferns, Nat Ferns 2
Lionel Ferns Ibrahim Ahmed, Nat Ferns, Neal Singh, Marshall Wyman,
Wei Liu, Zeb Mason 6
Nat Ferns Ibrahim Ahmed, Lionel Ferns, Neal Singh, Marshall
Wyman, Wei Liu, Zeb Mason 6
Neal Singh Nat Ferns, Lionel Ferns, Marshall Wyman, Wei Liu, Zeb
PREPRINT: Welles, B. F., & Xu, W. (2018). Network visualization and problem-solving support: A cognitive fit study. Social Networks, 54, 162-167.
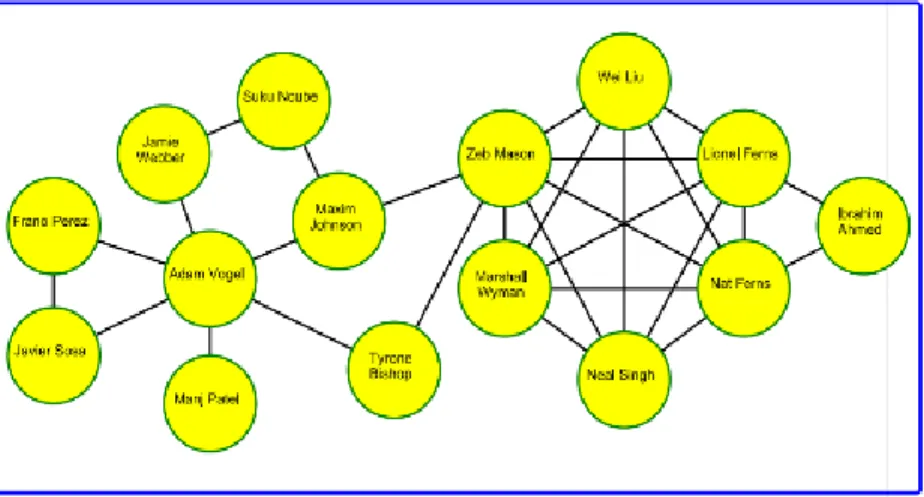
In the NODE-LINK condition (see Fig. 3), network data were presented in a node-link graph, similar to those used by McGrath and colleagues (1996, 1997) in their studies of network graph interpretation.
Figure 3. (l-r)Node-Link Graph and Adjacency Matrix conditions in the NetIQ experiment
In the MATRIX condition (see Fig. 4), network data were represented as a binary adjacency matrix, a representation that has both spatial (relationship) and symbolic (discrete values) properties.
PREPRINT: Welles, B. F., & Xu, W. (2018). Network visualization and problem-solving support: A cognitive fit study. Social Networks, 54, 162-167.
In the TEXT condition, network data were described in a short paragraph, similar to those used by Brashears (2013) in his study of heuristic processing and network recall. A sample paragraph appears below:
Adam Vogel is the founder and organizational leader of Anarchic Calling, a radical political group based in Liverpool that the government has designated as a terrorist organization due to its history of violent attacks. Vogel receives the majority of the group’s funding from Frano Perez and Javier Sosa, a pair of wealthy Argentine business executives who oppose British claims to the Falkland Islands. Jamie Webber, one of the coordinators of Anarchic Calling, was one of the first to join after the group’s formation. As such, he communicates directly with Vogel on all matters. Last year, Webber recruited Suku Ncube to be the organization’s lead propaganda director, which includes such formats as radical books, magazines, YouTube videos, and audio recordings. In creating these materials, Ncube works very closely with Maxim Johnson, who is the group’s primary recruiter. Vogel also communicates directly with Manj Patel, who manages an internet blog for the organization (which serves as an additional means of recruitment). In recent months, Vogel has been working with Tyrone Bishop to coordinate a domestic attack to be carried out at Anfield Stadium during a soccer match. Johnson recruited Zeb Mason, a 26-year old
anti-establishment engineering student, to lead the attack. Mason received his briefing on the plan’s details from Bishop, who also tasked him with forming a small team to assist in carrying out the bombing. The team includes: Marshall Wyman, a fellow extremist who Mason met at political rally; Wei Liu, a 23-year old college dropout who is notorious in the Liverpool underworld for his bomb-making abilities; Neal Singh, a 29 year-old taxi driver who would provide transportation for the mission; and Lionel and Nat Ferns, brothers that Mason met on a radical internet forum who recently served time for assault and battery. Lionel and Nat are tasked with acquiring automatic weapons for the attack, which they will shortly receive from Ibrahim Ahmed, an old prison contact.
Although data were represented differently across visualization conditions, all conditions represented the same network with the same mathematical properties (i.e. same underlying network structure). All representation conditions were pre-tested to ensure it is possible to answer all the questions with any single data representation, although plainly, some
representations make certain network features more or less salient. All conditions described the same context - communication and coordination in a domestic terrorism network. We conducted a pilot test of differences in response accuracy and problem-solving speed across different contexts (i.e., domestic terrorism, small business, families). The pilot test revealed no significant effect of the contextual difference for answer questions in the adjacency matrix and link-node conditions. However, we did find a difference in the text condition (likely due to variable length
PREPRINT: Welles, B. F., & Xu, W. (2018). Network visualization and problem-solving support: A cognitive fit study. Social Networks, 54, 162-167.
of the text descriptions), and therefore elected to hold the context constant across conditions to avoid task difficulty confounds.
After viewing a randomly-assigned data representation for one minute, participants were presented with 16 questions – 8 symbolic and 8 spatial. Sample symbolic (requesting discrete value) questions included, How may people are in the network? and How many distinct groups of 3 or more interconnected people are there? Sample spatial (requesting relationship and
association responses) questions included, How many people are directly connected to Adam Vogel? and If you remove the link from Marshall Wyman and Zeb Mason, then who would Marshall Wyman have to go through to reach Zeb Mason? As they answered these questions, participants had access to the assigned network representation for their condition (e.g. the task did not rely on memory.)
Participants were given a maximum of 10 minutes to answer all 16 questions. After they submitted their answers, or at the conclusion of the 10 minutes (whichever came first),
participants completed a short demographic questionnaire. At the conclusion of the session, participants were given their “NetIQ score” (calculated based on proportion of correct answers) and they were paid for their participant via Amazon Mechanical Turk. All participants received a base payment of $1.00 with the possibility of bonus payment to incentivize correct answers. The average payout per participant was 10 cents per minute spent in the study.
Dependent Variables
Performance was measured two ways. Response accuracy (binary) was measured for each question a participant answered, then we calculated average accuracy scores per participant as the number of correct answers over the number of questions answered. Results are reported as
PREPRINT: Welles, B. F., & Xu, W. (2018). Network visualization and problem-solving support: A cognitive fit study. Social Networks, 54, 162-167.
a percentage of questions answered that were answered accurately. Solving speed was measured as the average amount of time a participant spent per question answered, regardless of the accuracy of their answer.
Results
A total of 223 unique participants completed this study. Of these, 63 were assigned to the adjacency matrix condition, 52 to the text condition, 49 to the node-link condition and 59 to the table condition. Due to the participant attrition on Amazon MTurk, some participants provided answers to only one of the two question types (symbolic and spatial questions). Therefore, the testing of H1 and H2 is based on two datasets. One for spatially-related questions, which contained 201 unique participants and their response-related variables. The second, for symbolically-related questions, has 223 participants. The testing for the research questions is based on a combined dataset with 223 unique participants. Descriptive analyses of the results did not reveal any outlier questions that were particularly easy or difficult, therefore all available questions were used for all analyses. A summary of results across all representation conditions and question types appears in Table 2.
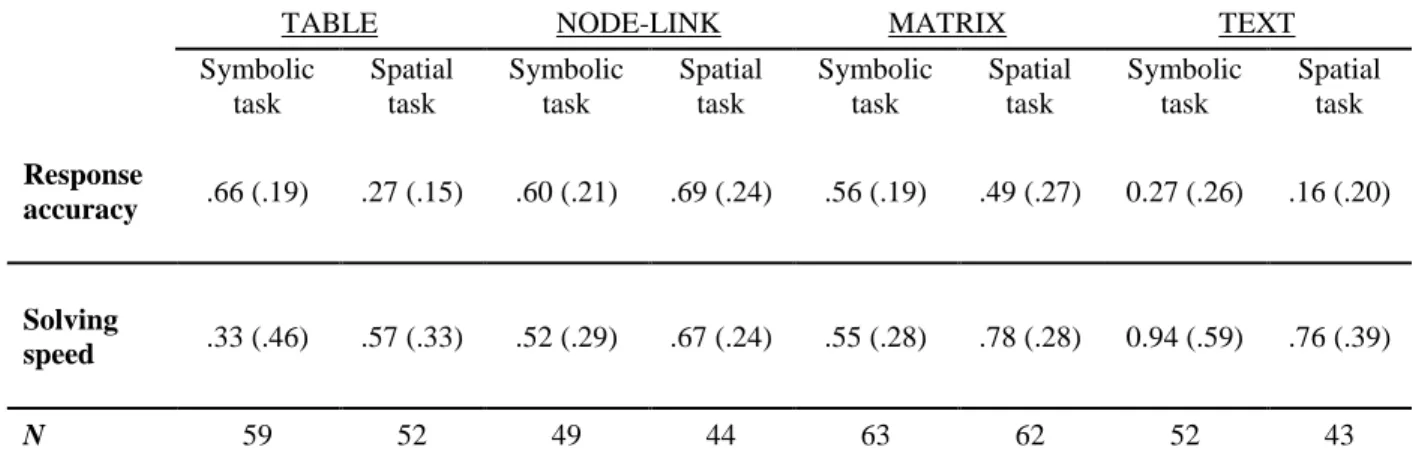
Table 2. Summary Statistics for Response Accuracy and Solving Speed Across Conditions
TABLE NODE-LINK MATRIX TEXT
Symbolic task Spatial task Symbolic task Spatial task Symbolic task Spatial task Symbolic task Spatial task Response accuracy .66 (.19) .27 (.15) .60 (.21) .69 (.24) .56 (.19) .49 (.27) 0.27 (.26) .16 (.20) Solving speed .33 (.46) .57 (.33) .52 (.29) .67 (.24) .55 (.28) .78 (.28) 0.94 (.59) .76 (.39) N 59 52 49 44 63 62 52 43
PREPRINT: Welles, B. F., & Xu, W. (2018). Network visualization and problem-solving support: A cognitive fit study. Social Networks, 54, 162-167.
Symbolic Tasks
Consistent with cognitive fit theory, we hypothesized that problem solving will be most accurate and efficient when information representations and problem-solving tasks are aligned. Hypothesis 1 proposed that for symbolic tasks, problem solving speed and accuracy will be superior when networks are represented as tables. For symbolic tasks, participants in the table condition had the highest overall level of response accuracy (𝑥 = .66; s.d. = .19), followed by the node-link condition (𝑥 = .60; s.d. = .21) and the adjacency matrix condition (𝑥 =.56; s.d. =.19). The text condition was the least effective in producing accurate answers (𝑥 =.27; s.d. = .26). An ANOVA model, F(3, 219)=35.83, p<.001, showed a statistically significant differences between the four network representation conditions. Pairwise comparisons revealed that response
accuracy in the text condition was significantly lower than in all other conditions, and response accuracy in the table condition was significantly higher than in the text condition and the
adjacency matrix condition. Response accuracy in the table condition did not differ significantly from the node-link condition. The node-link and adjacency matrix conditions did not produce significant differences in problem-solving accuracy. Thus, we find limited support for
Hypothesis 1. The table condition did produce superior problem-solving accuracy compared with text and adjacency matrices. However, it was not significantly better than the spatial
representation (node-link diagrams).
In terms of problem solving speed, participants in the text condition registered the slowest average response per question (𝑥 =.94; s.d. = .59), followed by the adjacency matrix condition (𝑥 =.55; s.d. = .28), node-link condition (𝑥 =.52; s.d. =. 29) and the table condition (𝑥 =
PREPRINT: Welles, B. F., & Xu, W. (2018). Network visualization and problem-solving support: A cognitive fit study. Social Networks, 54, 162-167.
.33; s.d. = .46). The ANOVA model was significant, F(3, 219) = 19.84, p=.001, with all conditions significantly different from one and another, except for the pair-wise comparison between the node-link condition and the adjacency matrix condition, which did not differ significantly. Therefore, we find support for the Hypothesis 1 on problem-solving speed. The table condition produced the fastest problem-solving on symbolic tasks compared with all other conditions.
Spatial Tasks
Hypothesis 2 proposed that for spatial tasks, problem-solving speed and accuracy will be superior when networks are represented as node-link graphs. The ANOVA model, F(3, 197) = 51, p<.001, supported the hypothesis. The node-link condition had the highest level of accuracy (𝑥 =.69; s.d. = .24), followed by the adjacency matrix condition (𝑥 = .49; s.d. = .27), the table condition (𝑥 =. 27; s.d. = .15) and the text condition (𝑥 =.16; s.d. = .20). All pair-wise
comparisons were statistically significant. Therefore, we found support for Hypothesis 2 on problem-solving accuracy.
In terms of solving speed, the table condition had the fastest solving speed (𝑥 =.57; s.d. = .33), followed by the node-link condition (𝑥 =.67; s.d. = .24), the text condition (𝑥 = .76; s.d. = .40) and the adjacency matrix condition (𝑥 =.78; s.d. = .28). The ANOVA model was significant, F(3, 197) = 4.94, p<.05. The table condition was significantly superior to the text and the
adjacency matrix conditions. No other pair-wise comparisons were significant. Therefore, we found no support for hypothesis two on problem-solving speed – the table condition (a symbolic representation) produced the fastest responses to both spatial and symbolic questions.
PREPRINT: Welles, B. F., & Xu, W. (2018). Network visualization and problem-solving support: A cognitive fit study. Social Networks, 54, 162-167.
Research Question 1 asked how well a binary sociomatrix – a common, yet under-examined way to represent network data – supported spatial and symbolic problem solving. Results reveal poor performance overall, as participants in the matrix condition had the second lowest accuracy on symbolic questions (𝑥 =.55; s.d. = .28) and significantly lower accuracy on spatial questions compared with those in the node-link condition (𝑥 = .49; s.d. = .27), although matrix condition participants’ accuracy was significantly better than those in the table and text conditions. In terms of problem-solving speed, the matrix was the second slowest overall for symbolic questions (𝑥 =.55; s.d. = .28), and the slowest on spatial questions (𝑥 =.78; s.d. = .28). Although speed did not differ significantly from other under-performing representation
conditions, the overall trend suggests that matrix representations are not effective visualizations for supporting spatial or symbolic problem-solving, though directionally they are more effective for spatial tasks than symbolic tasks.
Finally, we proposed a research question to investigate the relative benefit of any visual data representation over a text-based representation of the same network. The combined dataset, which contained 233 unique participants and their answers on both spatially and symbolic
questions, showed that participants in the text condition scored the lowest accuracy level (𝑥 =.27; s.d. = .26), and text was significantly different from all other conditions at p<.001 level. For solving speed, the text condition had a significantly lower level of speed (𝑥 =.94; s.d. = .59), compared to all other conditions. Thus, we conclude that text is inferior to the other network representation conditions for problem-solving accuracy and speed.
PREPRINT: Welles, B. F., & Xu, W. (2018). Network visualization and problem-solving support: A cognitive fit study. Social Networks, 54, 162-167.
Thanks to a proliferation of data, improved network analysis and visualization tools, and increased awareness of the influence of networks in our lives, we increasingly see visual
representations of networks designed for scholars, practitioners, and the general public. Although these visualizations have some intuitive appeal for organizing and representing
relational data, there is little empirical research investing whether and how they help people draw accurate conclusions about the data they represent. This study extends the literature on network visualization and problem solving by examining the relative effectiveness of four different network representations on problem-solving accuracy and speed.
Based on a cognitive fit framework, we expected that matching network representations to question types would produce superior outcomes. Specifically, we expected that symbolic network representations such as tables that summarize network data into discrete values would be better suited for symbolic tasks that ask for discrete value responses. In contrast, spatial network representations such as node-link graphs that use visual elements to highlight relationships and patterns within the data would be better suited for spatial tasks that ask for relational and/or pattern responses.
Results of our online, between-subjects study provided partial support for our cognitive fit hypotheses. In terms of response accuracy, we found that tables (a symbolic representation) produced the most accurate responses for symbolic questions, while node-link graphs (a spatial representation) produced the most accurate responses for spatial questions. In the case of spatial questions, the difference was substantively important – resulting in an average of 1.5 additional correct answers when the representation matched the task. The marginal difference for symbolic questions was smaller – about half a question on average. But, improved accuracy under
PREPRINT: Welles, B. F., & Xu, W. (2018). Network visualization and problem-solving support: A cognitive fit study. Social Networks, 54, 162-167.
The results for problem-solving speed were inconsistent with a cognitive fit model. The table condition produced the fastest responses, regardless of accuracy, across all question types. This may be because tables, with a legacy of use in scientific communication for a wide variety of audiences, are most familiar for many people. People may feel more confident navigating data tables, and therefore be less likely to spend time checking their work (a possibility at least
partially confirmed by the fact that tables produced faster but less accurate responses on spatial questions). It is also possible that the table reduced the cognitive complexity of some questions, particularly symbolic questions requesting discrete values. Although it was possible to answer all the questions using any of the network representations, some of the representations such as node-link graphs required participants to do some mental calculations to derive discrete response values. For instance, to answer the symbolic question “How many distinct groups of 3 or more interconnected people are there?” using a link-node graph, participants had to first visually identify distinct groups of three, and then tally a total count in their heads. Although not a difficult task, it may take more time than simply reading the value from a table. Indeed, we do see the most substantial time improvements on symbolic questions, with the table taking on average almost 20 second less than then next-fastest condition.
Although adjacency matrices are popular ways to represent data in scientific and military work, their efficacy compared with other types of network data representations had not been empirically tested. We found that adjacency matrices produced worse problem-solving results in terms of accuracy and speed across both task conditions. Adjacency matrices produced worse performance than any of the other network representations except for text, although results were somewhat more promising for spatial tasks, suggesting that the matrices may be more like spatial representations than symbolic representations. Teasing out this distinction in future studies will
PREPRINT: Welles, B. F., & Xu, W. (2018). Network visualization and problem-solving support: A cognitive fit study. Social Networks, 54, 162-167.
be important for appropriately positioning the potential of adjacency matrices for problem-solving support.
It is possible that adjacency matrices, although common in the scientific literature on networks, are simply too unfamiliar for a lay reader to use effectively. Although we did provide instructions to aid participants, adjacency matrices are infrequently used to communicate
relational information outside of the scientific and select professional communities, and therefore may have presented too high a learning curve to improve problem-solving outcomes on this short task, relative to the other visual representations. Future studies could use simplified versions of adjacency matrices – perhaps using color-coded squares, rather than binary values – to see if a more intuitive version of this form of network data representation would produce better results.
There are some limitations to this study – notably, the task was short, relatively easy, and minimally consequential for participants. We intentionally limited the size of the stimulus network to 15 nodes to avoid exceeding participants’ cognitive capacity (Brashears, 2013). This had the advantage of mitigating the confound of variance in participants’ cognitive abilities, but limits our ability to generalize to larger networks (including many networks that people engage with in everyday life). Further, the study design did not rely on participants’ working memories, limiting our ability to speak to the tie recall issues noted elsewhere in the social network
literature (e.g. Brewer, 2000). Future studies might address these issues by working with larger networks and/or removing the network representations following a viewing period, to test how working memory and compression heuristics alter problem-solving results.
The results nevertheless offer import insights for the use of visual representations of network data. Visual network representations of any type produced superior problem-solving
PREPRINT: Welles, B. F., & Xu, W. (2018). Network visualization and problem-solving support: A cognitive fit study. Social Networks, 54, 162-167.
problem solving. Our findings suggest there is no “one best way” to represent network information. Instead, matching network representations to tasks produces the most accurate outcomes. These findings have implications for the appropriate visualization of network data, suggesting either the implementation of different data representations for different tasks (i.e. table summaries for some tasks and node-link graphs for other tasks), or the development of smart interfaces that can prioritize appropriate data representations depending on the problem-solving task someone aims to complete. Future studies of more complex networks, additional representation dimensions such as dynamic representations, and/or problem solving under more naturalistic (non-laboratory) settings could further aid our understanding of how network visualizations can best be used to facilitate human problem solving.
PREPRINT: Welles, B. F., & Xu, W. (2018). Network visualization and problem-solving support: A cognitive fit study. Social Networks, 54, 162-167.
References
Author, 2014. Omitted for Blind Review.
Battista, G. D., Eades, P., Tamassia, R., & Tollis, I. G. (1998). Graph Drawing: Algorithms for the Visualization of Graphs: Prentice Hall PTR.
Blythe, J., McGrath, C., & Krackhardt, D. (1996). The Effect of Graph Layout on Inference from Social Network Data. Paper presented at the Proceedings of the Symposium on Graph Drawing.
Brashears, M. E. (2013). Humans use compression heuristics to improve the recall of social networks. Scientific Reports, 3.
Brewer, D. D. (2000). Forgetting in the recall-based elicitation of personal and social networks. Social networks, 22(1), 29-43.
Dunne, C., & Shneiderman, B. (2009). Improving graph drawing readability by incorporating readability metrics: A software tool for network analysts. University of Maryland, HCIL Tech Report HCIL-2009-13.
McGrath, C., Blythe, J., & Krackhardt, D. (1996). Seeing groups in graph layouts. Connections, 19(2), 22-29.
McGrath, C., Blythe, J., & Krackhardt, D. (1997). The effect of spatial arrangement on judgments and errors in interpreting graphs. Social Networks, 19(3), 223-242. Paivio, A. (1991). Dual coding theory: Retrospect and current status. Canadian Journal of
Psychology/Revue canadienne de psychologie, 45(3), 255.
Purchase, H. (1997). Which aesthetic has the greatest effect on human understanding? Paper presented at the Graph Drawing.
PREPRINT: Welles, B. F., & Xu, W. (2018). Network visualization and problem-solving support: A cognitive fit study. Social Networks, 54, 162-167.
Purchase, H. C. (1998). Performance of layout algorithms: Comprehension, not computation.
Journal of Visual Languages & Computing, 9(6), 647-657.
Radford, J., Keegan, B., Hoye, J., Karbeyaz, C., Ognyanova, K., Foucault Welles, B., . . . Lazer, D. (2015, May 26-29, 2015). Conducting Massively Open Online Social Experiements with Volunteer Science. Paper presented at the International Conference on Web and Social Media (ICWSM), Oxford, UK.
Radford, J., Pilny, A., Reichelmann, A., Keegan, B., Welles, B. F., Hoye, J., . . . Lazer, D. (2016). Volunteer Science: An Online Laboratory for Experiments in Social Psychology.
Social Psychology Quarterly, 79(4), 376-396.
Vessey, I. (1991). Cognitive fit: A theory-based analysis of the graphs versus tables literature.
Decision Sciences, 22(2), 219-240.
Zhu, B., & Watts, S. A. (2010). Visualization of network concepts: The impact of working memory capacity differences. Information systems research, 21(2), 327-344.