76
The Relationship between Public Expenditure, Corruption and
Poverty in Nigeria
Ali Madina Dankumo1 Suryati Ishak2, Yasmin Bani3 and Hanny Zurina Hamza4 1Department of Economics and Development Studies, Federal University of
Kashere, PMB 0182, Gombe, Gombe State of Nigeria
2, 3 and 4 Faculty of Economics and Management, Universiti Putra Malaysia,
Malaysia
Corresponding E-mail: kumotito@yahoo.co.nz
Received: August 10, 2018; Accepted: January 2, 2019; Published: March 31, 2019 Permalink/DOI: http://dx.doi.org/10.17977/um002v11i12019p076
Abstract
Poverty affected about 67% of Nigerians who have poor means of livelihood, such as lack of food, poor health services, low education, lack of shelter etc. Government, through its expenditures, have tried to provide public goods in order to improve welfare and reduce poverty, but yet no meaningful outcome as this expenditures are mostly affected by bureaucratic bottlenecks that causes delay and corruption. This paper investigated the impact of public expenditures and corruption on poverty in Nigeria, to see whether corruption ‘greases or sands the wheels’ of public expenditure on impacting poverty. Sources of data; CBN and NBS, Nigeria, and World Bank for 21 years (1996-2016) using ARDL bounds test. The findings revealed a long run negative relationship between expenditures and poverty, with only expenditures on economic been significant, while that of social sector is not, meaning of the former impact while the later does not impact. Corruption is positively related to poverty, as CPI increases, the poverty rate also increases, because the increase remains below 30 (still < 50), thereby, making the public expenditure not to impact on poverty. Hence, ‘sanding the wheels’. The study suggested some measures to enhance CPI if poverty is to be reduced by public expenditure.
Keywords: Public Expenditure; Corruption; Poverty
JEL Classification: H53, I32, D73
INTRODUCTION
Poverty is a global issue that is attracting the attention of both the governments and non-governmental organisations around world over. Sen (1981) sees poverty as a matter of deprivation that could be absolute denial of basic necessities of life or relative when it is compared with the standard of living enjoyed by other group of people in the society with high income. United Nations in 1995, perceived poverty as a situation of severe inadequacy of basic necessities of life such as food, clothing, shelter, education, safe drinking water and sanitation facilities. On the other hand, World Bank defined extreme poverty as one’s inability to live on or above US$1.90 a day.
Poverty can be said to exist if the people of a particular society do not achieve a specified level of welfare that are accepted as a minimum standards of
77
that society (Ravallion, 2017). Based on World Bank’s estimation in 2018, the consumption levels of 1.4 billion people world over was below US$1.25 per day whereas 2.7 billion below US$2 per day (World Bank, 2018c). Even though, there has been progress in reducing poverty, by reducing 1990 poverty rate by half in 2015, but despite this achievement, the number of extreme poor world over remains high. Given this scenario with the World growth forecasts, reducing extreme poverty may not be quickly achieved by the year 2030. Even as the rates continued to decline, the progress seems to be uneven: for instance in East Asia and Pacific-47million and Europe and Central Asia-7million, poverty have declined by 3%, making it possible to achieve the target by 2030. On the other hand, Sub Saharan Africa house more than half of the world extreme poor, because the number of poor increased by 9million in the region to 413million people surviving on US$1.90 per day in 2015, which is more than the total of all the regions. If this trend continues up to 2030, about 9/10 of the world poor will be in Sub Saharan Africa (World Bank, 2018a).
Poverty in Nigeria affects about 67 per cent of the population who have insufficient means of supporting their families (World Bank, 2018). World Food Programme have spent $126million on food assistance in Nigeria, yet majority are hungry. Poverty in Nigeria has continued to rise; with about 100million people surviving on less than $1.90 per day, in spite of a recorded economic growth (World Development Indicators, 2017). According to the National Bureau of Statistics (NBS, 2012b) in 2010, 70 per cent of Nigerians lived in absolute poverty, indicating a rise from 54.7 per cent in 2004. This unfortunate situation is seen in a country that happens to be the largest oil producer in Africa and the seventh in the world, even though the sector has been marred by accusations of corruption. NBS, (2012a) said, a Nigerian situation is a paradox because as Nigeria is growing from strength to strength the citizens are getting poorer. For instance, North-West and North-Eastern part of the country recorded 77.7 per cent and 76.3 per cent poverty rate respectively, while the South-Western part recorded 59.1 per cent, this variation could be attributed to having better access to healthcare facilities, education and so on.
Poverty can be reduced when government spend in order to provide public goods and services to the populace, which is regarded as a necessary ingredient for poverty reduction. The government does this through its planned expenditure with taxes collected from various sources and expended on activities that are pro-poor, like the economic and social sectors of the economy. Public spending is vital to reducing poverty, according to Keynes (1936), public spending increases aggregate demand that later oils economic growth, provide employment and raise income. Sen, (1999) was in affirmative, when he reiterated public spending on infrastructures like education, agriculture, health, energy, rural development, and transport and communication etc. hence, the need for public expenditure to be increased and effectively expended. Budgetary allocation is a vital means through which government can spur economic growth and reduce some level of extreme poverty, in fact, it became more noticeable when donor agencies that are supporting Highly Indebted Poor Countries (HIPC) debt freedom, made increase public spending on pro-poor programmes as one of the conditions for any debt relief in the year 1996 (Wilhelm & Fiestas, 2005).
78
Government expenditure is very vital to reducing poverty, especially when it is made on projects that are pro-poor like, education, health and so forth, sometimes referred to as public goods because allowing market forces to allocate them will leave the poor inconsequential. Edrees et al. (2015), after investigating the impact of public expenditure on poverty reduction, concluded that; public spending on health and education has a positive and significant impact on poverty reduction. Ritwik & Joydeb, (2016), concurred this after examining the impact of public expenditures, economic growth and poverty alleviation in India, concluded that expenditures on infrastructures like roads, irrigation, power, transport and communication, increase per capita income and incidence of poverty is also lowered. Government expenditures in Nigeria have kept on fluctuating, but it is averaged at N892.80 Billion from 1996 to 2016, with the highest expenditure of N1795.78 Billion in 2013 and the lowest of N146 Billion in 1996 (CBN, 2016). Despite the increased Public expenditure, the proportion of Nigerians living in poverty kept on increasing year by year. This situation is worrisome, no wonder, United Nations, (2016) report on Nigeria’s Common Country Analysis (CCA), described it as one of the poorest and unequal countries in the world, with over 80 Million of her population living below poverty line.
In Nigeria, all the government tiers (federal state and local) have played a significant part in trying to achieve the desired targets through their various expenditures with the expectation that it will impact positively. But to our dismay, the rate of poverty continues to rise, this is corroborated by Gukat & Ogboru, (2017) after studying the impact of public spending on economic growth, revealed that government spending has not been converted into meaningful economic growth in Nigeria, let alone increasing income that will reduce poverty . However, once this expenditure’s structure or its implementation is swayed by some bureaucratic bottlenecks, mostly manifested in corruption, this objective tends to be futile. Obadan, (2001) confirmed it when he opined that despite interests shown by previous governments to reduce poverty through various programmes and policies, the rate of poverty have continued to rise over the years. He suggested factors that militated against it as; high rate of corruption, lack of political will, bad governance etc.
The information on the relationship between expenditure and poverty in Nigeria is provided in Fig.1 below. Generally the table demonstrate an upward trend in both the expenditures, while the poverty rate continues to fluctuate more higher, instead of falling.
0 1 2 3 4 1 9 9 61 9 9 71 9 9 81 9 9 92 0 0 02 0 0 12 0 0 22 0 0 32 0 0 42 0 0 52 0 0 62 0 0 72 0 0 82 0 0 92 0 1 02 0 1 12 0 1 22 0 1 32 0 1 42 0 1 52 0 1 6
PUBLIC EXPENDITURE AND POVERTY
79
Fig 1. Relationship between expenditure (economic and social sectors) and
poverty in NigeriaSource: Author’s computation using data from CBN, NBS and
World Bank, 2018.
According to World Bank (1994), Corruption is an abuse of public office for personal benefit, even though; this definition does not discharge and acquit the private sector from been corrupt, especially when it comes to procurement or hiring in large companies, especially multinationals. Wei, (2001) suggested that corruption tilts the structure of government expenditure away from desired education and healthcare, simply because, the extraction of rents is very difficult. Del Monte & Papagni, (2007) asserted that public spending on consumable goods and services has the potentiality of causing corruption. Corruption is the process of influencing government policies and decisions for one’s benefit (Shleifer & Vishny, 1993). It became obvious when Oxfam confirmed that poor people in Nigeria don’t benefit from its wealth, due to a high level of corruption. For instance, public office holders stole the sum of $20 trillion from the government treasury between 1960 and 2005 (Oxfam, 2017).
Pathetically, corruption in Nigeria, is seen as a systematic way of our daily life and even incorporated in our daily business of life, which is regarded as a respect for our local traditions, even by multinational corporations (Transparency International, 2017). Corruption in the public sector often exacerbates conditions of poverty (low income, poor healthcare and education status, bad roads, poor agricultural policies etc.) in countries that are already struggling with the strains of economic growth, democratic transition, and bad governance like Nigeria. However, countries experiencing chronic poverty are seen as a natural breeding grounds for systemic corruption in order to bridge the social and income inequalities.
Nigeria is known both globally and locally as been one of the corrupt countries and poverty stricken-countries of the World. It has already been established that there is a correlation between corruption and increased level of poverty in Nigeria. Past and present governments have intensified effort in investigating alleged corruption malpractices committed by former Ministers, Governors and Advisers. Several measures are also taken to incorporate anti-corruption precautions into government’s institutional framework, starting with whistle blower policy in 2016, aimed at exposing all kinds of corrupt practices and as well joining the Open Government Partnership (OGP) gears toward enhancing transparency and accountability in the affairs of government for comparison with the international best practices. Despite all these efforts, the corruption index still remains high at 27 in 2017, which is less than 50 (Transparency International, 2018). Nigeria is poor because of the corrupt attitude of the government and unless the public resources are not stolen through the use of public power, it will continue to remain poor.
Some, studies conducted on corruption by (Mauro, 1997; Tanzi & Davoodi, 1998; Treisman, 2000; Méon & Sekkat 2005; Osei‐Tutu, Badu & Owusu‐Manu, 2010; Timofeyev, 2011; Aigheyisi, 2015; Ovat & Bassey, 2014 and Olarewaju, 2016) all affirmed that, corruption is negatively linked to the level of investment, economic growth, efficiency in social spending “sands the wheels” of growth, output growth, rising incidence of poverty. According to these studies, some of the corruption faces are kickbacks, bribery, tender manipulation,
80
embezzlement and conflicts of interest which influences the allocation of project and selection of contractors. On the contrary, Mallik and Saha, (2016), shows that corruption is not always growth-unsupportive; but growth-supportive for some countries, thereby supporting the greasing the wheels hypothesis. (Aluko, 2009; Ikubaje, 2014; Duru, 2012; Dukku, 2012) examined the policies designed by government to tackle corruption, concluded that, all efforts has failed to curb corruption which aggravate poverty. According to Fokuoh, (2008) and Omagbon, Enofe & Oriaifoh, (2016) , corruption directly impedes poverty reduction and that an insignificant positive relationship exists between corruption with unemployment and poverty in Nigeria. It became obvious when Oxfam confirmed that poor people in Nigeria don’t benefit from its wealth, due to a high level of corruption. For instance, public office holders stole the sum of $20 trillion from the government treasury between 1960 and 2005 (Oxfam, 2017).
The major concern of this research is, funds earmarked for the provision of infrastructural facilities like education, healthcare, roads, infrastructure, agriculture, roads etc. for the public interest which are been diverted by corrupt officials in charge of procurement, implementation and supervision which does not only cause poverty but also increased it. This situation should not be in an oil rich country like Nigeria, the seventh largest oil exporter in the World and a blessed country with abundant natural and human resources. All these are happening because of corruption, a cankerworm that has eaten deep into the fabrics and garments of the Nigerian society for many decades, in spite the establishment of all kinds of anti-graft agencies like EFCC, ICPC, and Code of Conduct Bureau, the corruption kept on changes it faces and forms that may not be perceived let alone punishing the offenders.
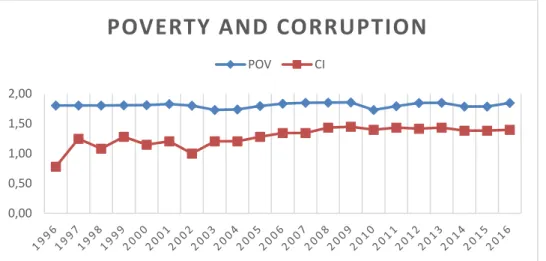
The information on the relationship between corruption and poverty in Nigeria is provided in Fig.2 below. the figure shows poverty is increasing in an upward trend despite an evidence of increase CI, but remains below 30, which is still depicting a corruption existence, since it is below 50 (at least clean). One interesting feature is that poverty fluctuate in the same altitude with corruption, showing an evidence of positive relationship.
Fig 2. Relationship between corruption and poverty in Nigeria
Source: Author’s computation using data from CBN, NBS and World Bank, 2018. 0,00
0,50 1,00 1,50 2,00
POVERTY AND CORRUPTION
81
This topic is called for, because poverty is high in Nigeria, despite continues increase of government expenditures. Hence, the conclusion by Odior, (2014), that Nigeria will find it difficult to achieve the United Nation’s (MDGs) target of reducing poverty from 54.4 per cent to 21.45 per cent by the year 2015 and even beyond. However, many studies have examined the impact of public spending on economic growth and reduction of poverty. Their outcomes differ significantly in detecting the impact and efficiency of expenditures as it is restricted by numerous factors that need to be clearly understood, so as to know what other measures to be taken by the government in order to achieve its purpose.
METHOD
The data on public expenditure (on economic and social sectors) were sourced from Central Bank of Nigeria (CBN) statistical bulletin, while poverty rate (headcount ratio) was extracted from National Bureau of Statistic (NBS) publications, Nigeria and World Development Indicators (WDI) by the World Bank, while Corruption perception index (0- highly corrupt and 100-clean) was sourced from Transparency International database. In order to estimate the impact of public expenditure and corruption on poverty in Nigeria, the study used a linear model which is in tandem with the Keynesian model that shows increase government expenditure spur economic growth, ceteres paribus, increase income that will translate into poverty reduction. The model was modified to include corruption component. The modified Keynesian model specification of the long-run relationship between public expenditure, corruption, and poverty is given below:
POVt = 𝑓 (GEX, CI) ……… (1) The above equation (1) shows that poverty is the function of Government expenditure and corruption, which is explicitly described as; a change in the poverty rate is brought about by a change in Government expenditure (on Economic services (EXE) and Social services (EXS)) and corruption (CI).
The above equation (2) can thus be transformed into a regression function as given below:
POVt = α0+ β1EXEt+ β2EXSt+ β3CIt+ εt………... (2) Where: POV is the poverty rate as the percentage of population below the official poverty line i.e. poverty ratio, 𝛂𝟎is the constant term,EXE is government expenditures on the Economic sector (Agriculture, Construction, Transport & Communication, Other economic services) and EXS is government expenditure on social services sector (education, health and other social and community services), CI is corruption perception index and 𝜺𝒕= Error term
β1, β2and β3, are the coefficients of the explanatory variables
a priori expectation; β1, β2 and β3 should be < 0
The study used the bounds test suggested by Pesaran et al. (2001), the ARDL considering the time frame and also because estimators from ARDL
long-82
run coefficient are reliable even in small sample size. Narayan, (2005) also provided some critical values of F-test for integration for samples of 20-80 observations. This study used a short time-series of 21 annual observations from 1996-2016. The study used ARDL bound tests to determine the long-run relationship between public expenditure and poverty. The justification for using 21 years was because the data on corruption perception index by TI starts from 1996. Thus, the ARDL long-run equation model of poverty as the dependent variable with public expenditure and corruption as independent variables is given below;
∆POVt = 𝛼0+ 𝛽1𝑃𝑂𝑉𝑡−1+ 𝛽2𝐺𝐸𝑋𝐸 + 𝛽3𝐺𝐸𝑋𝐸𝑡−1+ 𝛽4𝐺𝐸𝑋𝑆 + 𝛽5𝐶𝐼 +
𝛽6𝐶𝐼𝑡−1+ ∅1𝑃𝑅𝑡−1+ ∅2𝐺𝐸𝑋𝐸𝑡−1+ ∅3𝐺𝐸𝑋𝐸𝑡−1+ ∅4GEXS + ∅5CI +
∅6𝐶𝐼𝑡−1+ εt………….. (3)
In this equation,𝜷𝒊′𝒔 are the short-run coefficients, ∅𝒊′𝒔, denote the ARDL long-run coefficients, while 𝜺𝒕 is an error term (pure white noise). ARDL models and its related ECM were estimated using OLS method. This has provided the basis for measuring the behaviour of the variables at the short-run and the speed of adjustment back to the long run steady position after a shock.
RESULTS AND DISCUSSIONS
This section contains the result of the study. It started with the description of the relationship between poverty, public expenditures and corruption in Nigeria for the period 1996 to 2016. Public expenditures (the expenditure on economic and social sector), poverty is poverty rate while corruption measured by corruption perception index.
Table 1. Descriptive Statistics of the Variables Poverty rate Expenditure on Economic Sector Expenditure on Social Sector Corruption Index Mean 64.20 488.49 424.31 20.12 Maximum 71.60 974.95 998.78 28 Minimum 53.46 122.58 24.25 6 Std. Dev 5.61 268.55 353.52 6.28 Source: Authors (2019)
The data presented in Table 1, shows that poverty in Nigeria continued to increase between 1996 and 2016 reaching a high of 71.60 per cent in 2009 and falling drastically to 52.46 in 2010, but averagely remaining at 64.20 per cent. Expenditure on economic sector reached N998.78M in 2010 from N122.58M in 1996 but averagely stood at N488.49M. Expenditure on social sector reached its highest of N974.95M in 2013 from N24.25M in 1996, whereas corruption perception index reached its highest level of 28% in 2009 from 6% in 1996, but averaged at 20.12 per cent, which is still categorised as being corrupt i.e. less than 50.
To determine the long-run relationship, the study employed ARDL Bound tests by Pesaran et al. (2001). Testing for the level of stationarity is necessary because ARDL is only employed where variables are stationary at I (0) or I (1)
83
and none is I (2). For this purpose, the study employed the Augmented Dickey-Fuller (ADF) and Phillips-Perron (PP) unit root tests to check for the stationary of the data series. ADF and PP tests results are presented in Table 2.
Table 2. Results of the Unit Root Test
ADF PP
Variable Constant Const. & Trend Constant Const. & Trend Levels I(0) povt -3.919*** -4.088 -2.641 -2.705** exet -1.652 -1.674 -1.652 -1.739 exst -3.142** -1.652 -0.404 -1.849 cit -2.241 -3.245** -2.254 -3.534*
First Difference I(1)
povt -4.440** -4.267** -6.087 -6.013
exet -4.437** -4.430** -4.437** -4.430**
exst -3.536** -3.383* -3.522** -3.366*
cit -6.030** -5.679** -6.199** -6.001***
Note: The numeric are the t-statistics value of the variables, whereas ***, ** and * denotes significant at 1%, 5% and 10% significance level, respectively. It is therefore obvious that all the variables are stationary at 5% levels and with a restricted constant for both the ADF and PP unit root test.
Source: Authors (2019)
From the Table 2, both the ADF and PP test results, it the data series stationarity at I(0) and I (1) at 5 percent level of significance, more so with restricted constant and no trend. Importantly, none of the data series is I(2). Hence, the justification for using the ARDL model to estimate, since all the variables are stationary. Therefore, the study employed ARDL bounds testing procedures for establishing the long-run relationship between poverty, public expenditure and corruption.
ARDL Bounds Test
Table 3. F-Statistics for testing presence of long-run cointegration Model F-statistic
POV= f (EXE, EXS, CI) 4.6065**
(n= 21, k=3)
Narayan (2005) Critical Value Lower Bound I(0) Upper Bound I(1)
1% 4.614 5.966 5% 3.272 4.306 10% 2.676 3.586
Note: *, **, *** depicts 10%, 5% and 1% levels of significant, respectively. Critical values of Narayan (2005) was used (Table of Case II: restricted intercept and no trend at 5% level; pg. 27).
Source: Authors (2019)
Table 3 reveals the value of computed F-statistics as 4.6065, which is more than the upper bound value of Narayan (2005) critical value at 5 percent level of significance; this shows that there is a long-run cointegration relationship
84
among Poverty and its determinants-EXE, EXS and CPI. Hence, the rejection of the null hypothesis of no levels relationship and then proceed to estimate the long-run coefficients and short-long-run model.
Determination of Lag Structure
In Table 4, lag 1 was selected by the entire selection criterion at 5% level of significance. This selection is done automatically which included 20 observations after adjustments. This gives us the ARDL (1, 1, 0, 1).
Table 4. Lag Order selection criteria
Lag LR FPE AIC SC HQ
1 80.640* 1.66e+10* 34.843* 35.838* 35.037* 2 20.193 1.86e+10* 34.669* 36.459 34.972* 3 23.699 4.02e+09 31.944* 34.516* 32.299*
4 0.000 NA -185.015 181.682 -184.683
Note: * indicates the lag structure selected by the criterion and each test at 5% level.
Source: Authors (2019)
Long-run Coefficient
Table 5. Results for long-run coefficient Dependent variable: POV
Independent Variable coefficient t-ratio [prob]
C 12.80 0.660(0.520)
EXE (-1) -0.0365 -2.832 (0.014)
EXS -0.0041 -0.558 (0.585)
CI (-1) 2.0944 2.983 (0.010)
Source: Authors (2019)
Table 5 explains the coefficients of a long-run relationship between poverty rate, public expenditures and corruption. The result shows that expenditures on the economic sector and corruption are significant, while expenditures on social sectors is not significant. This means that a 1 per cent increase in expenditure on the economic sector in the lag period will bring about a decrease in poverty by 3.6%, which is in line with the studies of (Fan, Xiaobo, & Neetha, 2004; Jha et al., 2000; Ritwik & Joydeb, 2016; Edeme, Nkalu, & Ifelunini, 2016; Marisa & Iturbe-Ormaetxe, 2018), that says expenditures on education and health, leads to increase in economic growth and poverty reduction.
The relationship between corruption and poverty is positive and significant, which by implication means an increase in the CI in lag period, leads to increase in poverty in the current period in Nigeria. The reason been that, the public expenditure in that period would only be efficient if it translated into poverty reduction. The result means that a 1 percent increase in CI in the previous year (decrease in corruption) will lead to falling in poverty rate by 209 percent in the current year (Note: increase CI, means a reduction in corruption, because of the scaling; 0-most corrupt and 100-most clean). However, in this study, the corruption index remains below 30, which is not even up to 50, an evidence of persistent corruption in the country that militate against the impact of public expenditures on poverty reduction.
85
Short-run Coefficient
Table 6. Results for short-run coefficient and Error correction model Dependent variable: ∆PR
Independent Variable coefficient t-ratio [prob]
C 12.801 0.660(0.52)
∆EXE -0.0185 -2.739(0.016) **
∆CI 1.275 4.570(0.000) ***
ECM t-1 -0.564 -5.488 (0.000) ***
Note: ***, **depicts 1% and 5%level of significance respectively.
Source: Authors (2019)
Table 6 reports the short-run relationship between poverty, public expenditure and corruption with their error correction adjustment. It revealed expenditure on the economic sector has a negatively significant relationship with poverty at 5 per cent, while a positive significant relationship exist with corruption, which is the same with the long-run result. One of the important outcomes of this short-run result, is the error correction term coefficient, ECMt-1
which is correct in sign and as well significant at 1 percent. The coefficient of ECMt-1 shows the speed of adjustment back to the long-run equilibrium after a
short run shock. In this case, ECMt-1 is -0.564. This implies, the disequilibria of
the previous year's shock will adjust back to the long run equilibrium in the current year at the speed of 56 percent. It will also take the period of 1year 8months to adjust back to the long run equilibrium.
Based on the findings, only public expenditures on the economic sector (Agriculture, Construction, transport and communication) that have impacted on poverty as it ought to. Alternatively, expenditures on the social sector( education and Health) have not impacted at all, which is contrary to the studies of (Fan, Xiaobo and Neetha, 2004; Jha et al., 2000; Ritwik and Joydeb, 2016; Edeme,Nkalu, and Ifelunini, 2016; Marisa and Iturbe-Ormaetxe, 2018), that said otherwise. Corruption, on the other hand, was positively related and is significant. It means that as poverty index increases the poverty rate also increases in this context. This is because the corruption index has lingered below 28% which is less than 50%, hence its militating effect on public expenditure to achieving poverty reduction. This, therefore, revealed that corruption has militated against the impact of public expenditure on poverty, as the expenditures made does not impact on reducing poverty. This support previous findings by (Méon & Sekkat, 2005) that corruption “sands the wheels” but reject the findings from that of Mallik & Saha, (2016) that says corruption “greases the wheels”.
CONCLUSION
This study investigated the existence of long-run relationship between public expenditure and poverty in Nigeria at the same time verify whether
86
corruption affects poverty. Based on the findings, only public expenditures on the economic sector have impacted on poverty as it ought to. However, expenditures on the social sector (education and Health) have not impacted at all. Corruption, on the other hand, was positively related and is significant. It means that as poverty index increases the poverty rate also increases in this context. The study, therefore conclude that corruption in Nigeria is high such that it affects public expenditures impact on poverty, hence sands the wheels. The implication is that, if nothing is done to fight corruption to the lowest minimum, thereby allowing the public expenditure to direct impact on poverty. The study recommend for the strengthening of institutions and anti-graft agencies; increase public/civil servants’ salaries; present positive reward to the most honest, dedicated, transparent and accountable public officers in charge of contract award, public procurement, projects’ implementation and supervision, while negative rewards be given to violators and defaulters of the rightful and constitutional way of doing business. Further study to be conducted on other indicators of governance like political instability and government effectiveness, to ascertain its direct impact on expenditures meant for pro-poor.
REFERENCES
Aigheyisi, O. (2015). Corruption, Government Expenditures and Economic Performance: Nigeria’s Experience in the New Democratic Era (1999-2012). African Journal of Sustainable Development, 5(1), 17–38. Retrieved from https://www.ajol.info/index.php/ajsd/article/view/121714
Aluko, Y. (2009). Corruption in Nigeria: Concept and Dimensions. Anti-Corruption Reforms in Nigeria since 1999, Issues, Challenges and the Way Forward. In IFRA Special Research Issue. Retrieved from https://www.academia.edu/21412993.
Del Monte, A., & Papagni, E. (2007). The determinants of corruption in Italy: Regional panel data analysis. European Journal of Political Economy, 23(2), 379–396. https://doi.org/10.1016/j.ejpoleco.2006.03.004
Dukku, A. M. (2012). “Anti-Corruption Strategies in Nigeria: A Sociological Discourse” in Mohammed, H. Aluigba, M.T. and Kabir. A. (Eds) Corruption, Governance and Development in Nigeria: Perspectives and Remedies. (1st ed.). Kano: Mambayya House.
Duru, E. J. C. (2012). “Nigeria’s Anti-Graft Agencies: The Journey So Far” in Mohammed, H. Aluigba, M.T. and Kabir. A. (Eds) Corruption, Governance and Development in Nigeria: Perspectives and Remedies. (1st ed.). Kano: Mambayya House.
Edeme, R.K., Nkalu, C.N. & Ifelunini, I. (2017). Distributional impact of public expenditure on human development in Nigeria. International Journal of
Social Economics, 44(2), 1683–1693.
https://doi.org/http://dx.doi.org/10.1108/MRR-09-2015-0216
Edrees, A., Azali, M., Azman, H. & Nor, N. (2016). " The impact of government spending, trade, foreign aid and foreign direct investment on poverty reduction in Africa. International Journal of Economics and Management
87
Sciences, 4, 308. https://doi.org/doi:10.4172/2162-6359.1000308
Fan, S., Xiaobo, Z. & Neetha, R. (2004). Public expenditure, growth and Poverty Reduction in rural Uganda (DSGD discussion Paper 4).
Fokuoh A. E. (2008). The fight against corruption and its implications for development in developing and transition economies. Journal of Money
Laundering Control, 11(1), 76–87.
https://doi.org/10.1108/13685200810844514
Gukat, B.T & Ogboru, I. (2017). “An Emperical Analysis of Goverment Expenditure and economic growth in Nigeria.” Journal of Economics and Development Studies, 5(4), 122–130. Retrieved from http://jedsnet.com/journals/jeds/Vol_5_No_4_December_2017/11.pdf
Ikubaje, J. (2014). Nigeria Anti-Corruption Initiatives and the Constitution. In Centre for Democracy and Development. Lagos. Retrieved from https://www.academia.edu/5806946
Jha, R., Biswal, U. D., & Biswal, B. P. (2000). An Emprical Analysis of the Impact of Public Expenditure on Education and Health on Poverty in Indian States. SSRN Electronic Journal. https://doi.org/10.2139/ssrn.236888
Mallik, G., & Saha, S. (2016). Corruption and growth: a complex relationship. International Journal of Development Issues, 15(2), 113–129. https://doi.org/10.1108/IJDI-01-2016-0001
Marisa, H. H., & Iturbe-Ormaetxe, I. (2018). Long-run effects of public expenditure on poverty. Journal of Economic Inequality, 16(1), 1–22. https://doi.org/10.1007/s10888-017-9360-z
Mauro, P. (1997). Why worry aboutCorruption. Economic Issues, International Monetary Fund, 6, 19. https://doi.org/10.1016/0277-9536(94)90455-3
Méon, P. G., & Sekkat, K. (2005). Does corruption grease or sand the wheels of growth? Public Choice, 122(1–2), 69–97. https://doi.org/10.1007/s11127-005-3988-0
Narayan, P. K. (2005). “ The saving and investment nexus for China: evidence fromcointegration tests.” Applied Economics, 37(17), 1970–1990. https://doi.org/10.1080/00036840500278103 · Source: RePEc
NBS. (2012a). Nigeria Poverty Profile Report 2010. Retrieved from http://www.nigerianstat.gov.ng/
NBS. (2012b). OVERVIEW OF THE HNLSS 2009/2010 SURVEY. Retrieved from http://www.nigerianstat.gov.ng/
Obadan, M. (2001). Poverty reduction in nigeria; way forward. Economic and Financial Review, 39(4), 159–188. Retrieved from reasearch gate
Odior, E. S.(2014). Government expenditures on education and poverty reduction: implications for achieving the MDGs in Nigeria. Asian Economic and Financial Review, 4(2), 150–172. Retrieved from ProQuest central
Olarewaju, F. (2016). Government Spending, Corruption and Output Growth in Nigeria. European Scientific Journal, 12(16), 291–312. https://doi.org/10.19044/esj.2016.v12n16p291
Omagbon, A .O., Enofe, C. L. & Oriaifoh, P. (2016). Poverty and Unemployment and Corruption in Nigerian Public Sector, 2(2), 79–90.
Osei‐Tutu, E., Badu, E., & Owusu‐Manu, D. (2010). Exploring corruption practices in public procurement of infrastructural projects in Ghana. International Journal of Managing Projects in Business, 3(2), 236–256.
88
https://doi.org/10.1108/17538371011036563
Ovat, O. O., & Bassey, E. E. (2014). Corruption , Governance and Public Spending in Nigeria : Implications for Economic Growth. British Journal of Economics, Management & Trade, 4(11), 1679–1699. Retrieved from http://www.journalrepository.org/media/journals/BJEMT_20/2014/Jun/Ovat 4112014BJEMT10531_1.pdf
Ravallion, M. (2017). Povert comparisms. Routledge. Retrieved from https://books.google.com.my/books/about/Poverty_Comparisons.html?id=lu 7Ddc3U9qoC&redir_esc=y
Ritwik, S. & Joydeb, S. (2016). Public expenditures, Economic growth and Poverty alleviation. International Journal of Social Science, 43(6), 604–618. https://doi.org/10.1108/09574090910954864
Sen, A. (1981). Poverty and Famines. Oxford: Clarendon Press. Sen, A. (1999). Development as freedom. New York: Alfred A. Knopt.
Shleifer, A. and Vishny, R. . (1993). Corruption. Quarterly Journal of Economics, 108, 599–617.
Tanzi, V. & Davoodi, H. (1997). Corruption, public investment and growth ,In:Shibata, H. and Ihori, t. (eds) “The welfare state, public investment and growth.” Springer, Tokyo.
Timofeyev, Y. (2011). How corruption affects social expenditures:evidence from Russia. Global Journal of Business Research, 5, 39–51.
Transparency International.(2017). Corruption Perception index. Retrieved from www.transparency.org/news/feature/corruption_perception_inbex_2016#tabl e
Transparency International. (2018). Corruption Perception index. Retrieved from www.transparency.org/news/feature/corruption_perception_inbex_2017#tabl e
Treisman, D. (2000). The causes of corruption: a cross-national study. Journal of Public Economics (Vol. 76). https://doi.org/10.1016/S0047-2727(99)00092-4 United Nations. (2016). Common Country Analysis. Retrieved from
https://unsco.unmissions.org/sites/default/files/cca_report_en.pdf
Wei, S. (2001). “Corruption in Economic Transition and Development: ”Grease or Sand". In Spring Seminar. Geneva. Retrieved from https://www.unece.org/fileadmin/DAM/ead/sem/sem2001/papers/Wei.pdf Wilhelm, V., & Fiestas, I. (2005). Exploring the Link Between Public Spending
and Poverty Reduction Lessons from the 90s. Washington DC: World Bank
Institute. Retrieved from
http://documents.worldbank.org/curated/en/501641468324280601/ World Bank. (1994). Governance: The World Bank’s Experience.
World Bank. (2018a). Poverty:Overview. Retrieved December 12, 2018, from https://www.worldbank.org/en/topic/poverty/overview
World Bank. (2018b). World Development Indicators. Washingtong D.C. Retrieved from http://databank.worldbank.org/data/source/world-development-indicators#
World Bank. (2018c). World Development indicators:GDP per capita (current
US$). Retrieved from